


The Ethereum (ETH) price has fallen since reaching its yearly high of $2,717 on January 12.
The price returned to a horizontal range that has existed for 54 days. It bounced at the range low and is approaching the range high.
Ethereum Deviates Above Resistance
The weekly time frame technical analysis shows that the ETH price has increased since June 2022, creating three higher lows (green icons). The most recent was in October 2023, accelerating the rate of increase.
The upward movement took ETH to a high of $2,717 in January 2024, above an important Fib and horizontal resistance area.
However, the Ethereum price could not sustain its increase and fell below the area last week, creating a bearish candlestick. This movement points to the previous breakout being illegitimate.
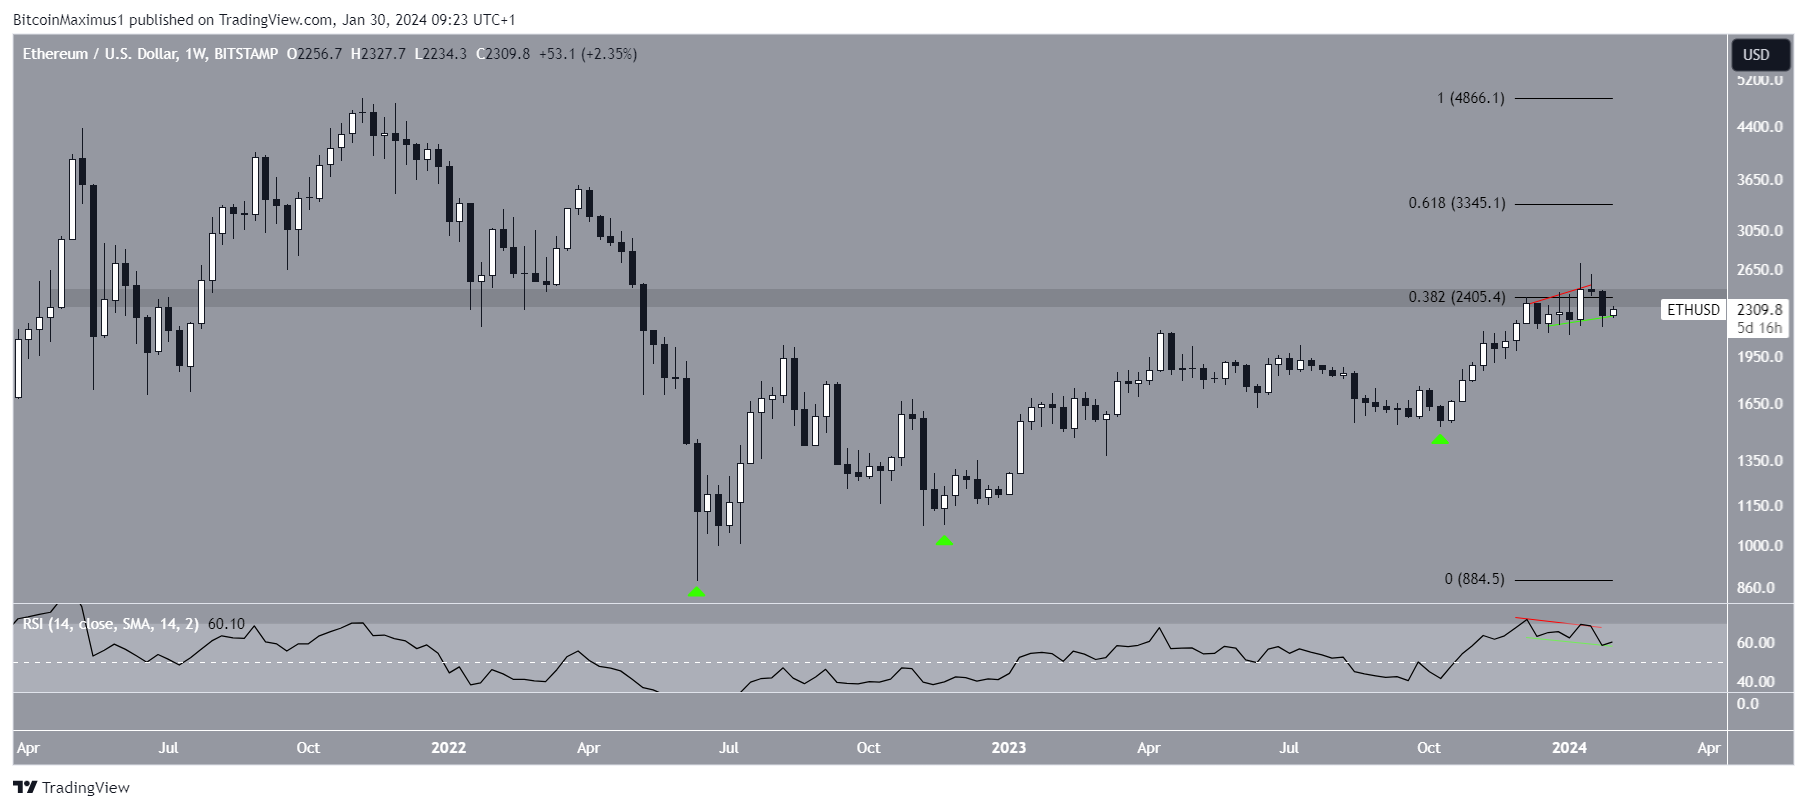
The weekly Relative Strength Index (RSI) gives a mixed reading. Market traders use the RSI as a momentum indicator to identify overbought or oversold conditions and to decide whether to accumulate or sell an asset.
Readings above 50 and an upward trend indicate that bulls still have an advantage, whereas readings below 50 suggest the opposite.
While the RSI is falling, it is above 50. Also, it generated a bearish divergence (red) before the decrease but followed that with a hidden bullish divergence (green), effectively canceling each other out.
Read More: What Is Wrapped Ethereum (WETH)?
What Are Analysts Saying?
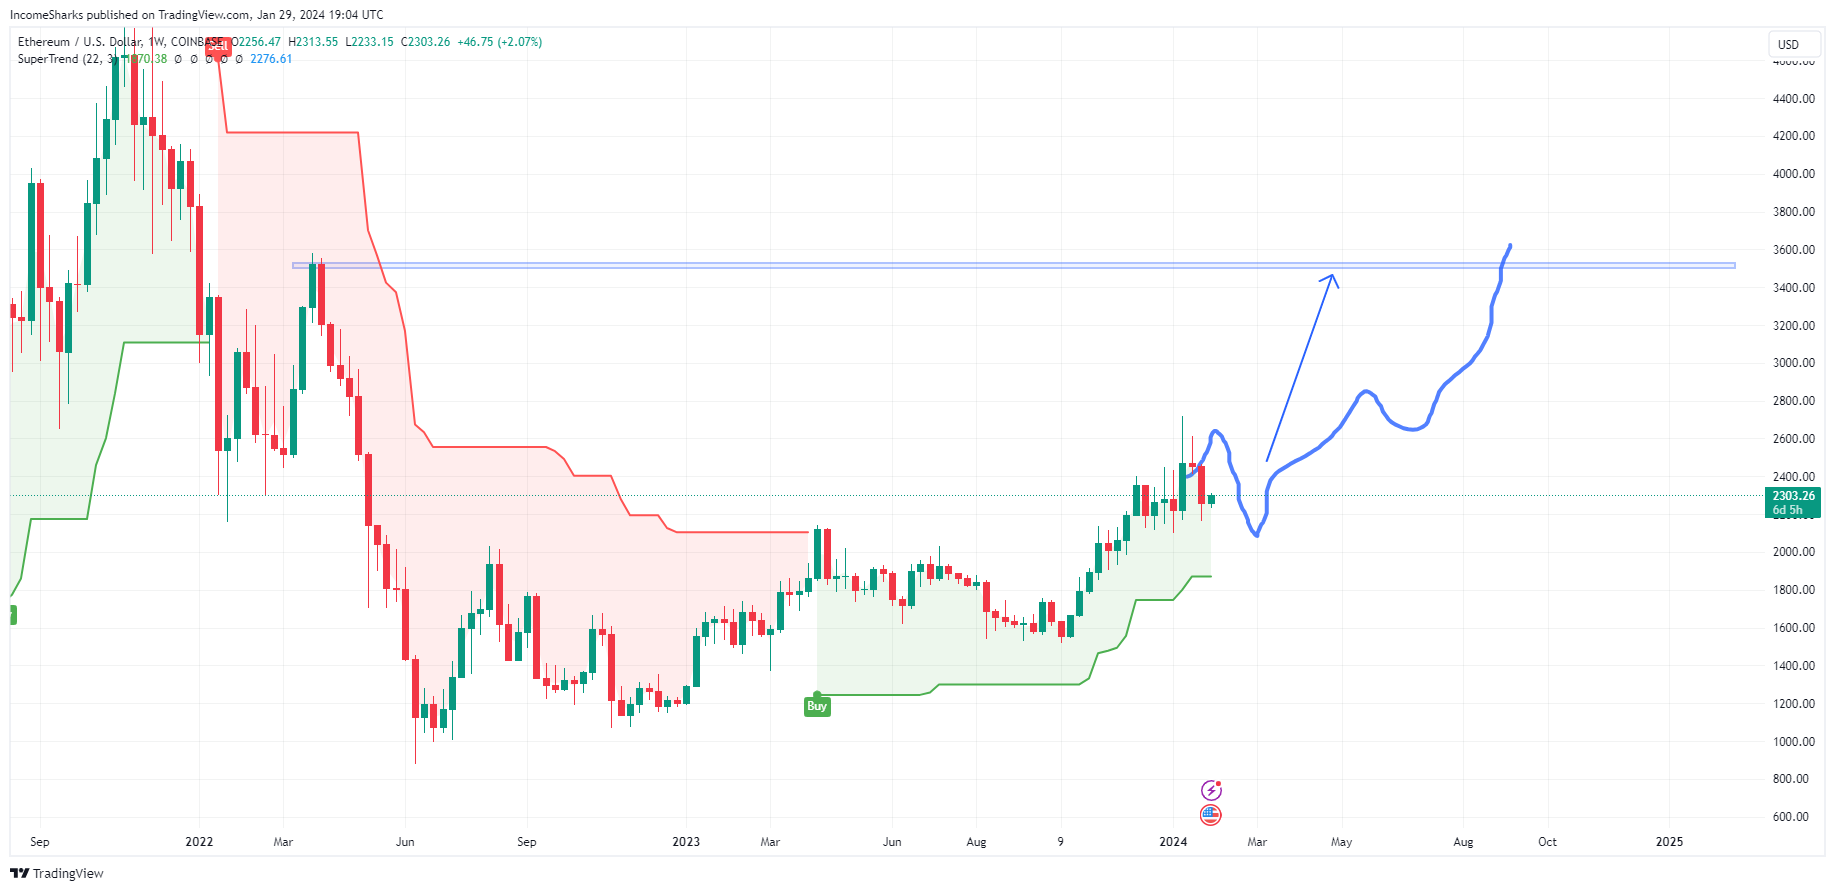
Cryptocurrency analysts and traders on X are bullish on the Ethereum future trend.
Income Sharks believes that the ETH price will gradually increase toward $3,500.
Eliz883 tweeted a breakout from a descending resistance trend line, suggesting it will increase to $2,400. Inmortalcrypto has similar thoughts, but he indicates the price will increase to $2,500.
Read More: How To Buy Ethereum (ETH)
ETH Price Prediction: Relief Rally or Reversal?
Similarly to the weekly time frame, the daily one leans bearish. Firstly, it shows that ETH deviated above its range high of $2,375 (red circle). Besides this deviation, the ETH price has traded in this range for 54 days. More importantly, the RSI insinuates the upward movement is over.
Once ETH started its upward movement from $1,500 in October 2023, the RSI increased above 50 (green icon). It stayed there until the price fell back inside the range on January 22, 2024 (red icon).
The indicator could validate the 50-trend line as resistance (red circle). This could coincide with another retest of the range high at $2,375, which also coexists with the 0.382 Fib retracement resistance level.
Then, if the ETH price breaks down from the range, it can fall 17% to the closest support at $1,900.
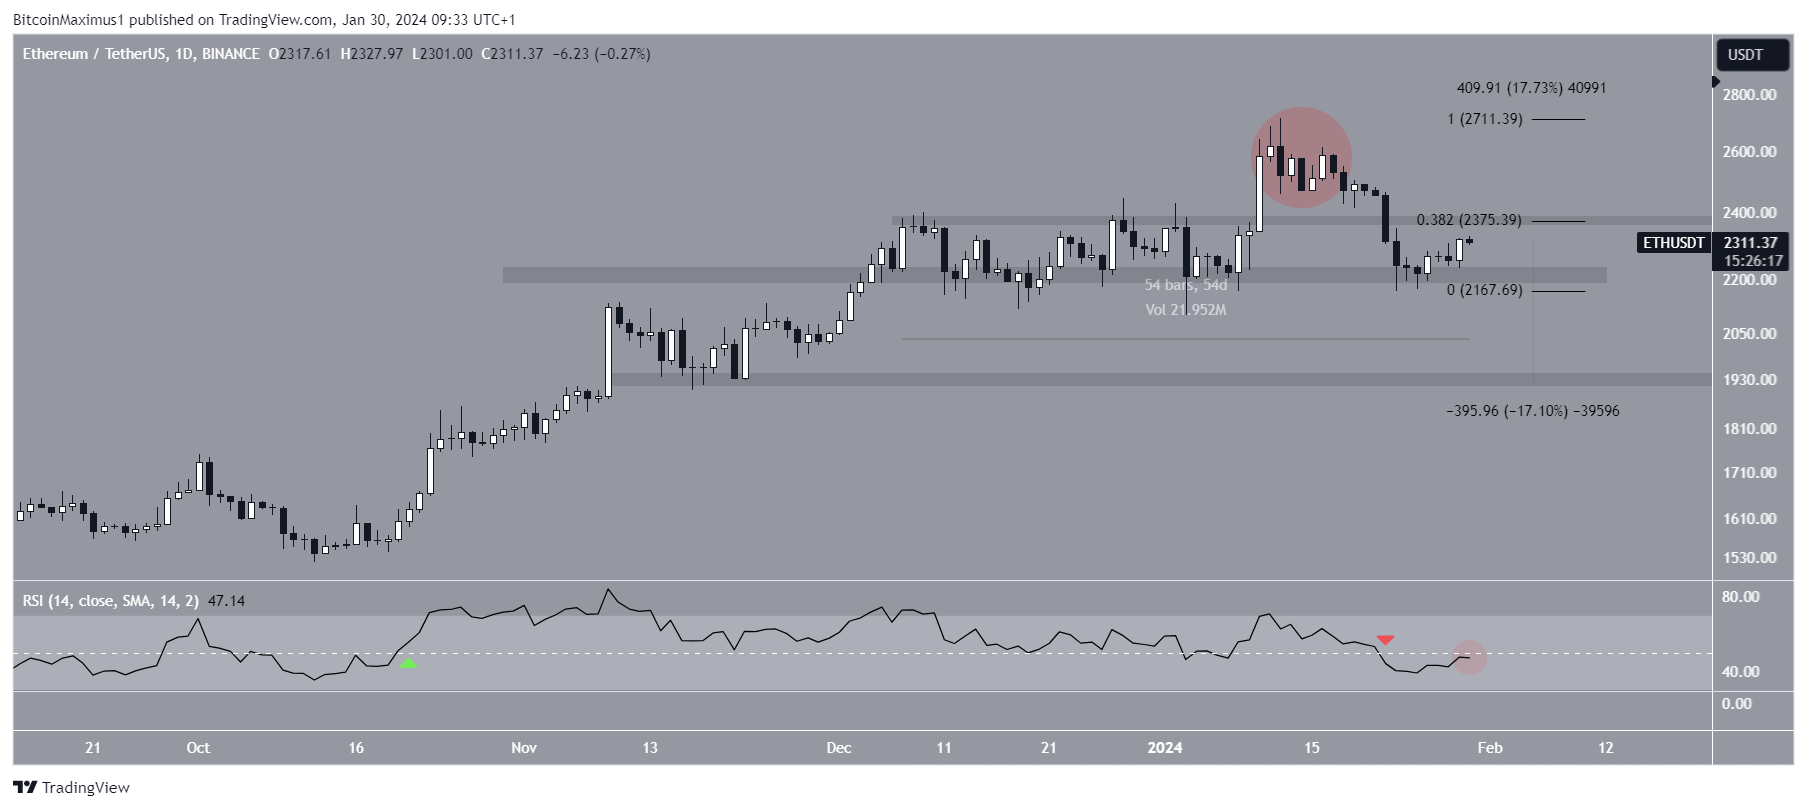
Despite this bearish ETH price prediction, a close above-the-range high of $2,375 can trigger an 18% increase to the previous high near $2,700.
For BeInCrypto‘s latest crypto market analysis, click here.


