The Litecoin (LTC) price has fallen below a critical horizontal area, invalidating the previous breakout and suggesting the decrease will continue.
Despite this bearish forecast from the daily time frame, short-term readings are more bullish. This is due to the presence of a bullish pattern and a confluence of support levels just below the current price level.
Litecoin Price Deviates and Falls Below Resistance
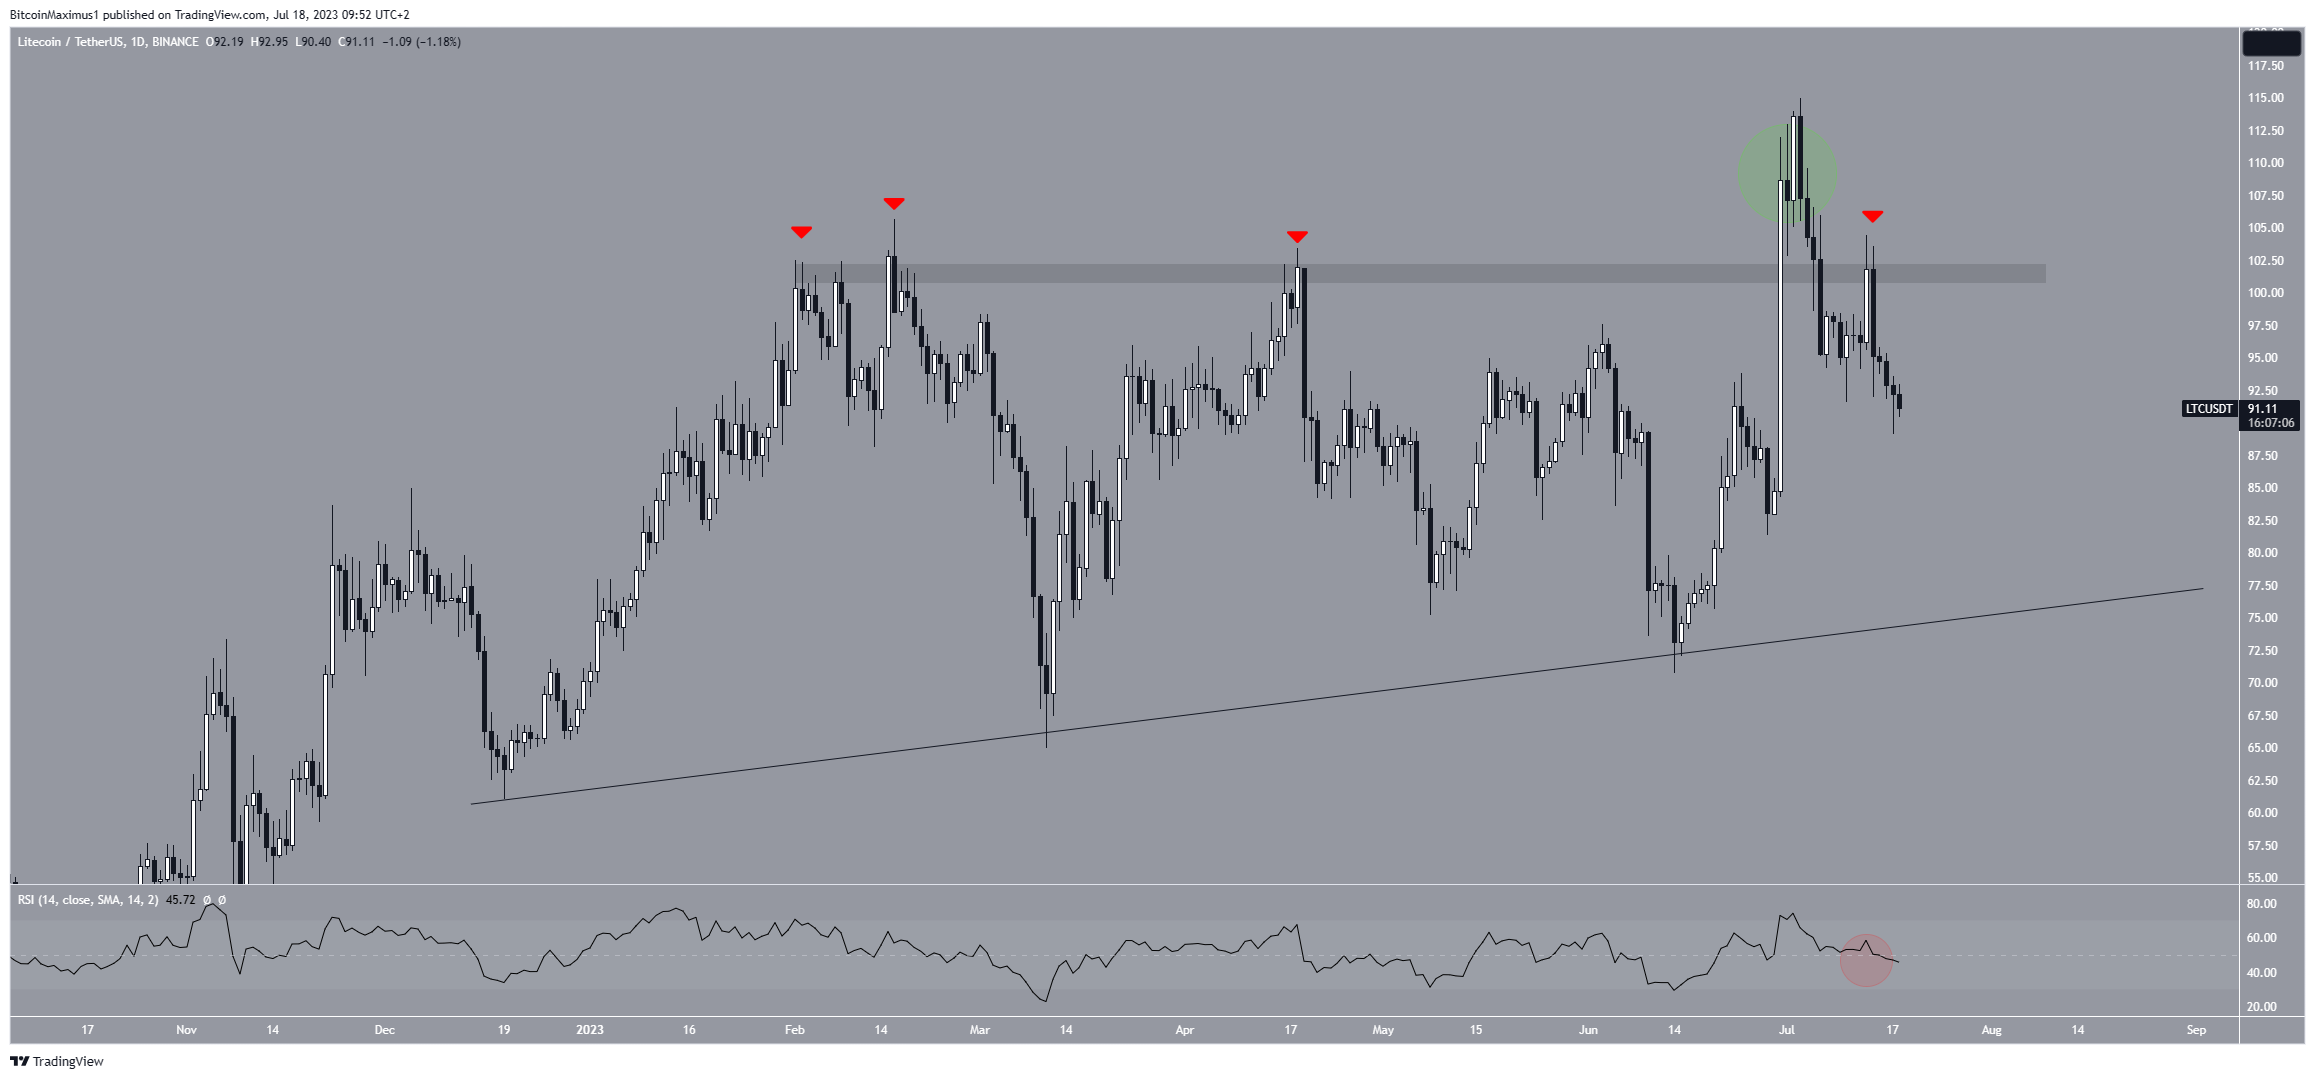
The technical analysis of the daily time frame shows that the LTC price has fallen since reaching a high of $115 on July 3. The decrease took the price below the $100 horizontal area, which was then validated as resistance (red icon). Therefore, the previous breakout above the area is considered a deviation (green circle).
Read More: Top 11 Crypto Communities To Join in 2023
The LTC price currently trades at $91, approaching an ascending support line at $80.

The daily RSI is bearish, supporting the continuation of the decrease. Traders utilize the RSI as a momentum indicator to assess whether a market is overbought or oversold and to determine whether to accumulate or sell an asset.
If the RSI reading is above 50 and the trend is upward, bulls still have an advantage, but if the reading is below 50, the opposite is true. The indicator is below 50 (red circle) and falling, indicating a bearish trend.
Read More: 6 Best Copy Trading Platforms in 2023
LTC Price Prediction: Will Short-Term Pattern Spark Reversal?
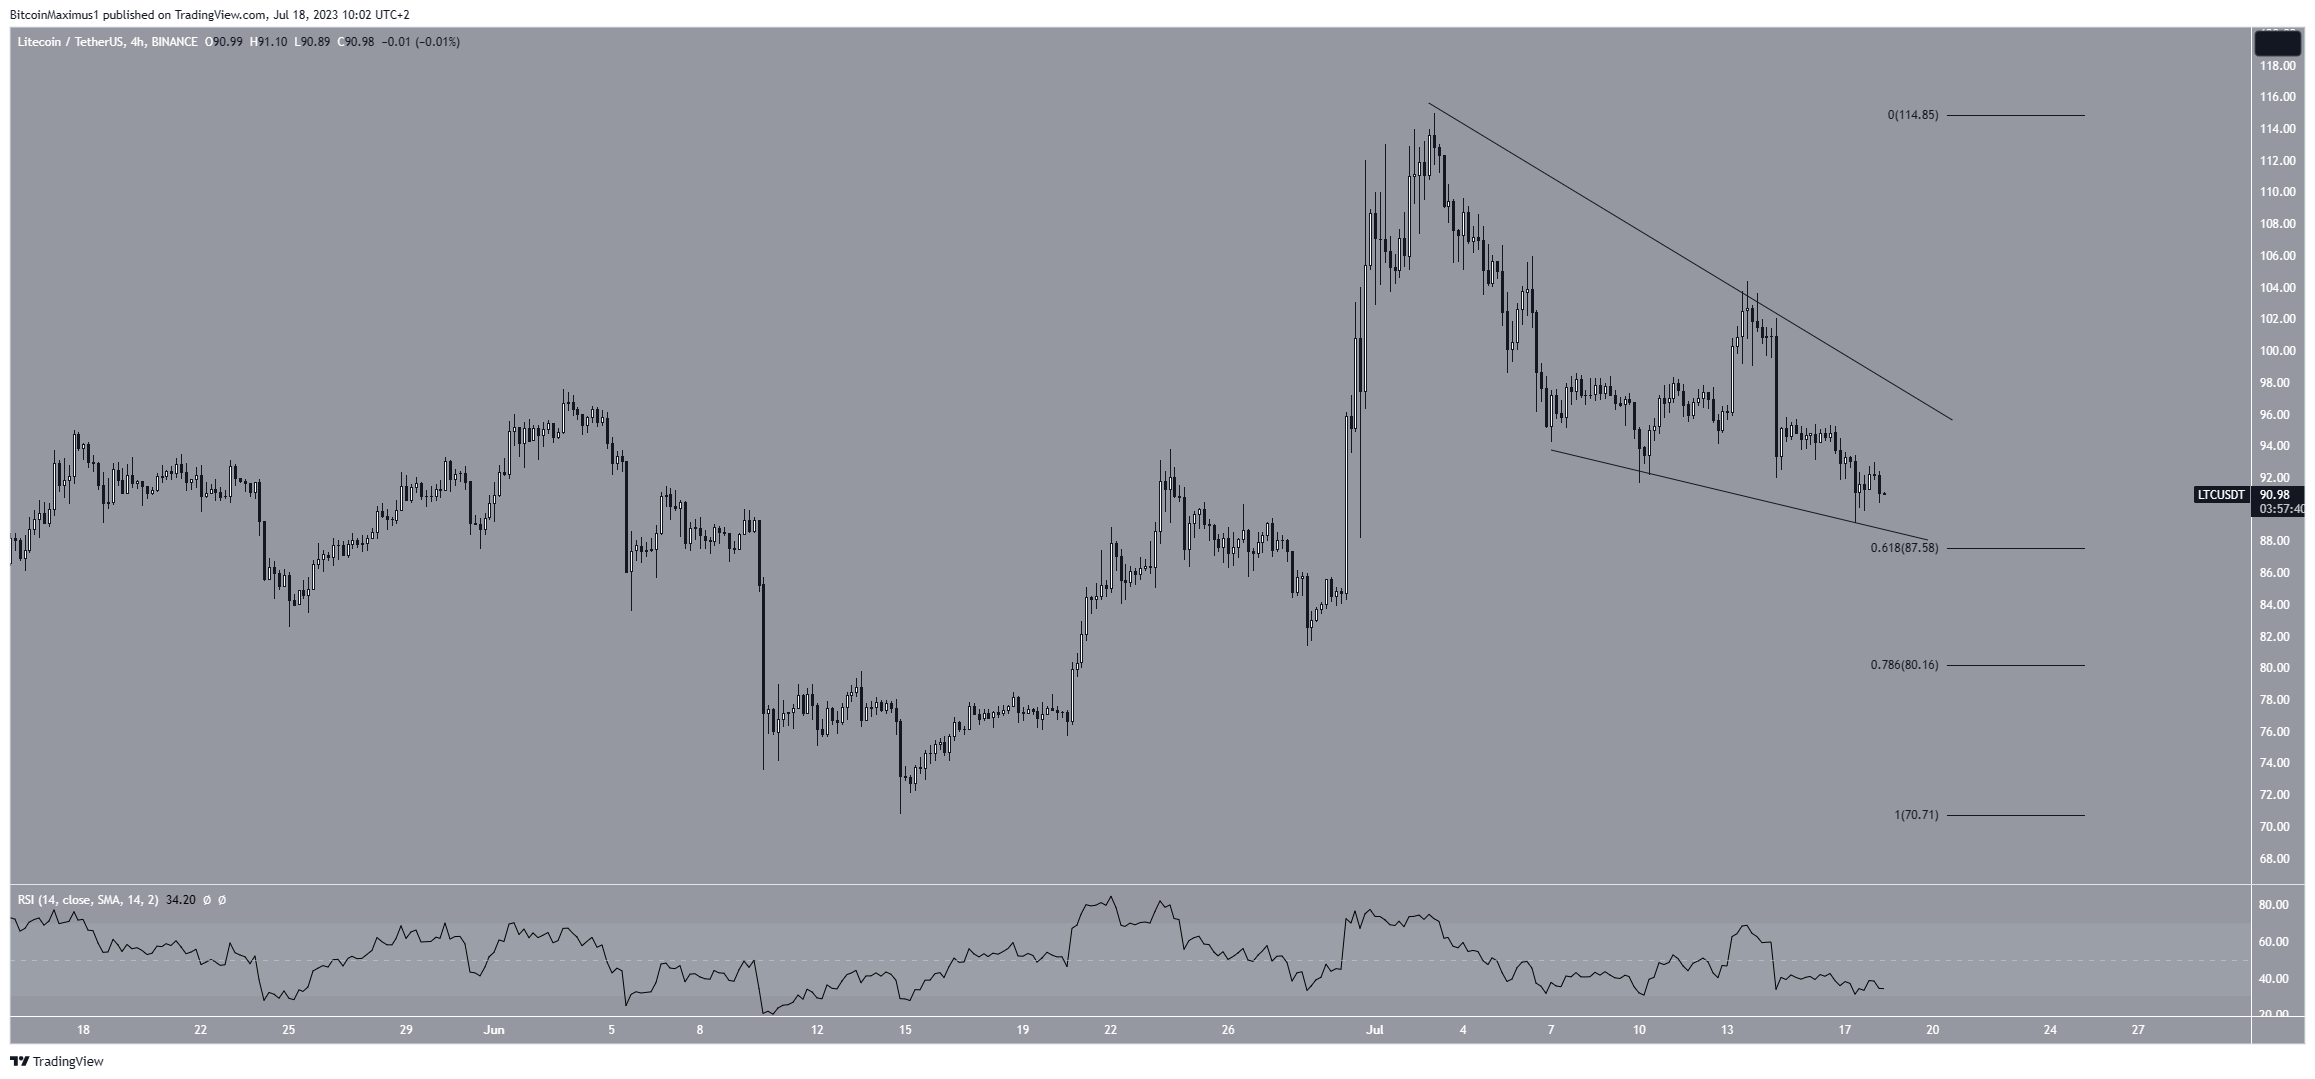
Unlike the daily chart, the short-term four-hour one gives hope for a bullish trend reversal. This is because the price is trading inside a descending wedge, considered a bullish pattern.
Moreover, the price is approaching a confluence of support levels created by the wedge’s support line and the 0.618 Fib retracement support level. The principle behind Fibonacci retracement levels suggests that after a considerable price movement in one direction, the price will retrace or go back partially to a previous price level before continuing in its original direction.
So, it is possible that the area will initiate a bounce and eventual breakout from the wedge.
However, the RSI does not yet confirm this possibility. The indicator is below 50 and has not generated bullish divergence, a sign often preceding trend reversals.

Despite this bullish short-term LTC price prediction, a breakdown from the wedge will likely catalyze a drop to $80.
For BeInCrypto’s latest crypto market analysis, click here
Disclaimer
In line with the Trust Project guidelines, this price analysis article is for informational purposes only and should not be considered financial or investment advice. BeInCrypto is committed to accurate, unbiased reporting, but market conditions are subject to change without notice. Always conduct your own research and consult with a professional before making any financial decisions. Please note that our Terms and Conditions, Privacy Policy, and Disclaimers have been updated.


