

Chainlink (LINK) is a popular decentralized project focusing on real-world and blockchain connections. Simply put, Chainlink is an Oracle network helping smart contracts pick data from external sources and off-chain feeds. This LINK price prediction looks at the impact of the broader crypto market on the price of LINK tokens, the state of Chainlink fundamentals, tokenomics, and other key metrics.
NOTE: This article contains out of date figures and information. It will be updated with fresh analysis for 2025 and beyond in the New Year. In the meantime, please see our Chainlink Price Prediction tool for the most recent, data-informed projections.
- Chainlink fundamentals and price movements
- Chainlink tokenomics and the impact on LINK tokens
- Chainlink price forecast and other key metrics
- LINK price prediction and technical analysis
- Pattern identification
- Chainlink (LINK) price prediction 2023
- Chainlink (LINK) price prediction 2024
- Chainlink (LINK) price prediction 2025
- Chainlink (LINK) price prediction 2030
- Chainlink (LINK’s) long-term price prediction until the year 2035
- Is this LINK price prediction model accurate?
- Frequently asked questions
Want to get LINK price prediction weekly? Join BeInCrypto Trading Community on Telegram: read LINK price prediction and technical analysis on the coin, ask and get answers to all your questions from PRO traders! Join now
Chainlink fundamentals and price movements
A network as popular as Chainlink responds to market sentiments, especially when the focus is on newer developments.
The newest feather in the network’s cap is MakerDAO connecting with a Chainlink Oracle to maintain the stability of its stablecoin DAI. Another achievement is BENQI — an Avalanche-based money market — using Chainlink to improve the borrowing and lending features.
BENQI uses Chainlink’s PoR feed, focusing on on-chain automated verification, decentralization, transparency, and high data quality.
Did you know? Chainlink Economics 2.0 comes forth as a multi-pronged aim to increase adoption, with the primary focus on working around the Chainlink Network security. This plan aims to focus on fee-sharing, subscription models, usage-based fees, and other components.
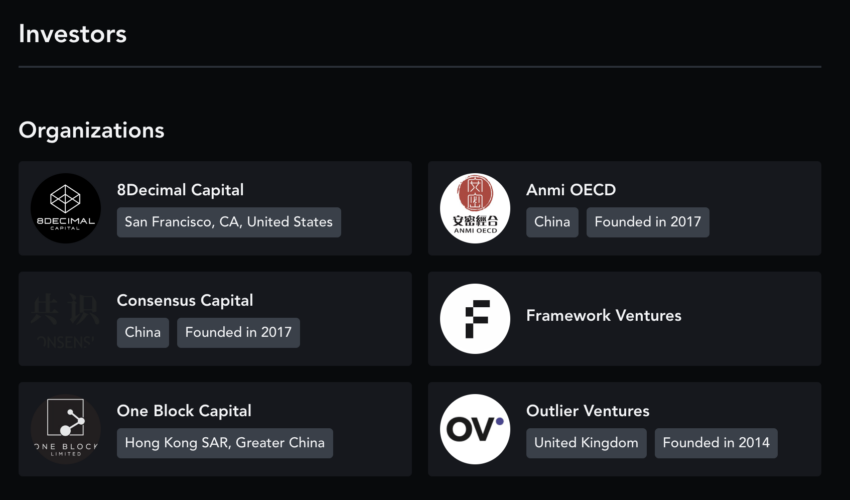
That’s what Chainlink is currently bringing to the table. The network also has a decent lineup of investors, including Consensus Capital.
Here are some of the additional insights relevant to Chainlink:
- One of the first ecosystems to support real-world and blockchain integrations.
- Chainlink is and will be working closely with AAVE, Compound, Synthetic, and other DeFi apps.
- Real-world organizations like FedEx and AccuWeather have Chainlink as a data verification platform.
- LINK tokens support staking and play a major role in securing the network.
“Chainlink is just getting started. From inception to today, the foundation was built. From 2024 onward, the mega mansion will be built (and tokenized).”
Ken Linkwell, Chainlink Node Operator: X
Chainlink tokenomics and the impact on LINK tokens
LINK tokens have a supply cap of 1 billion. As of December 21, 2023, 56.81% of the total supply makes the circulating supply. The best thing about the tokenomics model of Chainlink is that all the 1 billion tokens were offered initially, per the following transparent distribution.

LINK tokens work like standard payment options, dedicated to the node operators offering Oracle services. Plus, oracle services can even stake LINK for earning passive income. However, not offering services can lead to slashing. The above ensures LINK’s holding and staking pattern is highly open and transparent.
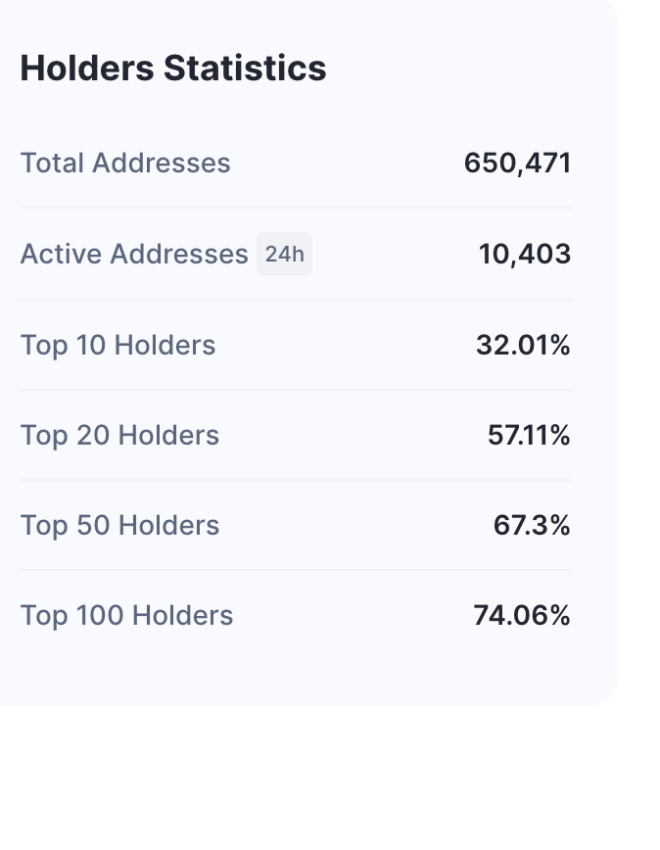
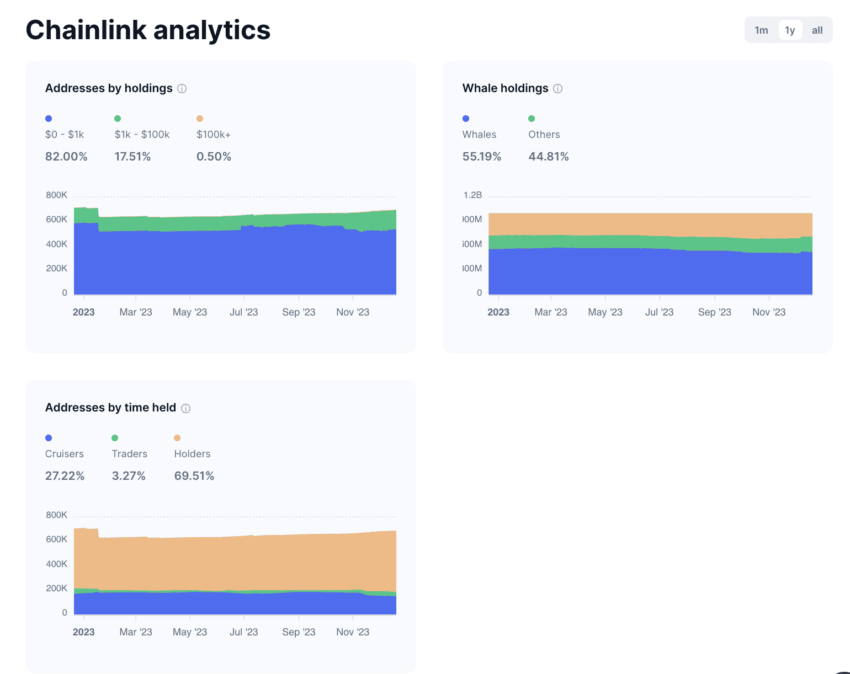
Looking at the holding pattern, the top 100 LINK holders managed over 74% of the total supply, in February 2023. However, the inclusion of staking makes a market-wide sell-off less likely. As of December 2023, the LINK Whales control 55.91% of the supply, which can be a concern if they start dumping assets after the rally.
Chainlink price forecast and other key metrics
We shall now look at the on-chain metrics of Chainlink on Ethereum. Notice that as it is an Oracle platform, it has a presence on Ethereum’s layer-2 solutions like Arbitrum and Optimism, among others. Plus, it is also active on the BNB chain.
If you are worried about the prices of LINK tokens dropping overnight, here is an interesting chart. The orange line signifies price volatility and seems to be moving down. Notice that the prices have increased slightly after every volatility drop since August 2022. That keeps us optimistic about the short-term LINK price prediction in early 2023. And a price surge followed, soon.
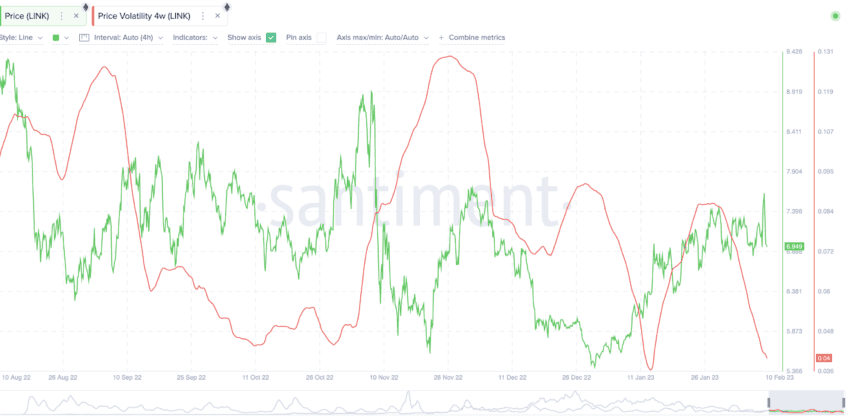
If we look at the current volatility chart, the metric seems to have bottomed out — a good reason for the price surges.
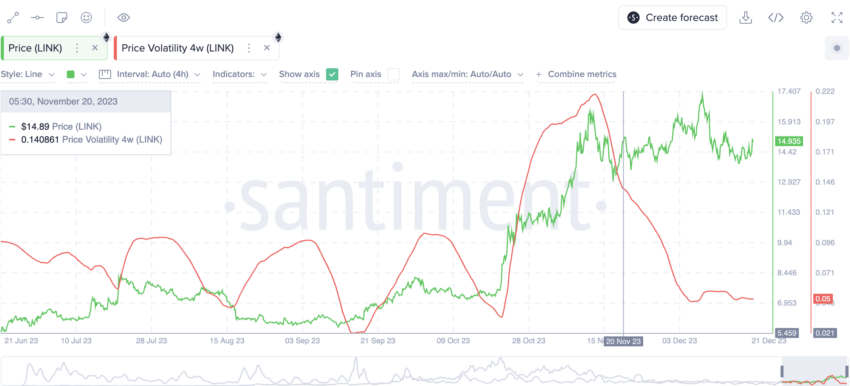
Notice that the prices have been moving up steadily in 2023. The peak in the number of daily active addresses might be the reason for this steady price rise, something we charted in February 2023.
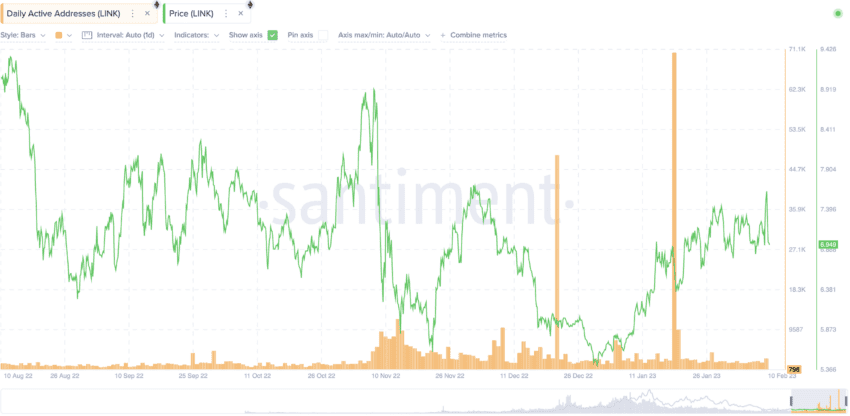
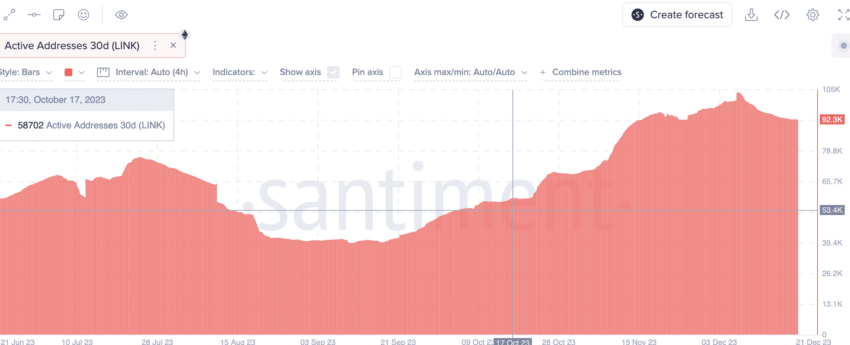
The latest, 7-day active address metric also shows continued strength, hinting at increased adoption and chances at new rallies.
The exchange inflow over the past 30 days shows an interesting trend surfacing. Despite the increasing prices, the Exchange Inflow metric is seemingly flat, showing confidence and a lack of selling intent.
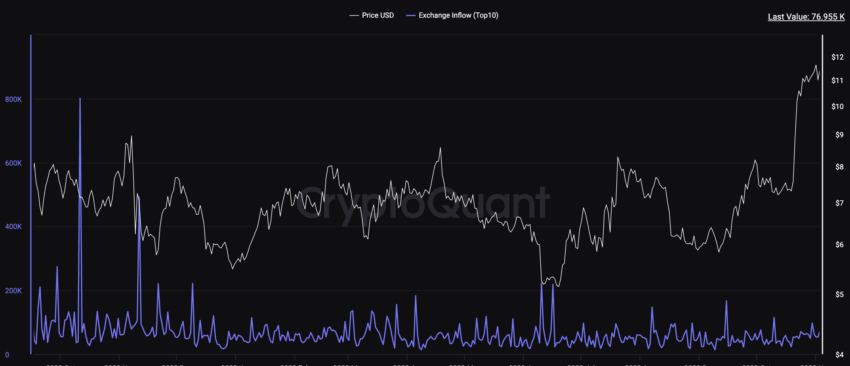
The metrics suggest that that link might be ready for new rallies rather soon. Even the overall broader, long-term trend looks strong for now, courtesy of the supposed drop in volatility.
LINK price prediction and technical analysis
Our early 2023 analysis
Per our previous short-term analysis, we pinpointed a few crucial resistance levels for LINK. To our expectations, LINK crossed everyone and scaled new highs. Here is what our analysis discussed:
We’ve explained that Chainlink might see some consolidation or even correction in the short term. Here is why:
If you look at the 4-hour chart, there is a clear rising wedge pattern in play. Notice that at $6.98, the price of LINK is trading very close to the ascending lower line. If LINK breaks the pattern and falls lower, the immediate resistance could be at $6.81 — below which there could be more pain for short-term LINK evangelists.
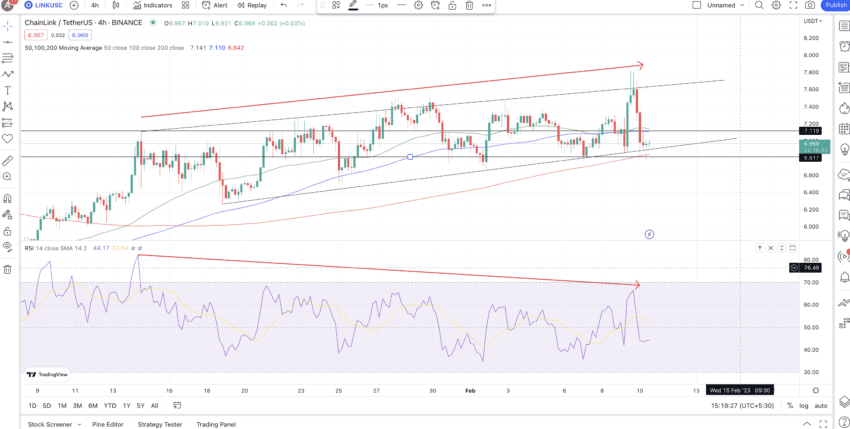
A move above and a closing candle above $7.12 can invalidate this bearish trend. Also, notice that the recent RSI peak has formed a bearish divergence with the price — marked by the arrow. This explains the recent price dip.
Our December 2023 analysis
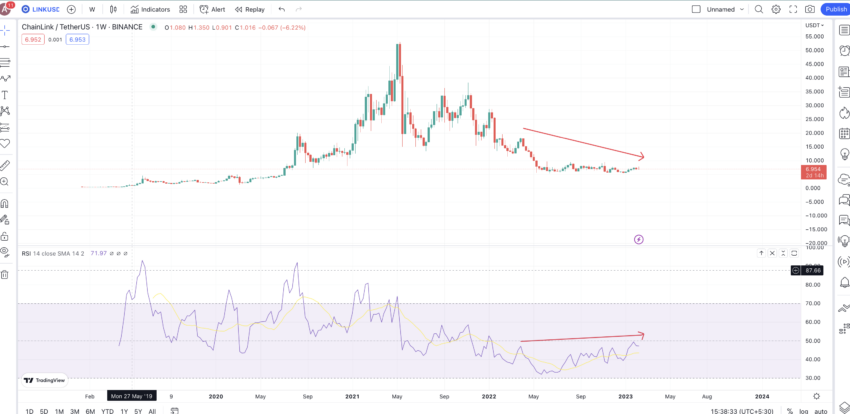
The LINK/UST chart reveals an interesting pattern. Firstly, the current price of LINK seems to be fresh out of the bearish divergence, as showcased by the dipping RSI. Additionally, LINK is trading inside an ascending channel with the last candle, as of press time, closer to the lower trendline. A breach under the $13.5 mark can bring in new buyers, as the prices might consolidate further.
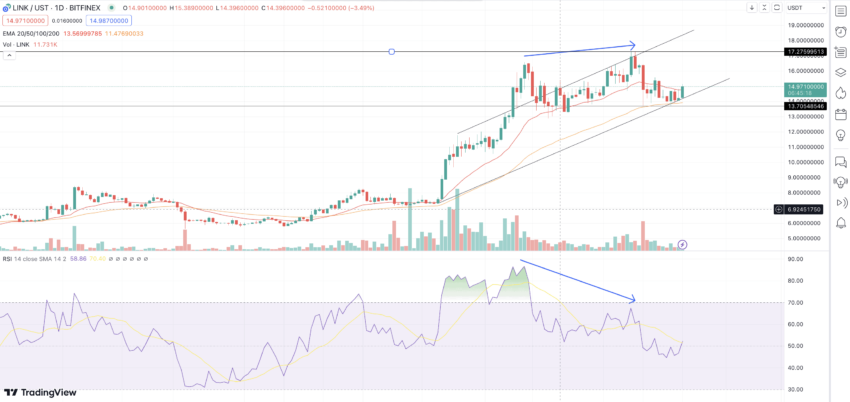
A surge above the $17 level market might invalidate the bearish trend. We have calculated the short-term price prediction of this decentralized Oracle network. Now let us take a closer look at the weekly technical analysis to locate future price movements.
Pattern identification
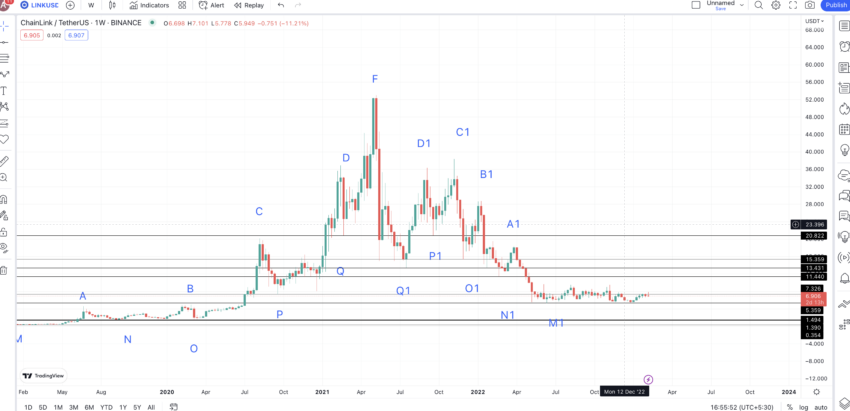
The weekly LINK-USDT chart reveals a standard foldback pattern. There are a few standard higher highs before the peak at $52.88. The prices have since gone downhill, making a few lower highs along the way.
As you can see, the chart reveals a few other lower highs, but we have only considered the most crucial ones.
However, a new up-trending pattern might show up at LINK’s counter. The weekly RSI seems to form a bullish divergence, moving higher than the prices. Hence, we can expect the price of LINK tokens to move higher in the mid-term, pushing the same towards the left side of the chart or a higher-high pattern.
Let us mark all the key levels on the weekly chart.
Price changes
The weekly RSI hints that the price of LINK might trace the A to F path all over again, kickstarting a new pattern. The last identified low or M1 could be the M of the new pattern. Our next target or the maximum price of LINK for 2023 could start a new trend, with that point being A2.
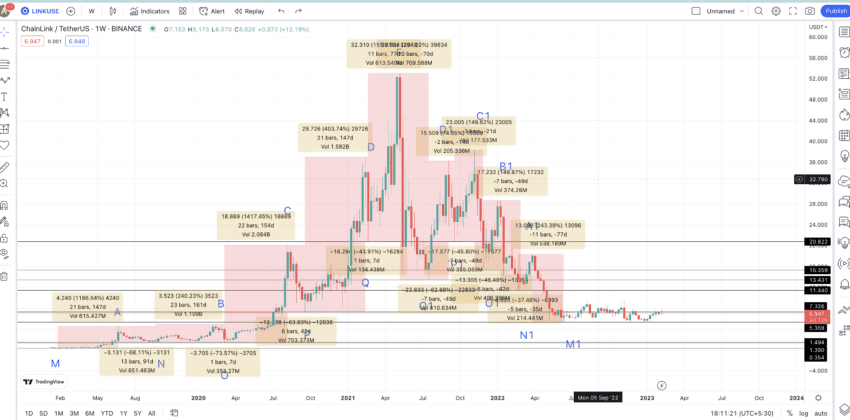
So, we need to locate A2 first. For that, let us locate the average price percentage changes and distance between all the points corresponding to two paths: M to F and M1 to F.
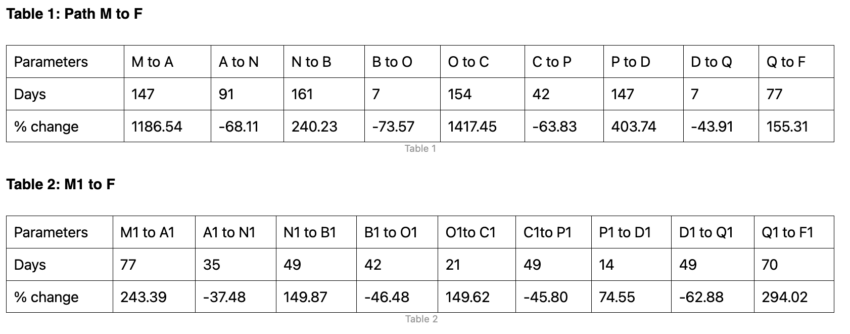
Having gathered the necessary data, we can now compute the average values for the low-to-high and high-to-low points, both in terms of percentage and distance. The average for a low-to-high movement is found to be 416.48% over 92 days. Conversely, the high-to-low average is calculated at -62.31%, typically occurring within 40 days. We can use these datasets to calculate the next set of points in this pattern.
Chainlink (LINK) price prediction 2023
Our LINK price prediction exceeded expectations. Here is how we analyzed LINK in 2023:
Now that we have the previous low or M1, we can draw a path using the low-to-high levels to plot the next point or A2. As the broader crypto market is still weak, we expect the LINK price prediction model to follow a maximum hike of 74.55% (lowest as per table 1) and in almost 161 days (max distance as per table 1).
However, if you look carefully, LINK had already moved that high, reaching $9.40 in the process, somewhere in early November.
So we had our A2 in 2022. From this point, we expect LINK to drop by 37.48% (instead of the average of 62.31%). This is because the market isn’t as weak as was imagined.
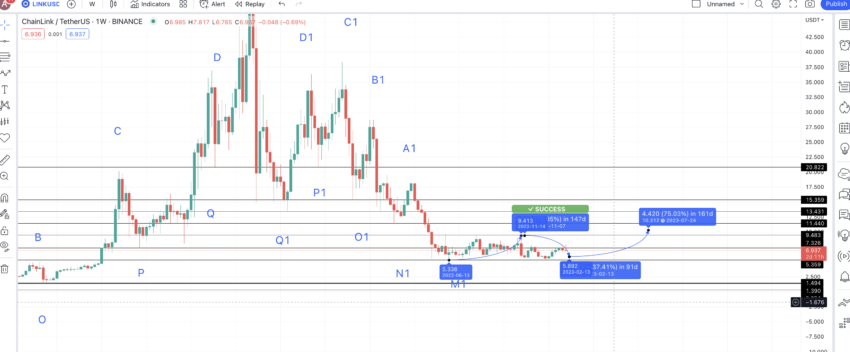
Therefore, with a drop of 37.48%, in 91 days (max timeframe from table 1), we can expect the LINK price prediction for 2023 to surface at $5.82. This hints at an imminent correction at the counter. However, it is important to note the timeframes might not be accurate, and the low might surface days or even months later.
The high, from LINK price prediction low of $5.82, can again increase by 74.55% (lowest percentage hike) in 161 days. This could send the price of LINK to $10.31 by July 2023. As mentioned, the timeline could get pushed back.
Chainlink (LINK) price prediction 2024
Outlook: Bullish
The next low, following LINK reaching $10.31, could find some strong support at $7.326 — considering its growing popularity. This level might show up by late 2023. The next high from this point could land the price of LINK at a high of 149.62% — the second lowest price hike — per table 2.
We expect a hike of close to 150% because, by 2024, the market might have become more resilient, with LINK being a beneficiary. Therefore, by April 2024, we can expect the price of LINK to reach $18.25.
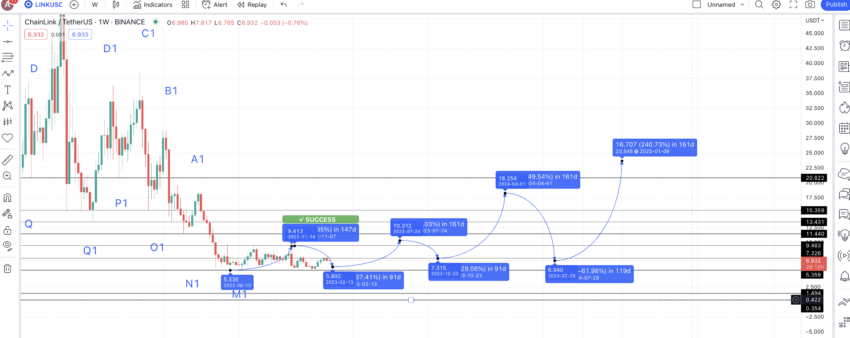
In 2024, the next low could finally follow the average drop of 62.31%. This is considering the significant sell-off that might happen at LINK’s counter once it crosses the $18 mark. That would place the LINK price prediction low for 2024 at $6.94.
Projected ROI from the current level: 22%
Chainlink (LINK) price prediction 2025
Outlook: Bullish
By mid-2024, we might see some strong bullish sentiments. Therefore, a hike of 240.23% (one of the growth percentage values from table 1) is not out of the question from the low of $6.94. This would push the average trading price of LINK in 2025 close to $23.648.
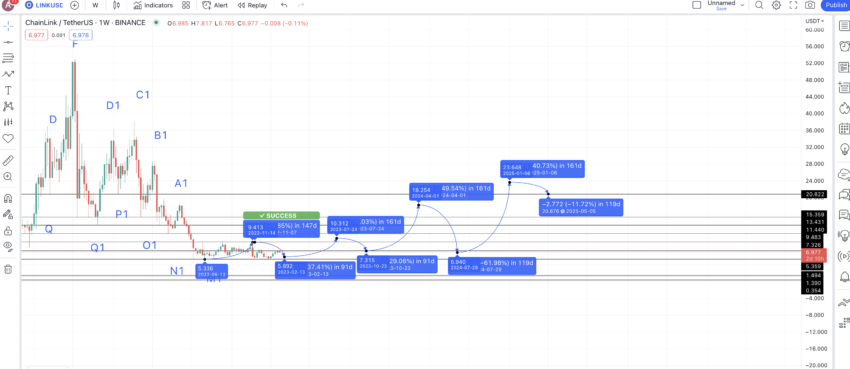
The low in 2025 could take support at $20.822 — a level that coincides with two lows from the previous pattern.
Projected ROI from the current level: 58%
Chainlink (LINK) price prediction 2030
Outlook: Very bullish
Now that we have 2025 high and 2024 low, we can connect the paths and extrapolate the same till 2030.

If we use Fib extension levels, the high in 2030 could surface at $217.07. This assumes that LINK follows the same growth path and sees increased adoption. And for the price of LINK to reach this high, it must cross above its previous all-time high price of $52.88 by 2028.
Projected ROI from the current level: 1356%
Chainlink (LINK’s) long-term price prediction until the year 2035
Outlook: Very bullish
If you plan on following the average trading price of LINK through 2035, here is a table with the minimum and maximum prices listed. This future price prediction table offers a balanced, long-term look at this decentralized Oracle network.
You can easily convert your LINK to USD here
| Year | | Maximum price of LINK | | Minimum price of LINK |
| 2023 | $16.92 | $5.13 |
| 2024 | $18.25 | $6.94 |
| 2025 | $23.648 | $20.822 |
| 2026 | $35.47 | $27.66 |
| 2027 | $44.34 | $34.58 |
| 2028 | $66.51 | $52.88 |
| 2029 | $109.74 | $85.59 |
| 2030 | $217.07 | $134.58 |
| 2031 | $325.60 | $201.87 |
| 2032 | $537.24 | $419.04 |
| 2033 | $644.70 | $502.86 |
| 2034 | $805.87 | $628.57 |
| 2035 | $1047.63 | $817.15 |
Is this LINK price prediction model accurate?
The decentralized oracle network chainlink is the go-to blockchain-specific solution connecting the real world to the digital ecosystem. And with more projects being built across blockchains, Chainlink is set to hold a significant role in making data available. This LINK price prediction model captures the future of Chainlink, offering realistic, careful, and attainable minimum and maximum prices for LINK tokens.
Frequently asked questions
Which is better, Polkadot or Chainlink?
Will Chainlink ever reach $100?
Is LINK a stablecoin?
Disclaimer
In line with the Trust Project guidelines, the educational content on this website is offered in good faith and for general information purposes only. BeInCrypto prioritizes providing high-quality information, taking the time to research and create informative content for readers. While partners may reward the company with commissions for placements in articles, these commissions do not influence the unbiased, honest, and helpful content creation process. Any action taken by the reader based on this information is strictly at their own risk. Please note that our Terms and Conditions, Privacy Policy, and Disclaimers have been updated.


