If you have a younger sibling, you will relate to Bitcoin Cash — a hard fork of Bitcoin surfacing in 2017. And while BTC continues to be the largest crypto of all time, BCH — the native coin of the Bitcoin Cash network — hasn’t enjoyed the same popularity. But what about the BCH price prediction levels for 2025 and beyond? Let’s take a look.
NOTE: This article contains out of date figures and information. It will be updated with fresh analysis for 2025 and beyond in the New Year. In the meantime, please see our Bitcoin Cash Price Prediction tool for the most recent, data-informed projections.
- Fundamental analysis of Bitcoin Cash network (BCH)
- BCH price prediction and tokenomics
- Key metrics and bitcoin cash price prediction
- Bitcoin cash price prediction and technical analysis
- Bitcoin cash (BCH) price prediction 2023
- Bitcoin cash (BCH) price prediction 2024
- Bitcoin cash (BCH) price prediction 2025
- Bitcoin cash (BCH) price prediction 2030
- Bitcoin cash (BCH) long-term price prediction until the year 2035
- Is the Bitcoin Cash price prediction model accurate?
- Frequently asked questions
Want to get BCH price prediction weekly? Join BeInCrypto Trading Community on Telegram: read BCH price prediction and technical analysis on the coin, ask and get answers to all your questions from PRO traders! Join now
Fundamental analysis of Bitcoin Cash network (BCH)
Bitcoin Cash began as a contentious arrangement to improve the scalability and speed issues lingering within the Bitcoin ecosystem. Here are some of the reasons why BCH quickly rose to fame and might still be relevant:
- The 32MB block size helps Bitcoin Cash handle more transactions. Plus, the transaction fees and speeds are also decent enough.
- It still managed to adhere to the P2P cash system as envisioned by Bitcoin’s founder Satoshi Nakamoto. However, with a lower hash rate, security and the extent of decentralization were always questionable.
- BCH, the native coin, is meant to work as a means of remittance, e-commerce settlement, store of value, and even micropayments.
- BCH is compatible with a wide range of wallets, including Ledger, Trezor, Exodus, and more.
- Bitcoin Cash uses the DAA or the Difficulty Adjustment Algorithm to solve for mining difficulty and fluctuations related to hash rate.

Regardless of the positives, Bitcoin Cash, courtesy of the same codebase, token economics model, and coin use case, might remain in the shadow of its older sibling.
Did you know? In recent years, BCH, due to its low transaction cost and faster transaction times, has gained precedence as a medium for daily transactions.
BCH price prediction and tokenomics
As mentioned earlier, BCH has a similar token economics model to BTC. The total supply is capped at 21 million. As such, the supply will eventually run out, making BCH scarce over time. Plus, the halving events also follow a timeline similar to BTC — one in nearly four years.
While the first halving, post the genesis block in 2017, happened in 2020, we expect another halving event at BCH’s counter by 2024. That could be when the Bitcoin Cash price forecast might look more aggressive than usual.
9 provinces in Canada have decided to put a limit on how much you can invest in crypto on annual basis. No limit on Bitcoin, Litecoin, Bitcoin Cash, Ethereum.
Kashif Raza, Founder of Bitinning: X
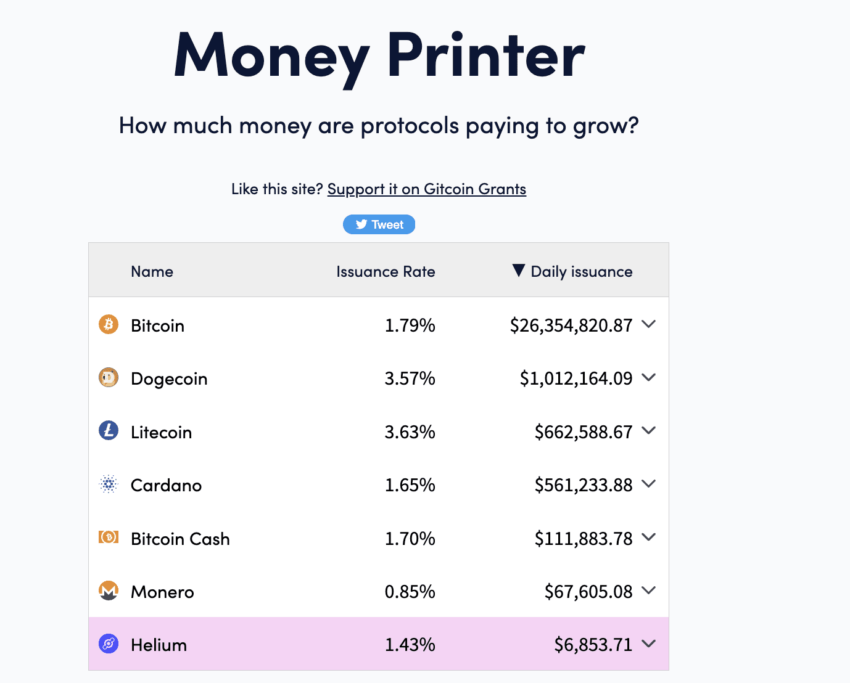
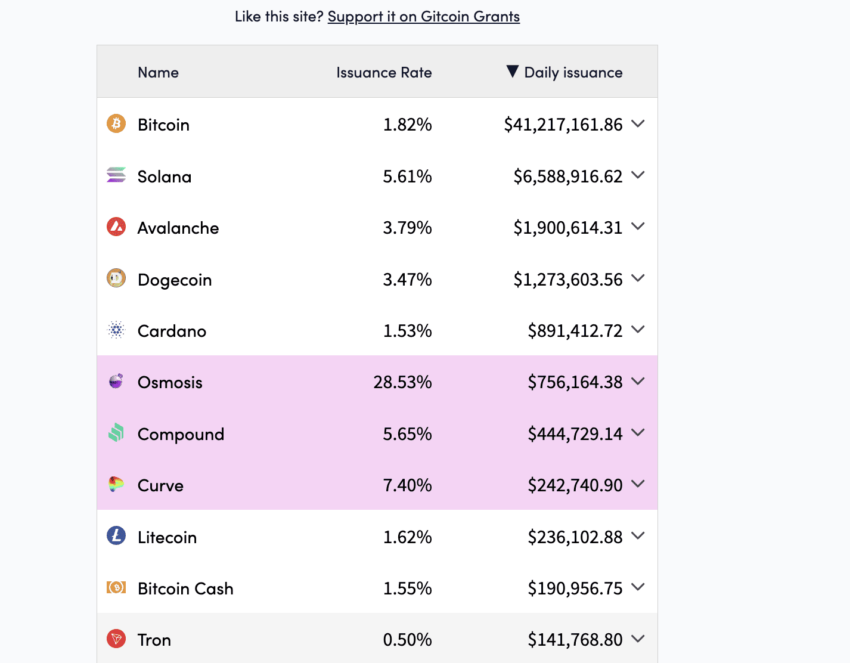
Also, BCH’s current inflation or issuance rate is set at 1.70%, similar to the 1.79% of BTC for April 2023. Over time, as of December 2023, the same has dropped to 1.55% — a pro-price development that hints at increasing demand and lowering supply.
However, one good thing about the token spread is that the top 100 BCH holders only handle 30.89% of the total supply. This holding statistic keeps market-wide and sharp sell-offs at bay.

Plus, another convincing development has to be the whale holdings, at press time. Currently, only 12.15% of Whales control the total supply, which stands at over 93% at the moment.
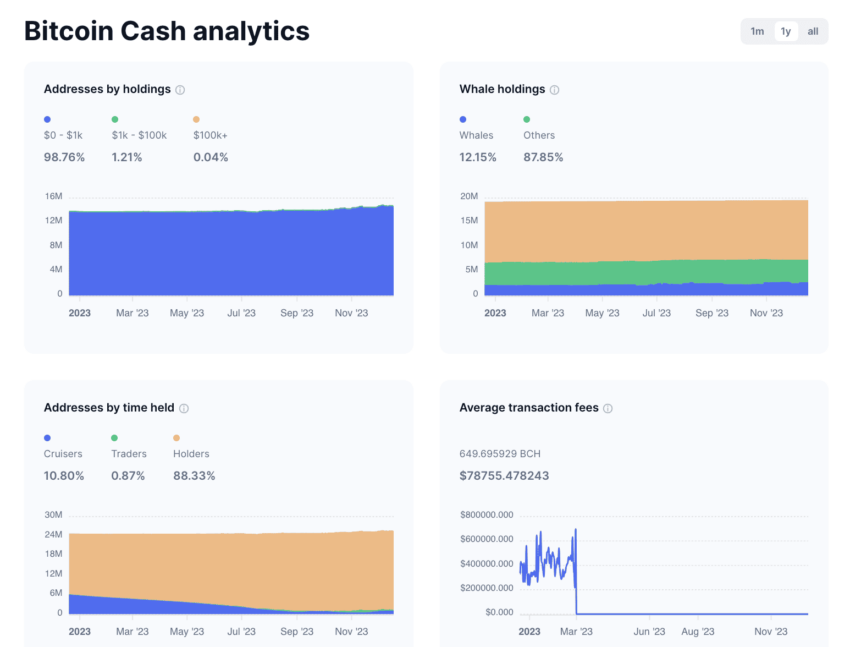
However, on the flip side, the transaction fee metric stands flat, which might not be a great adoption indicator.
Key metrics and bitcoin cash price prediction
If you want to get a lead on the Bitcoin Cash price prediction, take a closer look at the 1-month market cap flow. Notice how the market cap dropped to $2.06 billion by March 10, 2023, but held steady at $2.42 billion, in April.
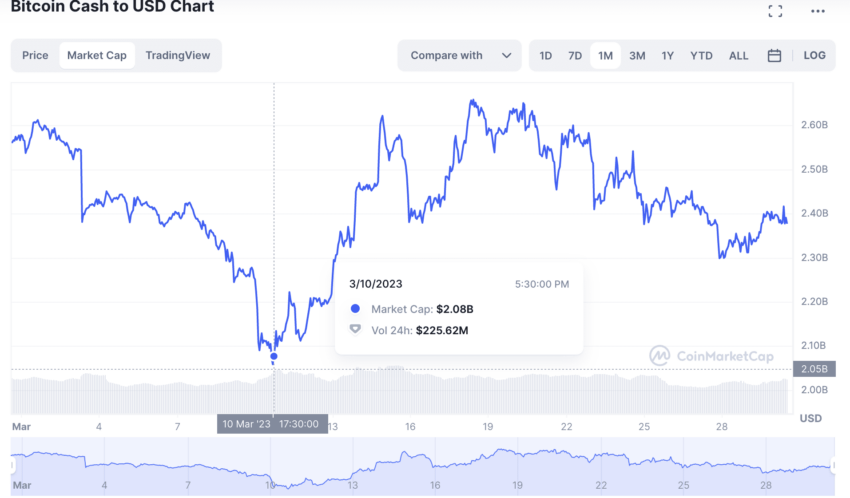
It’s December 2023 and the market cap has surged to over $4.5 billion, which is a testament to the growing popularity and price levels associated with BCH.

While an improving market cap is a clear sign that the prices are rising as opposed to the token issuance, the trading volume hasn’t peaked. This might hint that the price of BCH might continue moving in a range for a while till the trading volume picks up.

Coming to the price volatility, the orange (volatility) line seems to have flatlined. The chart points from earlier show that every bottom eventually led to a price rally of sorts. Therefore, we might see BCH’s price rise in the short term. We shall look at the expected levels in our technical analysis.

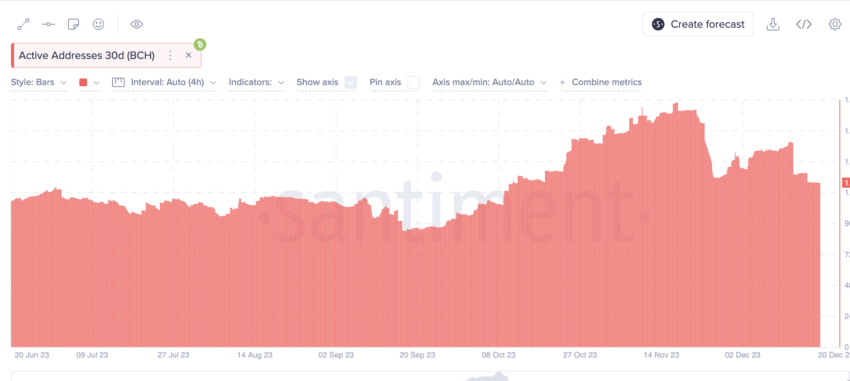
Active address count would be another reliable on-chain metric to work with. Notice how the addresses peaked in November 2022, only to drop to the lowest half-yearly value around March 14, 2023. Again, there is a visible active address peak in December 2023, hinting at increased adoption and making us even more optimistic about the short-term price of BCH.
Bitcoin cash price prediction and technical analysis
Our April 2023 analysis
We successfully predicted the possible breakout at $153.80 in our April analysis. Read on to know the approach we took:
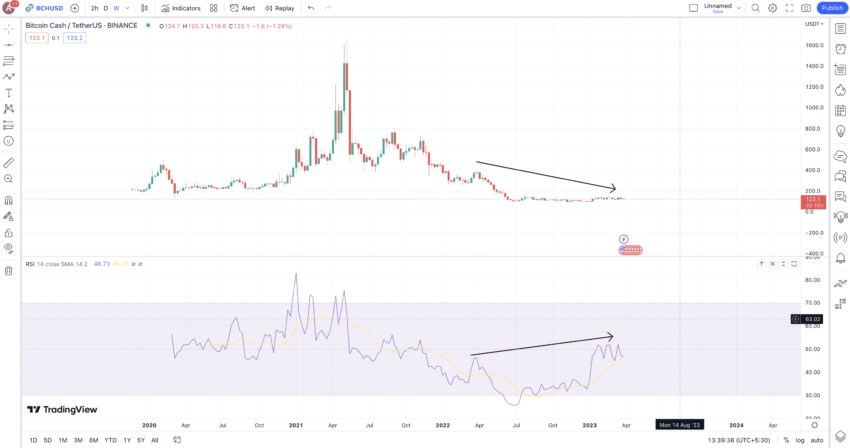
We can start by looking at the BCH coin price action using the daily chart. Notice how BCH is moving inside the falling channel pattern. Even though the falling channel feels bullish, with the price of BCH sitting close to the upper trendline, the bearish RSI divergence might lead to a more rangebound movement for now.

With the price-making higher lows and the RSI-making lower lows, there may be more consolidation for BCH before the price forecast turns a new leaf. If we draw the crucial resistance levels, do notice that BCH tried breaking out of the important $153.80 level. For now, the next hurdle is at $138.20, after which there might be another attempt at $153.80.

A drop under $115 might invalidate the trend and bring the bearish RSI divergence to the fore.
Our December 2023 analysis
The BCH/BTC daily chart shows that the price is trading inside a descending channel. Plus, the RSI is making higher highs, hinting at a bullish divergence. At this point, it isn’t impractical to expect a price surge at BCH’s counter.

BCH/USD daily chart is hinting at a pennant pattern with a breakout possible in any possible direction. However, the most important resistance is at $237.29, which we can expect BCH to gain some additional bullish intensity.

Now that we have explained the tepid short-term outlook let us shift focus to the broader crypto market and the weekly chart of BCH to locate any patterns.
Pattern identification
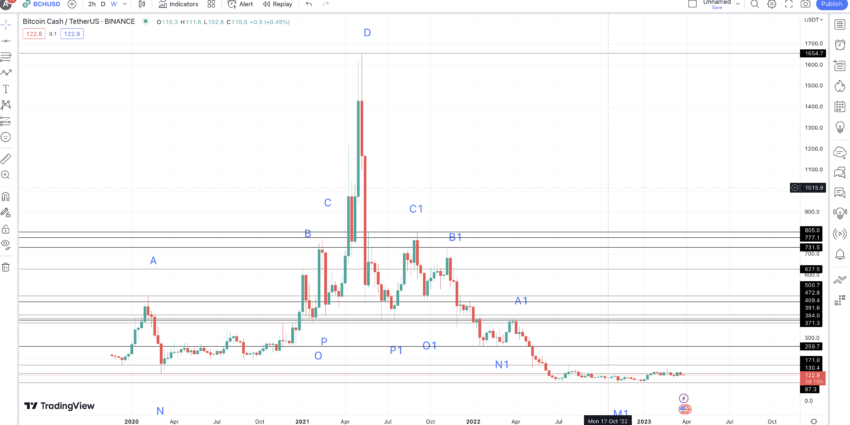
The raw weekly chart shows a clear pattern — higher highs to the peak followed by a series of lower highs. The left and right sides of the chart look more like foldback or mirrored patterns. Also, the bullish weekly RSI divergence shows that a new high might be on the cards, starting a new pattern of sorts.
Let us now mark all the relevant highs and lows to find the average price percentage ranges and expectations for all the subsequent low-to-high and high-to-low moves.
Price changes
Our next task is to locate the price percentage changes and distance between every point corresponding to two paths: M to D and M1 to D. Let us get going:
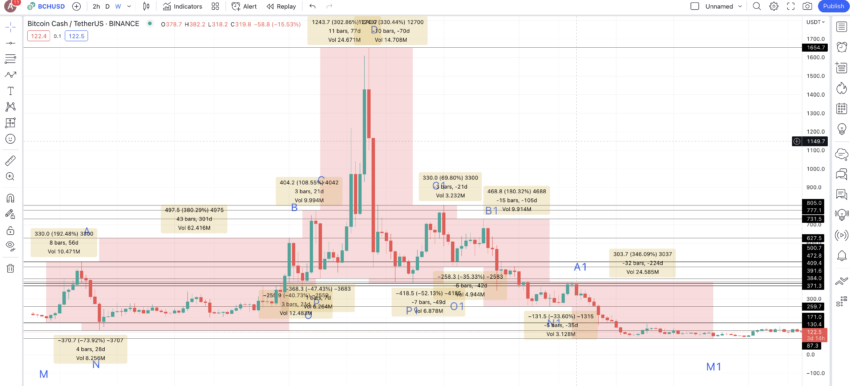
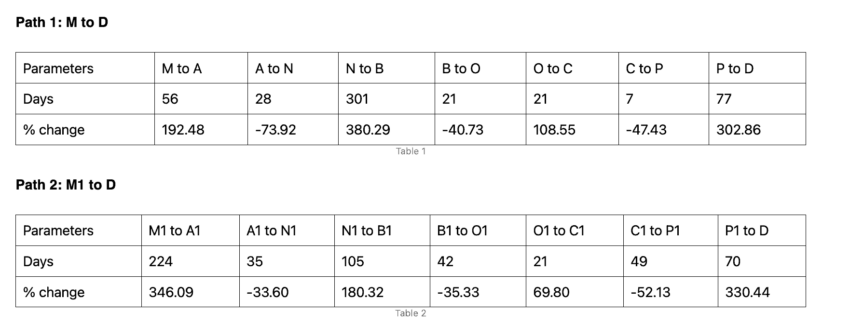
Utilizing the previously discussed data, we will now determine the average price percentage for each low-to-high and high-to-low movement, corresponding to an emerging pattern. Firstly, for low-to-high activities, the average, calculated using non-negative column values, is 238.85%.
This movement typically takes a duration ranging from 21 to 301 days. Conversely, in the case of high-to-low movements, the average is found to be 47.19%, derived using negative column values. The time frame for these movements varies, potentially spanning from 7 to 49 days.
Bitcoin cash (BCH) price prediction 2023
We successfully predicted the high for BCH in 2023. In fact, BCH exceeded expectations and gained $16 odd dollars above our expected price. Read along to understand our Bitcoin Cash price prediction for 2023.
The last pattern revealed to us is M1, the last distinguishable low. We can use the low-to-high average of 238.85% from this level to plot the next high — A2. However, keeping the tepid short-term expectation around the price of BCH coin, we can expect this level of growth to surface in 301 days ( from the tables above).
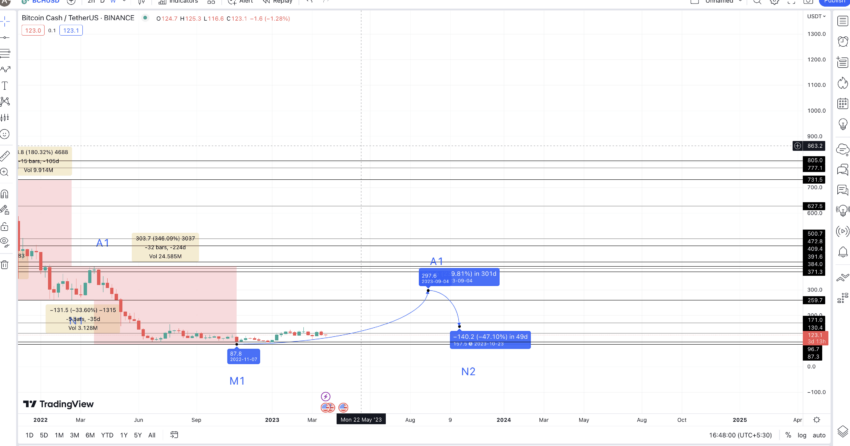
This assumption puts the A2 or the BCH price prediction high for 2023 at $298.20. Do note that this is the best-case scenario for BCH in 2023, and the average price might not go this high. The low, from the A2, can form at a dip of 47.19% — in, say, 49 days (from the tables above).
Hence, the Bitcoin Cash price prediction low for 2023 could be $157.50. But then, the price of BCH dropped under $100 in early 2023, which makes the lowest price in 2023 to be at $96.70 — a level that BCH has already touched.
The $157.50 could be the second important low for BCH in 2023. It can even act as the base for the Bitcoin Cash price forecast for 2024 and 2025.
Bitcoin cash (BCH) price prediction 2024
Outlook: Moderately bullish
With N2 in sight, we can again expect BCH to move toward its 2024 high. However, the average growth rate of 238.85% might still make sense as 2024 could be the year of halving for Bitcoin Cash. Therefore, in 301 days (maximum timeframe), we can expect BCH to reach $534.20. This could again be the best-case scenario for the price of BCH in 2024.
The drop from here could be as deep as $282.20 by late 2024, keeping the average price drop percentage of 47.19% in mind. We can mark this level O2.
Projected ROI from the current level: 133%
Bitcoin cash (BCH) price prediction 2025
Outlook: Moderately bullish
From O2, post the BCH halving, the growth in 2025 might slow down a little, considering the price action history.
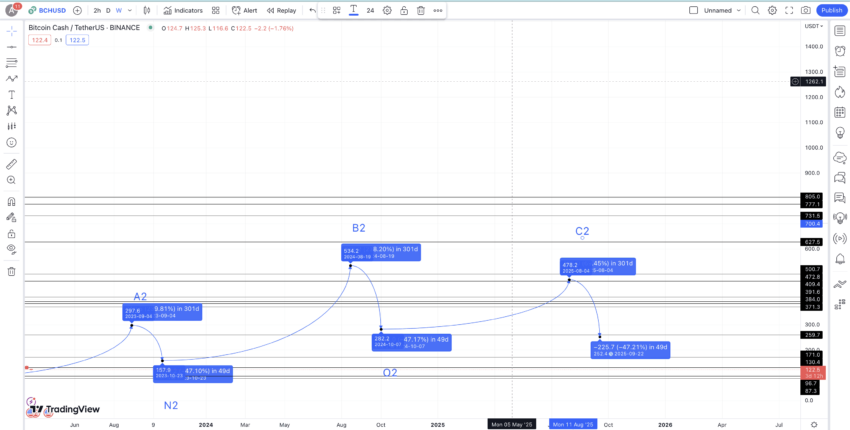
Revisiting the tables from earlier, we can expect a growth percentage of 69.8% (the lowest growth percentage from the tables above). We have considered minimal growth as there are chances that BCH might experience some market-wide selling post the halving event.
Considering the assumption, the BCH price prediction for 2025 could surface at $478.20. The next low could again follow the average price drop percentage of 47.19%, only to surface at $252.40.
Projected ROI from the current level: 88%
Bitcoin cash (BCH) price prediction 2030
Outlook: Bullish
By now, we have 2025 high and 2025 low points with us. From here, we can try and plot the next high or D2 by taking a growth percentage of 108.55% — the second lowest growth percentage from the table above.
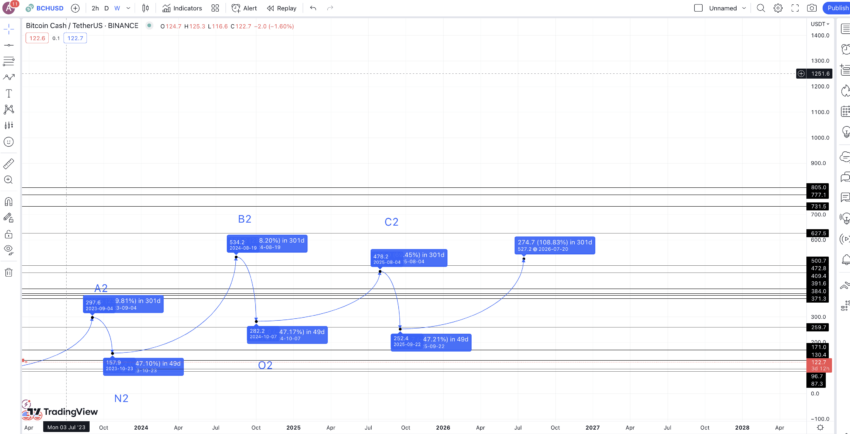
This puts the bitcoin cash price prediction high for 2026 at $527.20. Notice that despite an expected drop in highs with C2, we expect BCH to be back on its feet by D2 or in 2026, assuming some buying begins in anticipation of the 2028 halving cycle.
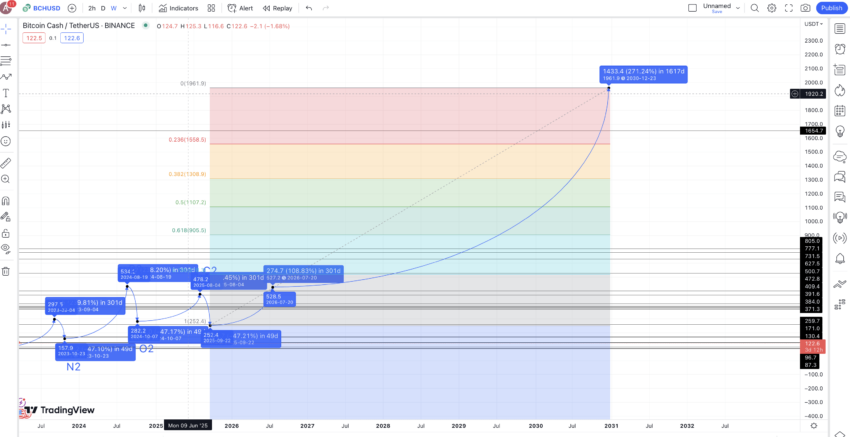
Now with the 2026 high and 2025 low in sight, we can extrapolate the same to plot the price of BCH through 2030. Following the same growth trajectory puts 2030 high at $1961.90 by the end of 2030.
Projected ROI from the current level:756%
Bitcoin cash (BCH) long-term price prediction until the year 2035
Outlook: Bullish
You can easily convert your BCH to USD here
Now that we have the maximum and minimum price levels associated with BCH, projected till 2030, we can extrapolate some data to get a view up to 2035. Here is a table that might help:
| Year | Maximum price of BCH | The minimum price of BCH |
| 2023 | $298.20 | $96.70 |
| 2024 | $534.20 | $282.20 |
| 2025 | $478.20 | $252.40 |
| 2026 | $527.20 | $326.86 |
| 2027 | $632.64 | $493.46 |
| 2028 | $1043.85 | $647.187 |
| 2029 | $1252.62 | $776.62 |
| 2030 | $1961.90 | $1530.28 |
| 2031 | $2158.09 | $1683.24 |
| 2032 | $2805.51 | $2188.29 |
| 2033 | $3366.62 | $2625.96 |
| 2034 | $3871.61 | $3019.85 |
| 2035 | $4258.77 | $3321.84 |
Is the Bitcoin Cash price prediction model accurate?
The Bitcoin Cash network is also a brainchild of Satoshi Nakamoto, as it originated from the OG Bitcoin. Yet, despite the bigger block size and additional focus on scalability, it hasn’t taken off in a way comparable to BTC. This Bitcoin Cash price prediction captures that essence while adding short-term and long-term technical analysis to build a holistic forecast. While we have captured the best-case scenario for every year till 2035, the prediction remains as accurate and reliable as possible in a dynamic and volatile crypto market.
Frequently asked questions
Does bitcoin cash have a future?
How high could bitcoin cash go?
Is bitcoin cash a good investment?
Who owns bitcoin cash?
Disclaimer
In line with the Trust Project guidelines, the educational content on this website is offered in good faith and for general information purposes only. BeInCrypto prioritizes providing high-quality information, taking the time to research and create informative content for readers. While partners may reward the company with commissions for placements in articles, these commissions do not influence the unbiased, honest, and helpful content creation process. Any action taken by the reader based on this information is strictly at their own risk. Please note that our Terms and Conditions, Privacy Policy, and Disclaimers have been updated.


