

Aptos makes a compelling case for those interested in proof-of-stake (PoS) blockchain projects with novel elements. This web3 facilitator isn’t just unique but also incredibly fast, theoretically capable of hitting 150,000 tps. But is the innovation and ingenuity enough to push the price of APT, the native coin, to greater heights? We explore every possibility in this comprehensive Aptos price prediction.
KEY TAKEAWAYS
➤ The future of the Aptos ecosystem will hinge on how effectively it implements privacy features through the Move programming language and the variety of (DApps) it supports.
➤ Taking this into account, this technical and fundamental analysis-backed price prediction puts the maximum price of APT in 2025 at $40.43, and the minimum price at $12.27.
➤ Anyone considering investing in any crypto asset should always form a comprehensive DYOR plan. Never rely on one prediction for sole guidance or invest more than you can afford to lose.
- Aptos (APT) price prediction until the year 2035
- Aptos technical analysis
- Aptos (APT) price prediction 2024 (concluded)
- Aptos (APT) price prediction 2025
- Aptos (APT) price prediction 2026
- Aptos (APT) price prediction 2027
- Aptos (APT) price prediction 2028
- Aptos (APT) price prediction 2029
- Aptos (APT) price prediction 2030
- Aptos fundamentals
- Does APT have a future?
- Frequently asked questions
Aptos (APT) price prediction until the year 2035
If you want to analyze the future price of the Aptos token until the year 2035, we recommend taking a closer look at this table.
| Year | Maximum price of APT | Minimum price of APT |
| 2025 | $40.43 | $12.27 |
| 2026 | $27.23 | $17.78 |
| 2027 | $53.69 | $22.42 |
| 2028 | $80.14 | $27.06 |
| 2029 | $106.60 | $31.70 |
| 2030 | $133.05 | $36.34 |
| 2031 | $146.28 | $40.98 |
| 2032 | $159.51 | $45.62 |
| 2033 | $172.73 | $50.26 |
| 2034 | $185.96 | $88.32 |
| 2035 | $212.41 | $94.50 |
However, for the price of APT to reach the projected levels, the market cap of the Aptos crypto should keep increasing along with the use cases of the Aptos network.
Aptos technical analysis
Long-term APT price forecast: Calculations included
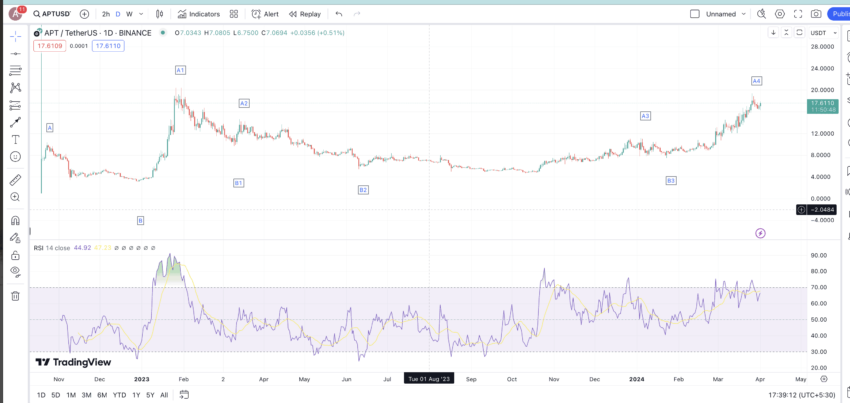
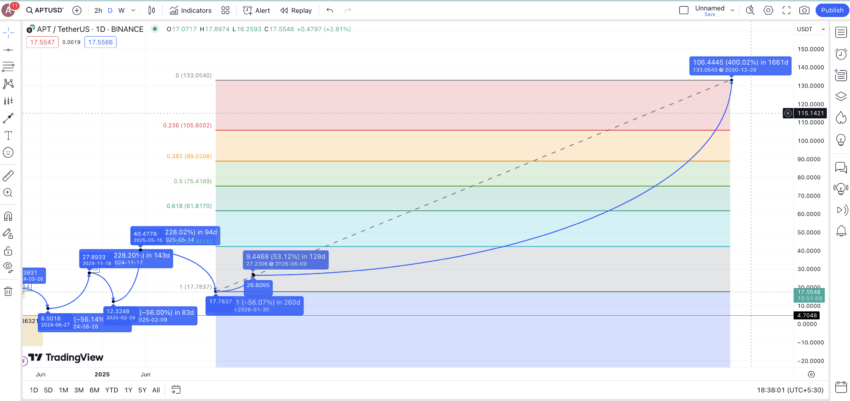
To focus of the long-term analysis of APT tokens, we shall consider the daily chart while looking for the broader patterns. Keep the broader aspects in mind, we have zeroed in on four patterns for APT — A-B-A1, A1-B1-A2, A2-B2-A3, and A3-B3-A4. The date and price percentage ranges between every two points of these patterns can help locate the average price hike and average price dip for APT.
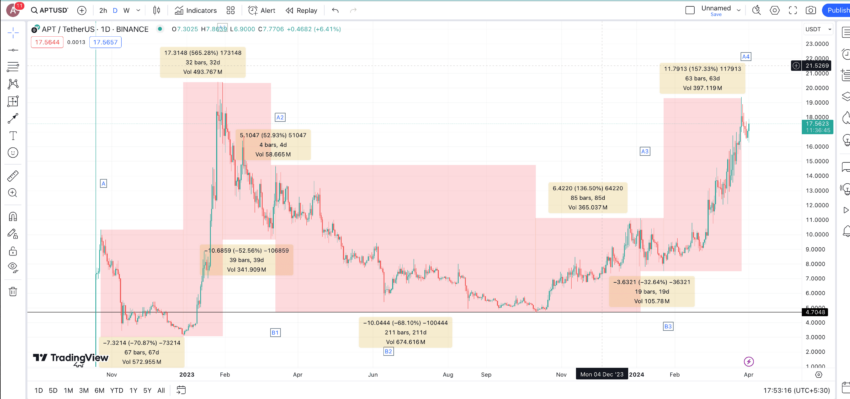
Let us take a look at the table with all the key values:
| A to B | -70.87% in 67 days |
| B to A1 | 565.28% in 32 days |
| A1 to B1 | -52.56% in 39 days |
| B1 to A2 | 52.93% in 4 days |
| A2 to B2 | -68.10% in 211 days |
| B2 to A3 | 136.50% in 85 day |
| A3 to B3 | -32.64% in 19 days |
| B3 to A4 | 157.33% in 63 days |
We shall now use all the data points from Table 1 to locate the average price hike and average price drop percentages for APT.
Average price hike: 228.01% in 46 days, approximately
Average price drop: -56.04% in 84 days, approximately
We shall now use these pointers to chart the APT price forecast for 2024, 2025, and beyond.
Aptos (APT) price prediction 2024 (concluded)
We had the discernable high — A4 — which we used to locate the average price dip of 56.04%. This was meant to locate the possible low APT can chart in 2024. This was expected to surface at $8.50.
We marked this point as B4. Despite the charted dip, we did not expect the price of APT to drop as low, considering the bullish crypto market. But it is always good to be safe and keep a more practical view of things in a market this volatile.
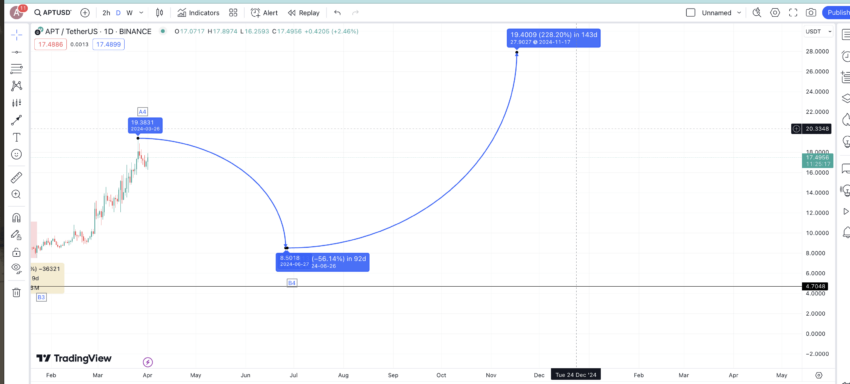
Based on the possible low for 2024, we expected the next high of the 2024 APT price forecast to surface around the $27.90 mark per the calculated average price hike percentage.
Aptos (APT) price prediction 2025
Outlook: Bullish
Keeping the average price drop percentage of 56.04 in mind, the next low, or rather 2025, low for APT could surface at $12.27. The next high, provided the Aptos project team keeps adding to the innovations and the fundamental elements, could go as high as $40.4272.
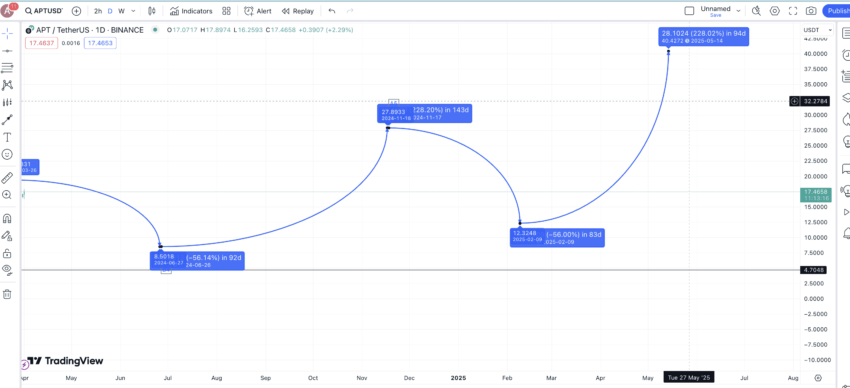
Do note that the timeframe might vary from the average levels, but the price projections remain valid regardless.
Projected ROI from the current level: 375%
Aptos (APT) price prediction 2026
Outlook: Bullish
In 2026, we anticipate the price of Aptos to exhibit volatility with a positive outlook. Based on historical data, the expected minimum price is around $17.78, reflecting a potential drop of 34.72% from the previous year’s high of $27.23.
On the upside, the maximum price is projected to reach $27.23. This gives an average expected price of approximately $22.51 for the year. The projected ROI from the current price level of $8.51 would be around 164%, indicating a strong potential for growth.
Projected ROI from the current level: 220%
Aptos (APT) price prediction 2027
Outlook: Bullish
The bullish trend is expected to continue into 2027. The minimum price is projected to be around $22.42, which would be a 26.56% increase from the previous year’s average price of $17.78.
The maximum price could reach $53.69, signifying a substantial rise. This results in an average price estimate of $38.06 for the year. The projected ROI from the current level is approximately 347%, showcasing significant potential for investors.
Projected ROI from the current level: 531%
Aptos (APT) price prediction 2028
Outlook: Bullish
The year 2028 is expected to maintain the bullish momentum. The minimum price is anticipated to be $27.06, showing a 20.71% increase from the previous year’s low of $22.42.
The maximum price could reach $80.14, reflecting strong growth prospects. The average price for 2028 is expected to be around $53.60. With these projections, the ROI from the current price of $8.51 is estimated to be about 530%, indicating a promising investment opportunity.
Projected ROI from the current level: 842%
Aptos (APT) price prediction 2029
Outlook: Bullish
For 2029, the forecast remains positive, with expectations of continued growth. The minimum price is projected to be $31.70, marking a 17.19% increase from the previous year’s low of $27.06.
The maximum price could rise to $106.60, showing potential upside. The average price for the year is estimated to surface at $69.15. This implies a projected ROI of around 712% from the current price level, further highlighting Aptos as a strong contender in the cryptocurrency market.
Projected ROI from the current level: 1154%
Aptos (APT) price prediction 2030
Outlook: Bullish
We can now extrapolate the above findings to find the key levels up to 2030. This puts the 2030 high for the price of APT at $133.05.
Projected ROI from the current level: 1465%
Aptos fundamentals
Aptos network is a proof-of-stake (PoS) layer-1 chain with several key fundamental elements adding to its credibility. For starters, it takes the concept of blockchain scalability to a whole new level, all thanks to the novel consensus mechanisms focused on accommodating high-volume transactions.
“Aptos is setting new benchmarks in blockchain performance, achieving 30,000 peak transactions per second and processing over 2 billion transactions in a single day. This milestone demonstrates Aptos’s capability to handle high throughput and scalability demands effectively.”
Dr. Alexander Spiegelman, Aptos Labs researcher: Aptos Forum
Powering Aptos is Move, a new kind of programming language that focuses on efficiency and security. With new standards of data management and asset representation, Move cuts out the likelihood of vulnerabilities and bugs, adding to its unique fundamental presence. Another blockchain, Sui, uses Move as its go-to programming language.
A quick Aptos explainer:
Before any confusion emerges, we are not considering PoS as a novel consensus mechanism. Instead, Aptos employs the BFT or the Byzantine Fault Tolerance PoS consensus mechanism for high transaction throughput, where transactions are handled sequentially. This way, the privacy-focused blockchain brings in better scalability.
For more details regarding insights into the Aptos network, Aptos roadmap, and even the Aptos project team, check out our detailed Aptos guide.
Did you know? The Move programming language was initially developed as part of the Diem project, envisioned by Facebook in 2019. The project aimed to introduce a blockchain-specific payment system.
Besides the mentioned fundamental elements, Aptos also throws in the concept of proof-of-participation (PoP) in an implementational way. Based on the amount of native APT coins held, users can participate as validators or even earn staking rewards.
“TVL’s aptos has increased by 84% to reach 500 million, indicating that there is still ample room for development in the Aptos ecosystem.”
Someone Degen, crypto researcher: X
Other on-chain and relevant metrics that you might consider exploring:
Does APT have a future?
Our Aptos price prediction model substantiates people’s belief in this layer-1 blockchain network. However, the future of this ecosystem will depend on its implementation of the privacy features via the Move programming language and the type of decentralized applications (DApps) it hosts. As a development-focused network, we believe the network and ecosystem activities will define the path for Aptos going forward.
Disclaimer: This analysis covers Aptos (APT) and its market potential. Cryptocurrency investments, including APT, involve significant risks and market volatility. Ensure you conduct thorough research (DYOR) and seek financial advice before investing.
Frequently asked questions
What will the price of Aptos be in 2040?
Is Aptos better than Ethereum?
What problem does Aptos solve?
How do ecosystem partnerships impact the price of Aptos (APT)?
What technological advancements contribute to the growth potential of Aptos (APT)?
Disclaimer
In line with the Trust Project guidelines, the educational content on this website is offered in good faith and for general information purposes only. BeInCrypto prioritizes providing high-quality information, taking the time to research and create informative content for readers. While partners may reward the company with commissions for placements in articles, these commissions do not influence the unbiased, honest, and helpful content creation process. Any action taken by the reader based on this information is strictly at their own risk. Please note that our Terms and Conditions, Privacy Policy, and Disclaimers have been updated.


