
Ankr started as a cloud computing decentralized platform before moving into plug-and-play blockchain development and node infrastructure services. This ANKR price prediction piece will help you make sense of the growth potential of Ankr Network and its native crypto, ANKR, going into 2025 and beyond.
- Ankr Network and the associated fundamentals
- Predicting ANKR’s future price: Exploring its tokenomics
- ANKR price prediction and key metrics
- ANKR price prediction and technical analysis
- Ankr Network (ANKR) price prediction 2023
- Ankr Network (ANKR) price prediction 2024
- Ankr Network (ANKR) price prediction 2025
- Ankr Network (ANKR) price prediction 2030
- Ankr Network (ANKR’s) long-term price prediction until the year 2035
- Is the ANKR price prediction model accurate enough?
- Frequently asked questions
Ankr Network and the associated fundamentals
Before we delve into the nitty-gritty of the Ankr Network and ANKR price prediction levels, we need to understand what it actually does. Simply put, Ankr Network is an IaaS (Infrastructure-as-a-Service) platform that allows network participants to run plug-and-play blockchains or nodes. With Ethereum moving to PoS territory and ANKR previously supporting node hosting relevant to the Ethereum blockchain, ANKR has evolved into a liquid staking platform.
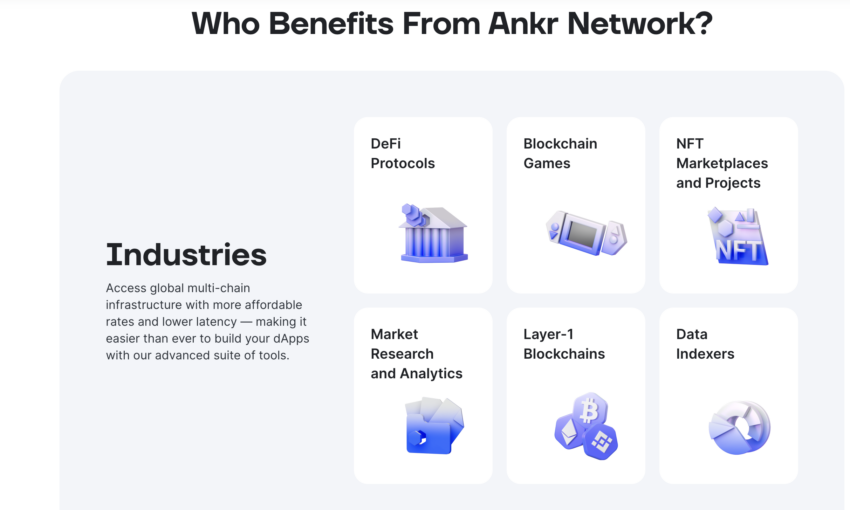
The platform now allows users to stake ETH for node validation without having to lock assets indefinitely. Hence, ANKR’s presence as a DeFi platform is also substantiated.
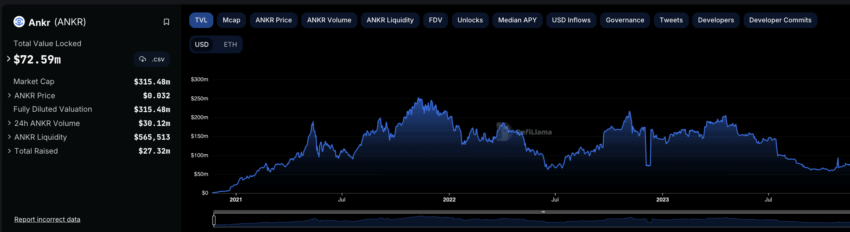
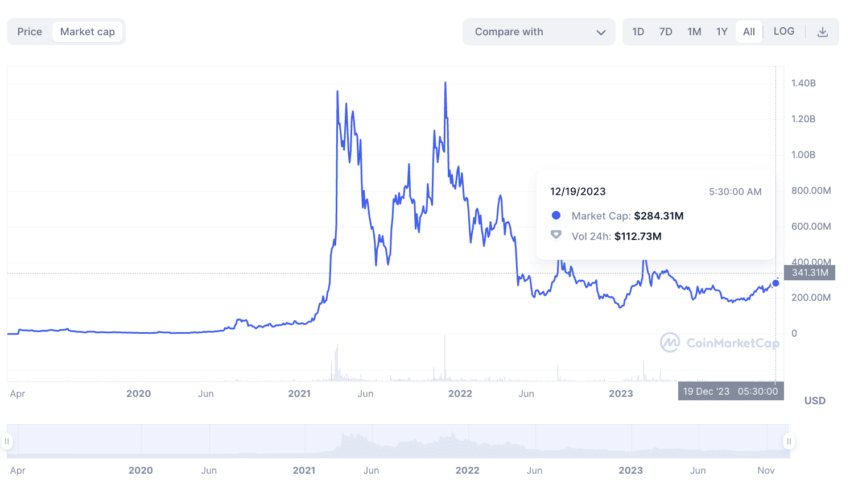
The protocol is currently ranked 148th in the DeFi TVL space as of December 2023, with a locked value of $70+ million. ANKR has its presence across seven chains — Ethereum, BSC, Avalanche, Polkadot, and more.
Liquid staking is growing as a DeFi use case after Ethereum’s Shanghai upgrade. And protocols and projects like Ankr Network, Lido Finance, and Rocket Pool are expected to benefit. This makes us optimistic about the ANKR price prediction levels, both short-term and long-term.
However, that’s not the only reason the market watches ANKR closely. Microsoft’s expected partnership with the Ankr Network and Tencent Cloud reaching out to Ankr for web infrastructure have both been recent sentimental drivers.
Did you know? Ankr Network is a potent player within the web3 ecosystem, with the platform continually expanding the collection of its developer tools.
Overall, it’s “make hay while the sun shines” for ANKR’s price action. But then, the native token ANKR has been relatively subdued over the past few months.
Predicting ANKR’s future price: Exploring its tokenomics
The Ankr network has a fixed supply of 10 billion tokens. The supply comes with no inflation and is strictly capped. At present, all of those ANKR tokens are in circulation, making the supply highly liquid. The Ankr Network even burned close to 2% of the same to introduce a positive demand-supply slope.
As for liquid staking, once you stake ETH, you get the equivalent ankrETH (a receipt like stETH) credited to your Ankr account. And as with any liquid staking protocol, you can use those ankrETH tokens to earn additional passive income as staking rewards.
Also, ANKR tokens have a presence across Ethereum and Binance, which makes them ERC-20, BEP-2, and BEP-20 compatible. Plus, Ankr Network’s interoperability extends to the Polygon, Fantom, and Avalanche blockchains.

However, the only thing that could be cause for concern is the token-holding statistic. Per CoinMarketCap’s data, as of February 2023, the top 100 ANKR token holders were in control of 89.27% of the supply. This holding pattern can become tricky if holders feel like selling once the price is in their vicinity. As of December 2023, the ANKR Whales control almost 64.5% of the total supply.
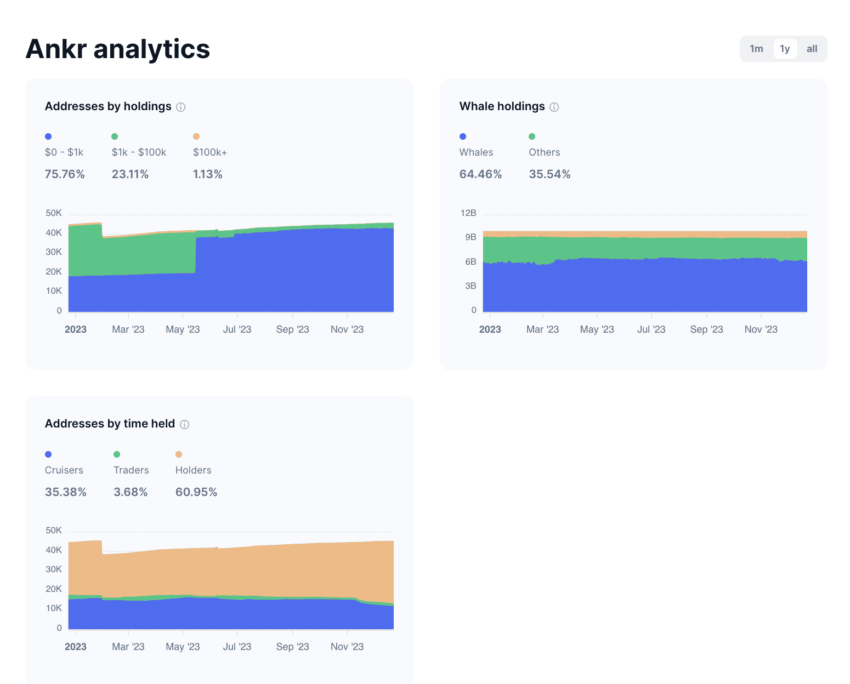
However, one concern is that over 75% of the ANKR-loaded addresses have anywhere between 0 and $1k worth of holdings.
“They say 95% of businesses don’t survive the first year and 99.5% don’t survive the fifth year. @ankr is officially entering its sixth year, having been through 3 bullbear cycles, and looking more robust and resilient than ever.”
Chandler Song, Co-Founder of ANKR Network: X
ANKR price prediction and key metrics
BIC metrics
Let’s start with our in-house representation of Ankr Network’s price action, market cap, and trading volume — represented month-on-month, as captured in early 2023.
While the price surge is always a bonus for ANKR holders, the rise in the market cap and, most importantly, trading volume is also clear.
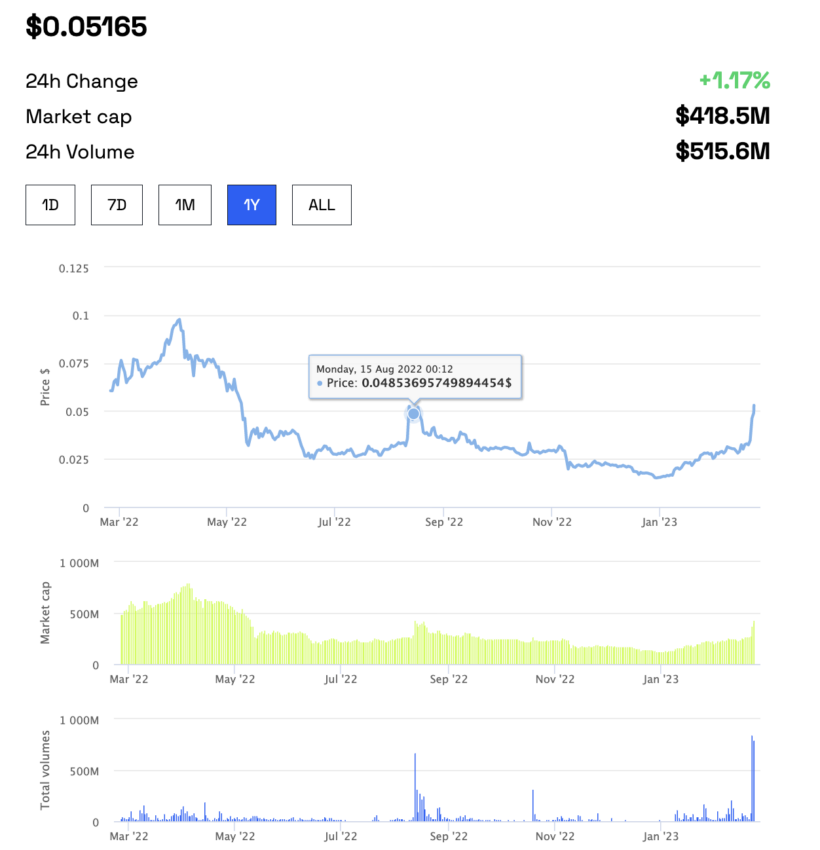
ANKR price prediction and yearly insights: BeInCrypto
Things get interesting if we look at the yearly charts. While the price is still attempting to break above the August 2022 highs, the current trading volume is slowly trying to get back on its feet. While this sounds optimistic regarding the increasing liquidity and attention that ANKR receives, a drop in trading action has been known to push prices down.
Hence, staying safe and making decisions after extensive research and with a proper plan is advisable.
On-chain and price-specific metrics
It goes without saying that active address growth can push the price of ANKR tokens higher like they would for any other crypto. The chart below illustrates active address growth, with the peak surfacing in February 2023.
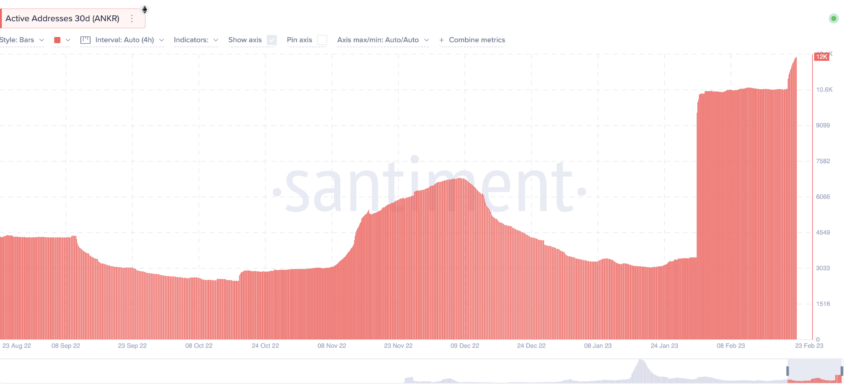
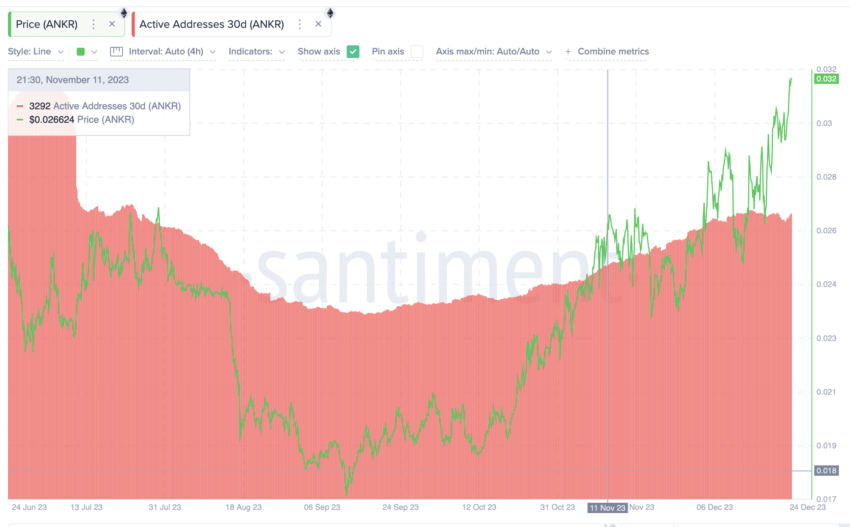
If we track the active address metric as of December 2023, an interesting trend appears. Despite the drop in active addresses mid-year, we can see the values picking up towards the end of 2023. This shows that ANKR prices might pick up pace in 2024.
If you look at the volatility-price chart of ANKR, another interesting trend surfaces. Notice that there might be a volatility peak in the formation.
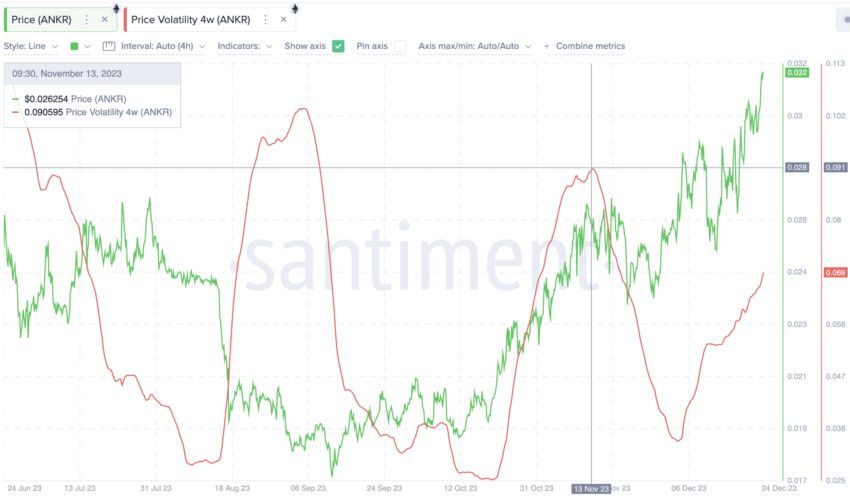
As per the historical analysis of the chart, if the peak is lower than that formed on November 13, 2023, the price of ANKR could continue to rise. However, some consolidation might be on the cards if a higher high is formed.
ANKR price prediction and technical analysis
Our early 2023 analysis
Remember how we identified $0.058 as the crucial resistance level, which, sadly, ANKR couldn’t go past?
Here is more about our earlier analysis. Moving to the daily chart of ANKR, another interesting trend surfaces. Notice that ANKR recently broke out of the descending trendline. While the formation looks more like a bearish descending triangle pattern, post a downtrend, this pattern can also indicate a reversal of sorts for ANKR.
Connecting the FIB levels gives us a near-term max target of $0.10, which might be the case if the price of ANKR can breach the immediate resistance of $0.058. Do note that $0.058 serves as a very strong resistance level, and a breach must be accompanied by high trading volume(s).
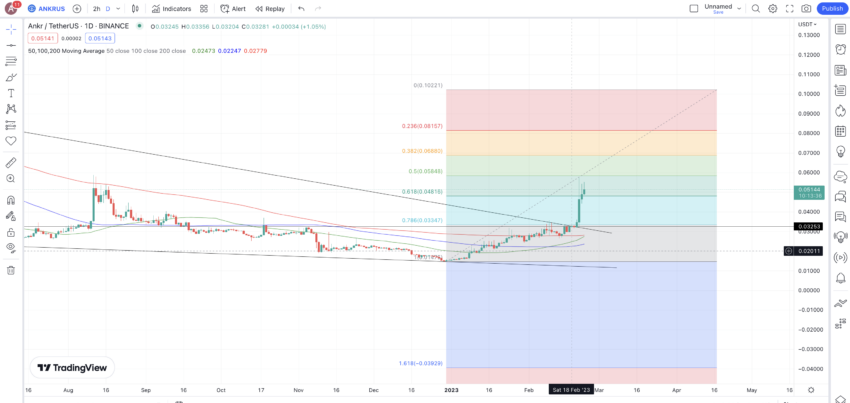
If you go by the moving averages, the green line (50-day moving average) is on the verge of crossing over the red line (200-day moving average). If this “golden crossover” succeeds in forming, we can see the price go up from the current levels.
And while the price action looks strong for now, a move lower than $0.032 might invalidate the bullish formations. Update: ANKR is currently moving towards our skeptical zone of $0.32, and it would be interesting to see how the same pans out in December.
Our December 2023 analysis
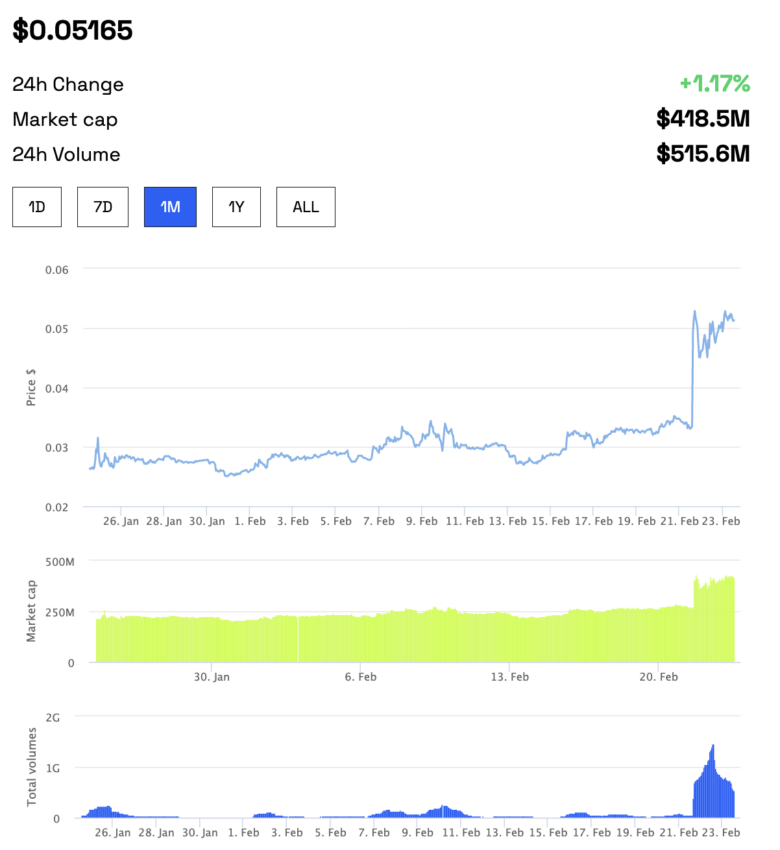
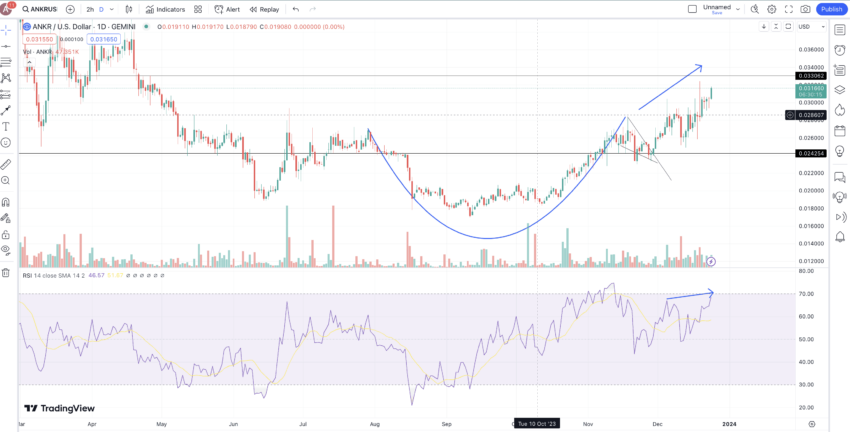
Firstly, the December 2023 chart looks massively bullish for ANKR. While the breakout, after the cup-and-handle pattern, is evident, even the RSI agrees with the rising prices, making higher highs in the process. If the momentum continues and ANKR pushes past the $0.033062 mark, we can expect new highs.
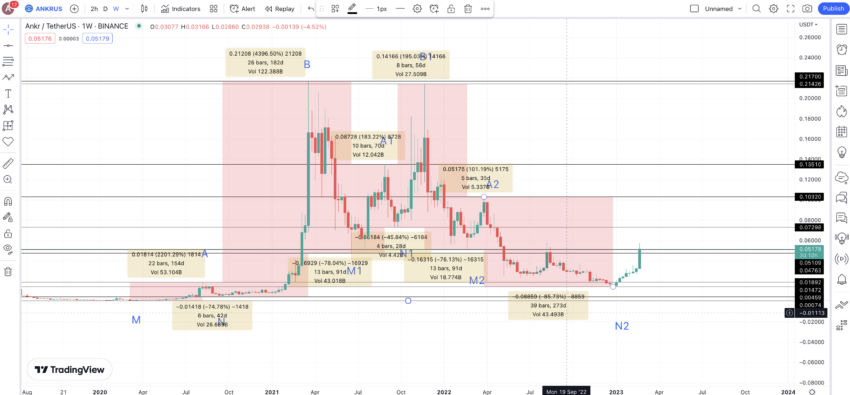
Now, let us move to the weekly ANKR-USDT chart to locate long-term price prediction trends.
Pattern identification
The weekly chart shows a clear pattern. ANKR makes a high (say A) followed by another higher high (B). That’s one part of the pattern.
After a low, it forms another high (A1) and then a higher high (B2). Post B2, ANKR forms another low and a subsequent high (say A3). If ANKR follows the same set of patterns, we can expect the price of ANKR to form another high higher than A3.
Notice the weekly RSI corresponding to the path from A2 to the current level is forming a bullish divergence against the dropping price action. Hence, our optimism concerning the price of B2 surfacing higher than A2 seems justified.
Price changes
Let us plot the price change percentages and distance between all the points corresponding to a specific pattern or path. We will have three paths to look at here: M to M1, M1 to M2, and M2 to N2.
Let us start plotting:
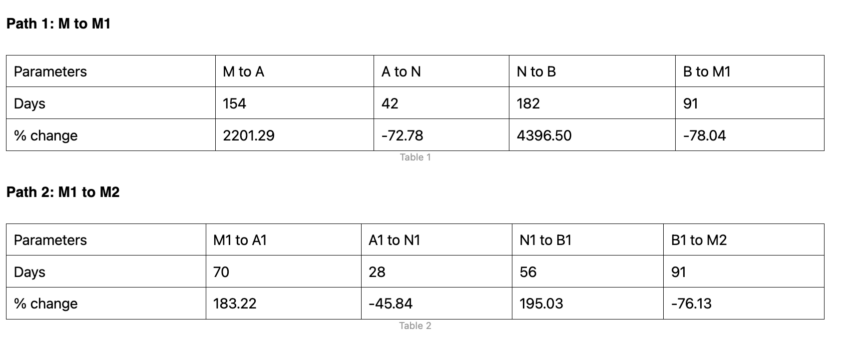
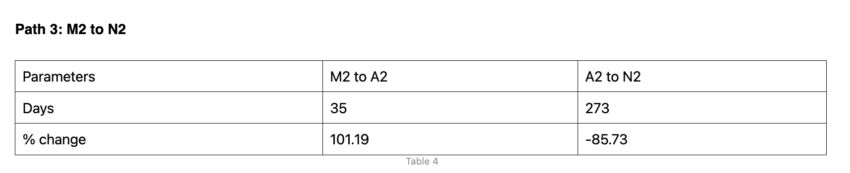
We have a mix of non-negative and negative columns in each table, which represents a different path. We are averaging these values to determine the probable trends for ANKR to calculate the low-to-high and high-to-low average price percentages. The low-to-high average is calculated at 1415.45% over 99 days. This indicates that the price growth could range anywhere from 101.19% (the lowest recorded increase value) to the higher average of 1415.45%. Additionally, the timeframe for these changes could extend to 182 days, as suggested by the data in Table 1 or Path 1.
Similarly, the high-to-low average is noted at 71.70% over 105 days. This means that the price drop could vary from 45.84% (the lowest recorded decrease value) to an average drop of 71.70%. For this trend, the timeframe might stretch up to 273 days, as indicated in Table 3 or Path 3. With these averages and timeframes in mind, we can plot future ANKR price predictions based on the data analyzed.
Ankr Network (ANKR) price prediction 2023
Note: Although ANKR didn’t successfully reach the price we predicted for it in 2023, it did align with the low levels associated with our short-term analysis. Here is how our analysis read in 2023:
N2 is the latest low we have in sight. From this level, the next expected high or B2 could go as high as 1415.45% in 182 days. This puts the ANKR price prediction high for 2023 at $0.223, which is somewhere in mid-2023.
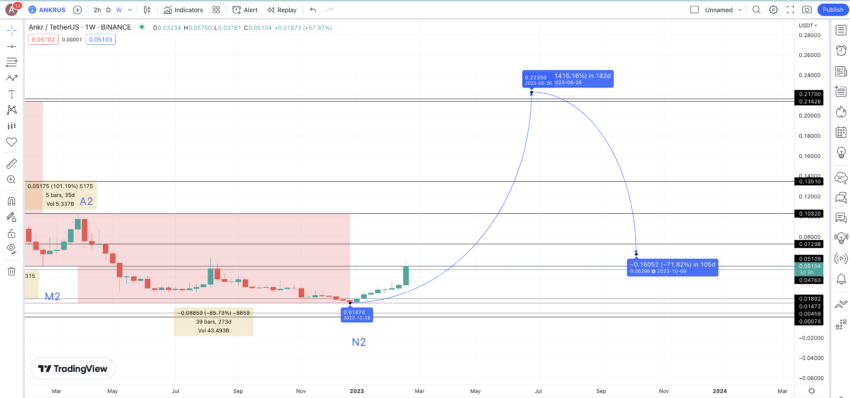
Depending on current market conditions, the next low can drop 71.70% (the average price drop). This puts the minimum price of ANKR at $0.069 by the end of 2023. We can mark this level M3.
Ankr Network (ANKR) price prediction 2024
Do note that we were prepared for ANKR’s bearish plan in 2023 and, therefore, followed a rather conservative approach to 2024.
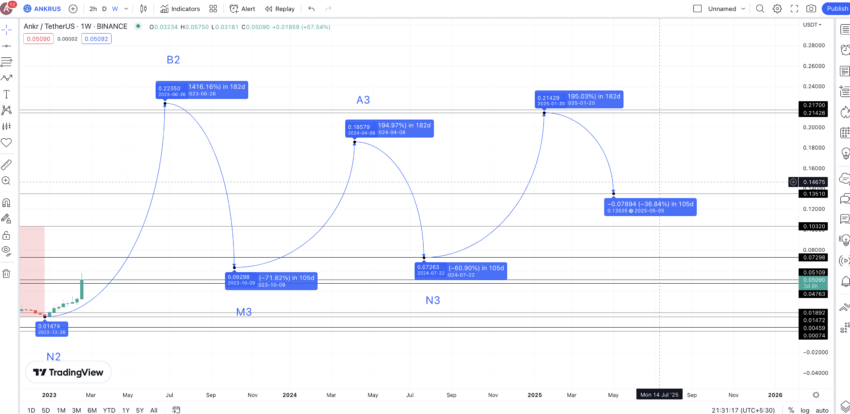
In 2024, once the liquid staking fever subsides a bit, we can expect the price growth to be more on the expected lines. Therefore, from M3, we can expect the next high to go up by 195.03% — the third-lowest price hike percentage.
This puts A3 or the ANKR price prediction high for 2024 at $0.186. The next low, as per the average, could drop 71.70%. However, considering the expected bullish at ANKR’s counter and the higher maximum prices in B2 and A3, we can expect the low in 2024 to take support at $0.07298 — which translates into a drop of almost 61% and seems in sync with our calculations.
The next peak, from the lows of N3, can again move up by 195.03%, as it is the only percentage value immediately lower than the average of 1415.45%.
This puts the next high, or B3, at $0.2142.
Projected ROI from the current level: 350%
Ankr Network (ANKR) price prediction 2025
Outlook: Bullish
ANKR price forecast till 2025: slow but steady?
Hence, once ANKR reaches $0.223, presumably in 2023, you can expect it to move in a range for the next couple of years — courtesy of increased selling or low trading volume.
The low in 2025 could take support at $0.135, provided the crypto market starts looking up, and liquidity staking starts picking up in popularity again. This level is at a low of 36.84%, which is better than the minimum drop percentage of 45.84 (per table 2).
If the price of ANKR tokens takes support at $0.135 in 2025, we can expect the prices to start looking up again in 2025.
From the last projected low of $0.135 or M4, expect the next high to chart a peak of 195.03% by the end of 2025. This puts the maximum price of ANKR in 2025 at $0.399.
Projected ROI from the current level: 1166%
Ankr Network (ANKR) price prediction 2030
Outlook: Very bullish
From the last high or $0.399, the next low could surface in 105 days and take support at $0.21426, which coincides with B1 from the previous pattern. This translates into a drop of 46.25% — in line with our expectations from the tables above.
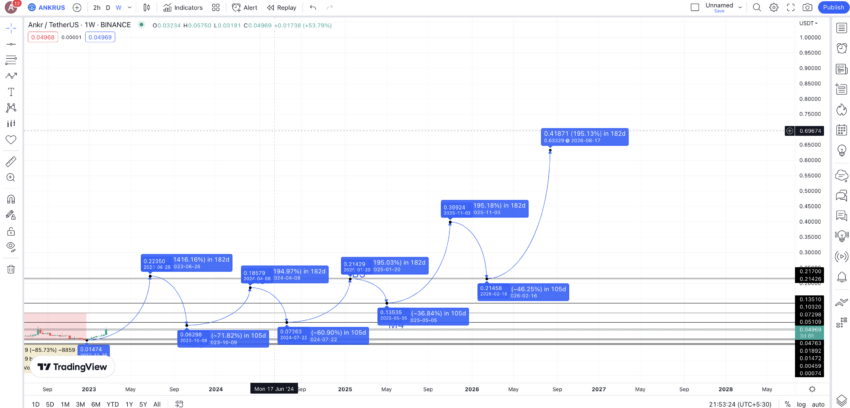
Considering the previous patterns, the next high could again surface at 195.03% from this level. This puts the ANKR price forecast for 2026 at $0.63329.
Using the low in 2026 and with the year’s high in sight, we can extrapolate the ANKR price forecast levels till 2030 via the Fib levels. If the maximum prices of ANKR follow the same growth path, we expect the ANKR price prediction high for 2030 to reach $4.224.
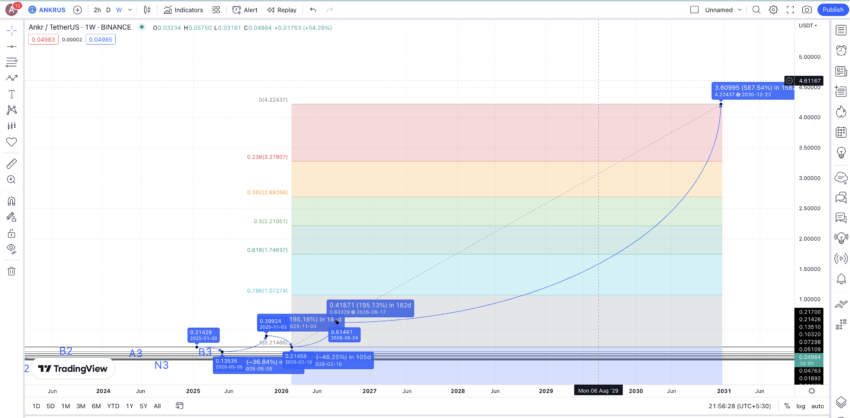
Projected ROI from the current level: 13496%
Ankr Network (ANKR’s) long-term price prediction until the year 2035
Outlook: Very bullish
Now we have plotted the minimum and maximum prices of ANKR till 2030, the table below can help locate the prices and gauge the growth of Ankr Network through 2030.
You can easily convert your ANKR to USD here
| Year | | Maximum price of ANKR | | Minimum price of ANKR |
| 2023 | $0.049 | $0.0150 |
| 2024 | $0.186 | $0.073 |
| 2025 | $0.399 | $0.135 |
| 2026 | $0.63329 | $0.214 |
| 2027 | $0.95 | $0.59 |
| 2028 | $1.66 | $1.29 |
| 2029 | $2.49 | $1.54 |
| 2030 | $4.224 | $3.29 |
| 2031 | $5.07 | $3.95 |
| 2032 | $7.60 | $5.92 |
| 2033 | $11.40 | $8.89 |
| 2034 | $18.81 | $14.67 |
| 2035 | $22.57 | $17.60 |
Is the ANKR price prediction model accurate enough?
Before conducting an in-depth, data-backed technical analysis, this ANKR price prediction model considers the fundamentals, tokenomics, and other key metrics relevant to ANKR. Here, we have accounted for both short-term and long-term price progressions. As such, this ANKR price forecast theory is as reliable, accurate, and holistic as possible, given the dynamic nature of the crypto market.
Frequently asked questions
What will the ANKR coin be worth in 2025?
Is ANKR coin a good investment?
Can ANKR crypto reach $1?
What is ANKR’s all-time high?
Disclaimer
In line with the Trust Project guidelines, the educational content on this website is offered in good faith and for general information purposes only. BeInCrypto prioritizes providing high-quality information, taking the time to research and create informative content for readers. While partners may reward the company with commissions for placements in articles, these commissions do not influence the unbiased, honest, and helpful content creation process. Any action taken by the reader based on this information is strictly at their own risk. Please note that our Terms and Conditions, Privacy Policy, and Disclaimers have been updated.