

Be[In]Crypto takes a look at the five cryptocurrencies that decreased the most last week, more specifically from July 1 to July 8.
These cryptocurrencies are:
- Numeraire (NMR) : -37.97%
- Stratis (STRAX) : -26.47%
- Amp (AMP) : -9.61%
- Kucoin Token (KCS) : -7.27%
- Huobi Token (HT) : -4.50%
NMR
NMR was subject to a massive increase from June 28 to 29, moving upwards by 350% in the process. However, it failed to sustain its upward movement, created a long upper wick and has been falling since.
Additionally, NMR failed to break out from a descending resistance line that has been in place since Sept 2021. Until it does, the trend cannot be considered bullish.

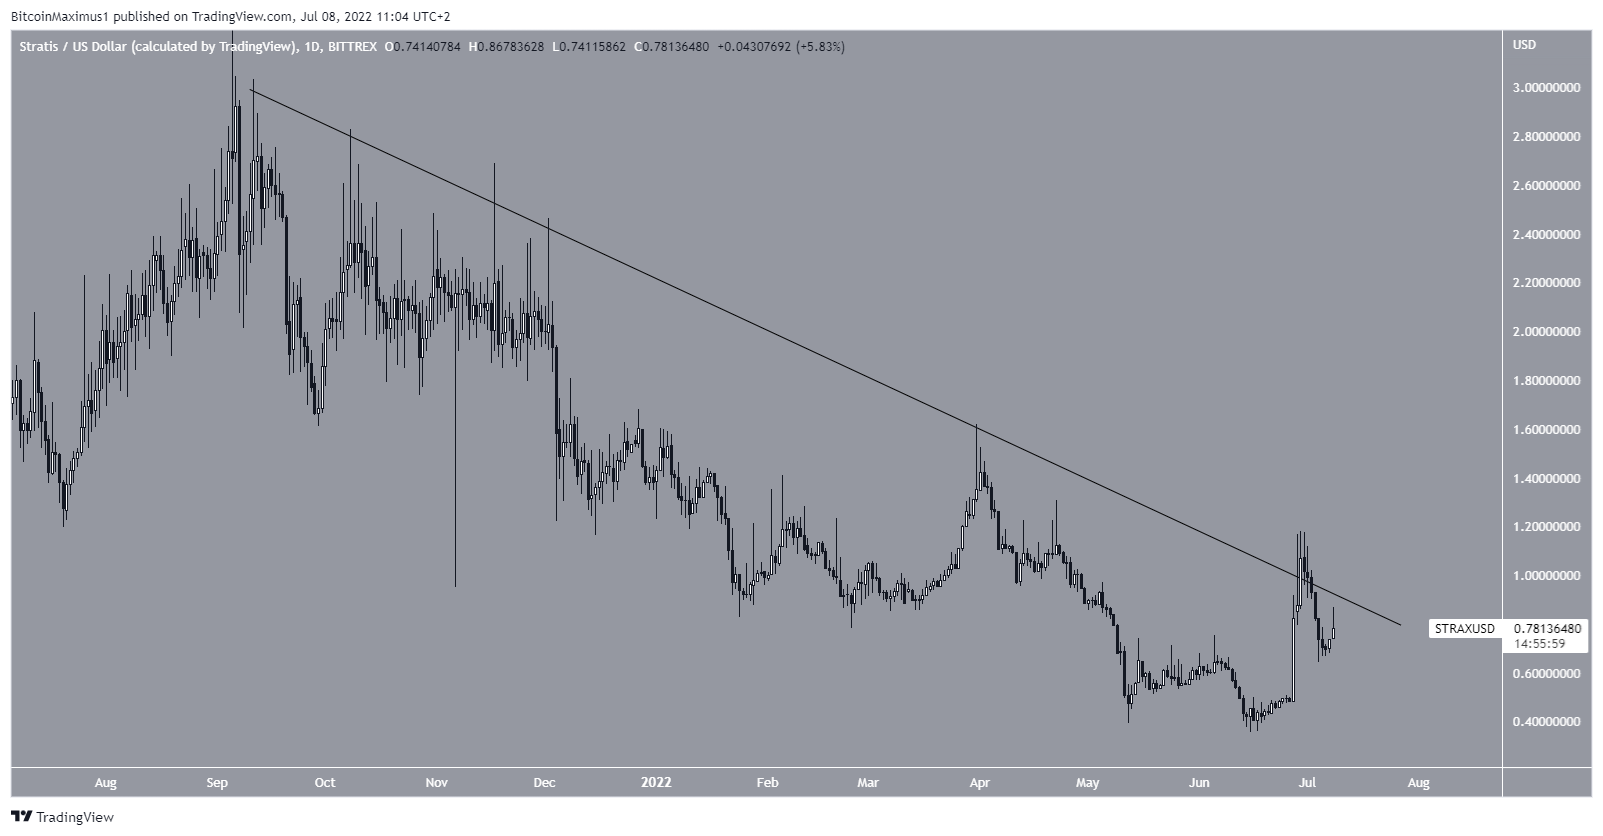
STRAX
Similarly to NMR, STRAX has been following a descending resistance line since Sept 2021. The price initiated a significant upward movement on June 27 and seemingly broke out from the pattern.
However, the breakout turned out to be only a deviation (red circle) and STRAX is now back trading below the line.
The trend cannot be considered bullish until a confirmed breakout transpires.
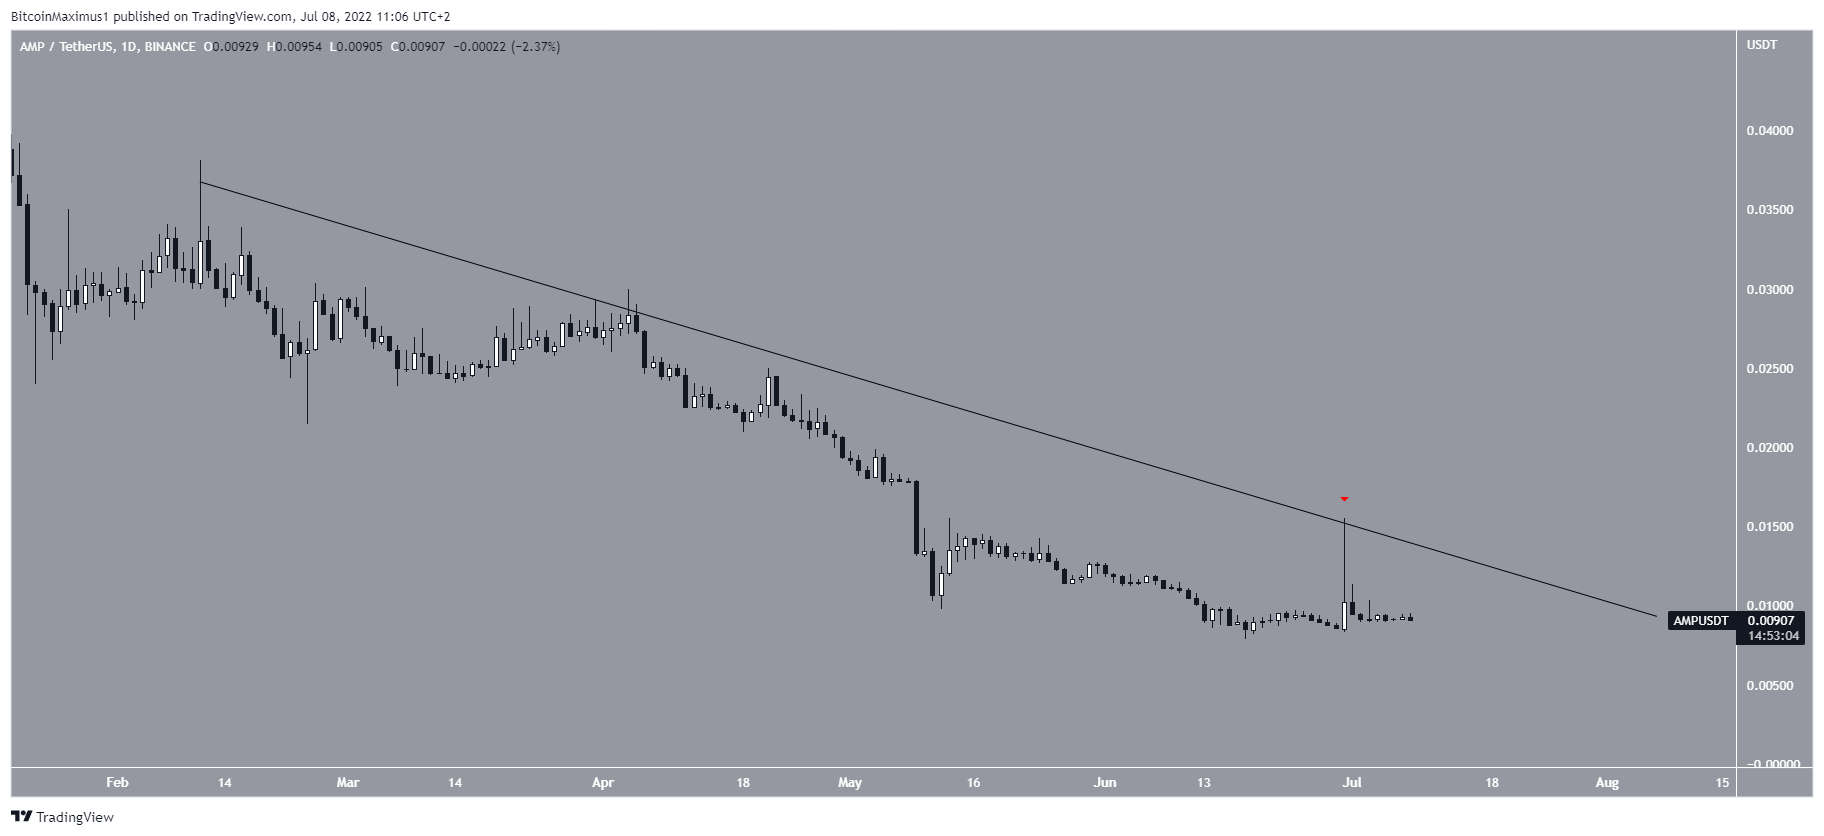
AMP
AMP has also been falling underneath a descending resistance line since Feb 11. This led to an all-time low of $0.007 on June 18.
The price increased afterwards seemingly initiating an upward movement on June 30. However, it failed to break out from the resistance line and created a long upper wick (red icon) instead.
Until it manages to break out, the trend cannot be considered bullish.
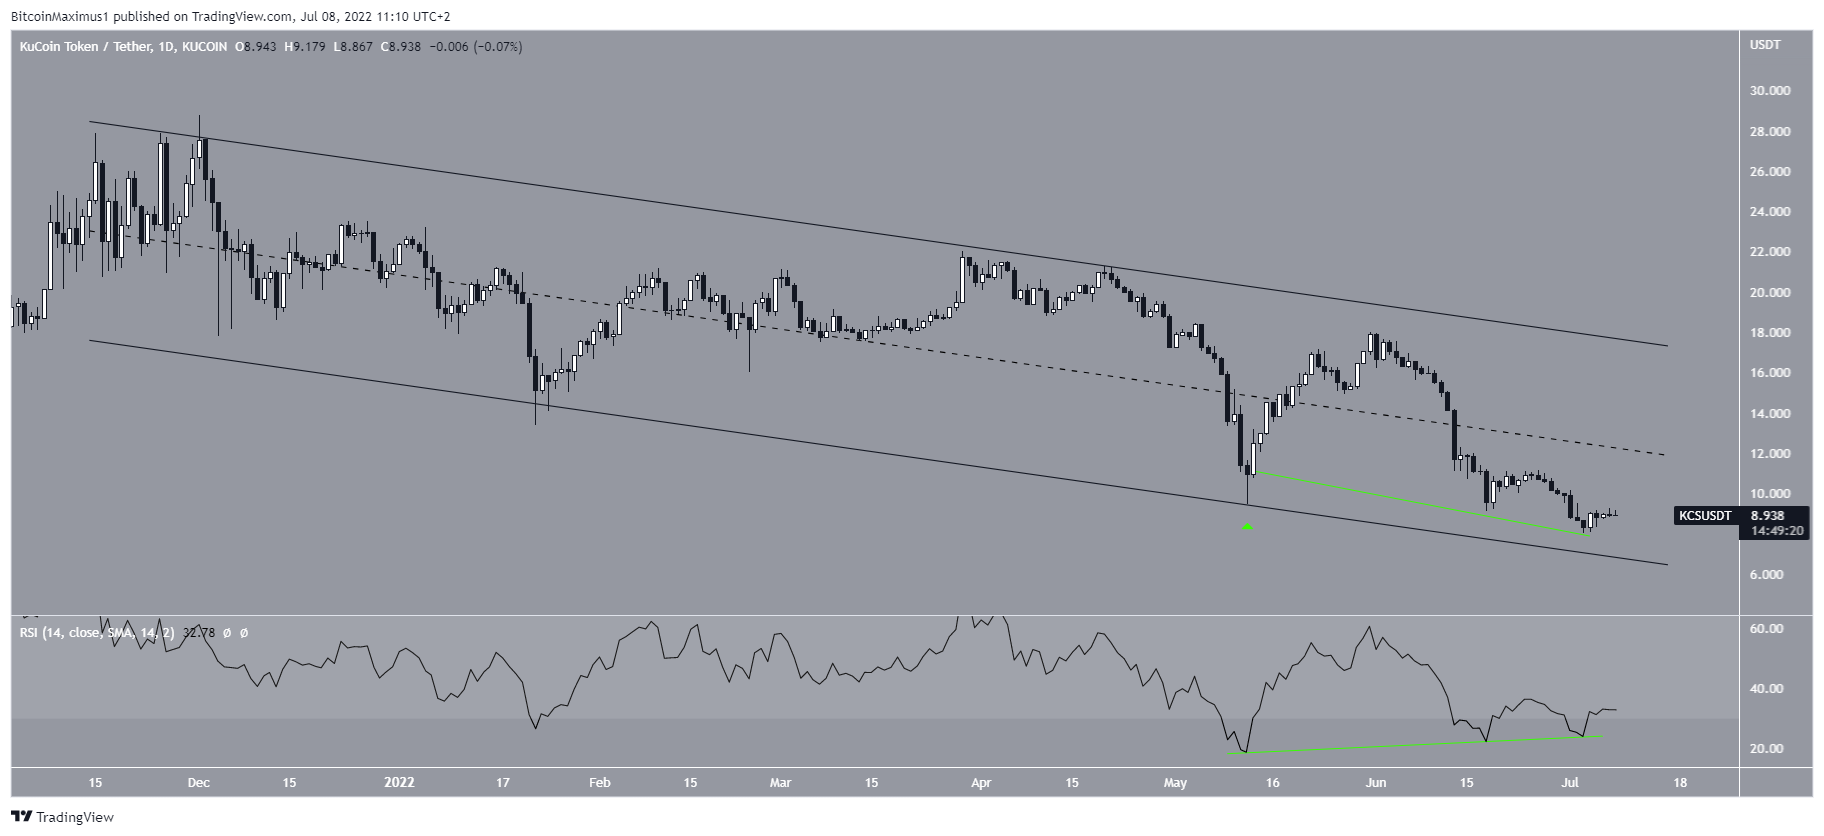
KCS
KCS has been trading inside a descending parallel channel since Dec 2021. Such channels usually contain corrective patterns. This means that an eventual breakout would be likely.
On May 12, the price bounced at the support line of the channel (green icon) and created a long lower wick. While it has been decreasing since, the daily RSI has generated a very significant bullish divergence. This is a sign that often precedes bullish trend reversals.
A reclaim of the middle of the channel would be a strong sign for a potential breakout.
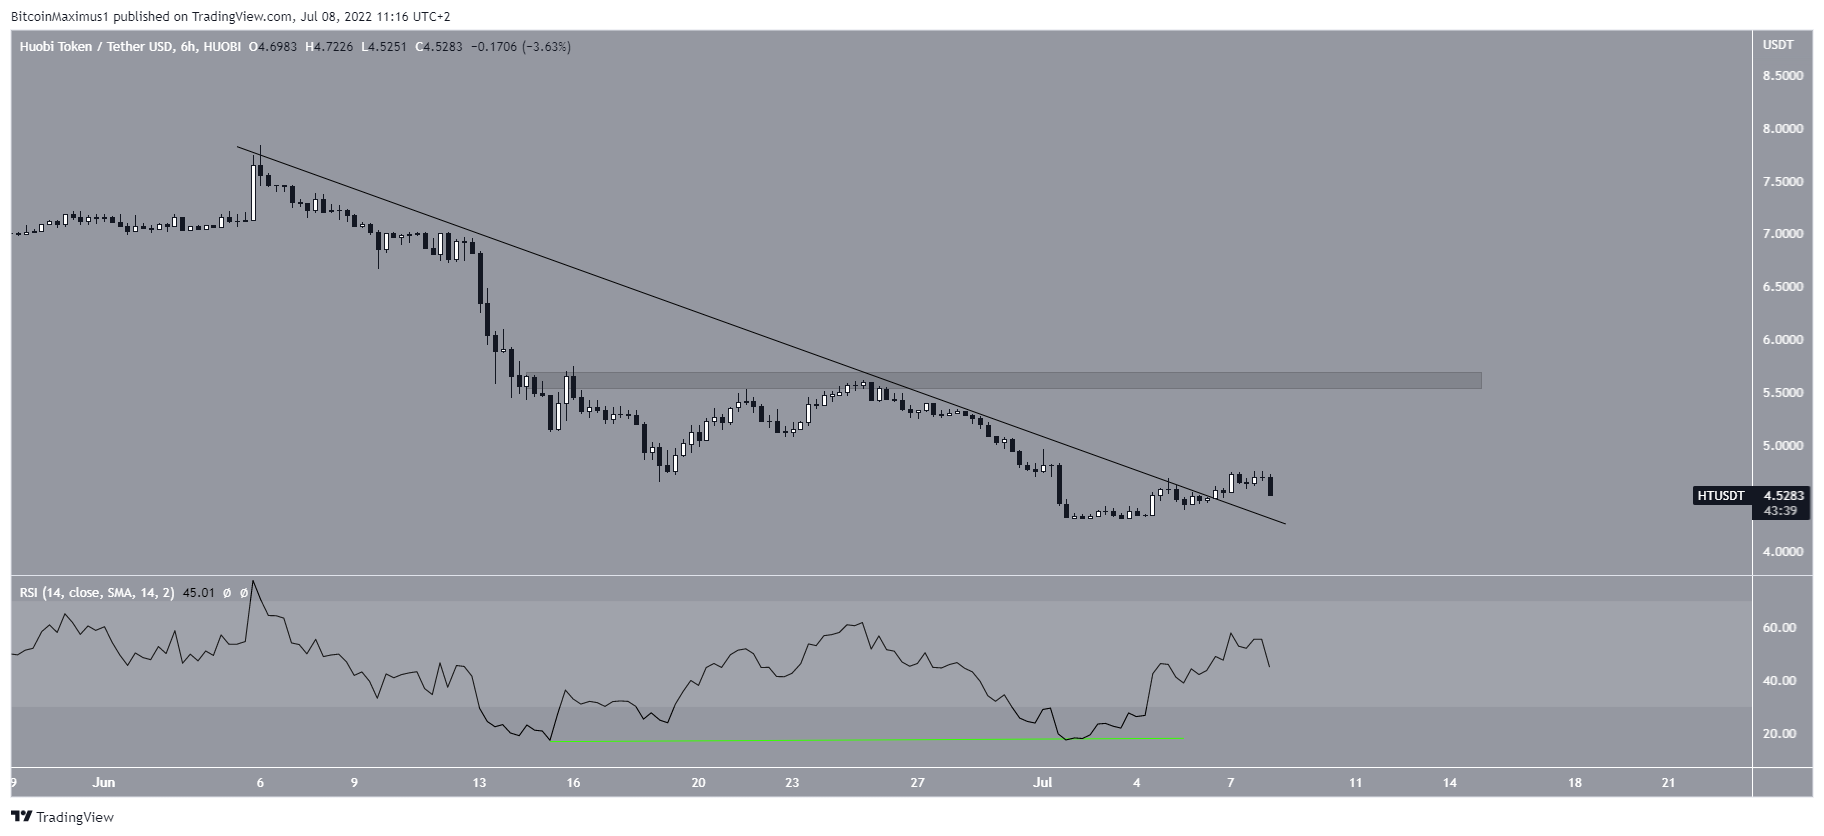
HT
HT had been falling underneath a descending resistance line since June 6. This led to a low of $4.30 on July 1.
Afterward, the price increased and broke out from the resistance line. The breakout was preceded by bullish divergence in the RSI. However, it has yet to create any sort of bullish structure.
If the price manages to create a higher low, the closest resistance would be at $5.60.
For Be[in]Crypto’s latest bitcoin (BTC) analysis, click here
Disclaimer
In line with the Trust Project guidelines, this price analysis article is for informational purposes only and should not be considered financial or investment advice. BeInCrypto is committed to accurate, unbiased reporting, but market conditions are subject to change without notice. Always conduct your own research and consult with a professional before making any financial decisions. Please note that our Terms and Conditions, Privacy Policy, and Disclaimers have been updated.
