


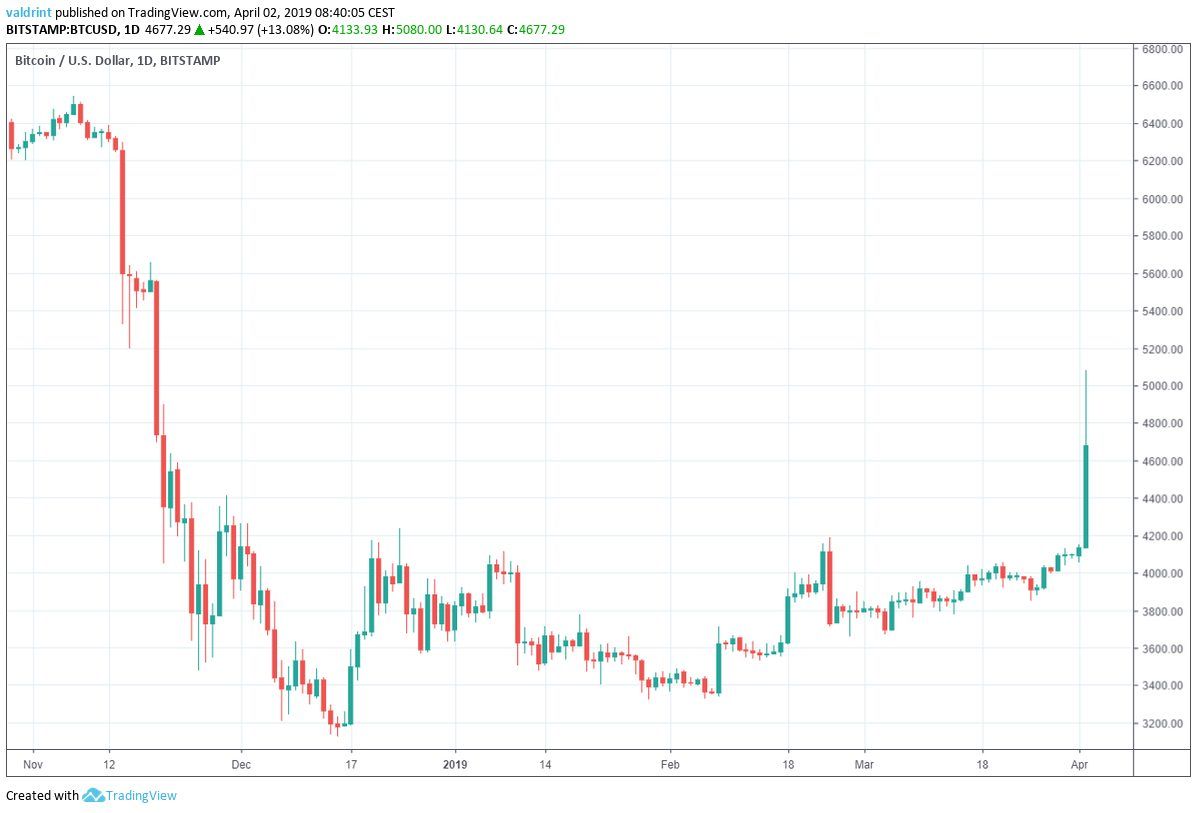
On Nov 1, 2018, the price of Bitcoin (BTC) was trading at $6269.45. A sharp drop began on Nov 14. The price made a bottom at $3122 on Dec 15.
Between Dec 15 and Apr 1, Bitcoin experienced a sharp increase followed by a gradual decrease. The price traded has mostly traded between $3200 and $4200 throughout 2019.
On Apr 2, an upward move was initiated which took the price to a high of $5080. At the time of writing, that is the highest price reached for the day.
Is this the beginning of a new uptrend? Where will the price go from here?
Bitcoin (BTC): Key Trends And Highlights for April 2019
- BTC/USD had been trading in an ascending triangle since Dec 17.
- A breakout from the trading pattern occurred on Apr 2 with significant volume.
- Bitcoin is trading above the 200-day moving average.
Ascending Triangle
The price of BTC/USD on BitStamp is analyzed at one-day intervals from Nov 1, 2018 to Apr 2, 2019 in order to determine its current trading pattern.
On Dec 15, Bitcoin made a low of $3122.28. A sharp upward move was followed by a gradual increase. The increase intensified on Feb 7.
Each low has been higher than the last. Tracing these lows gives us an ascending resistance line:
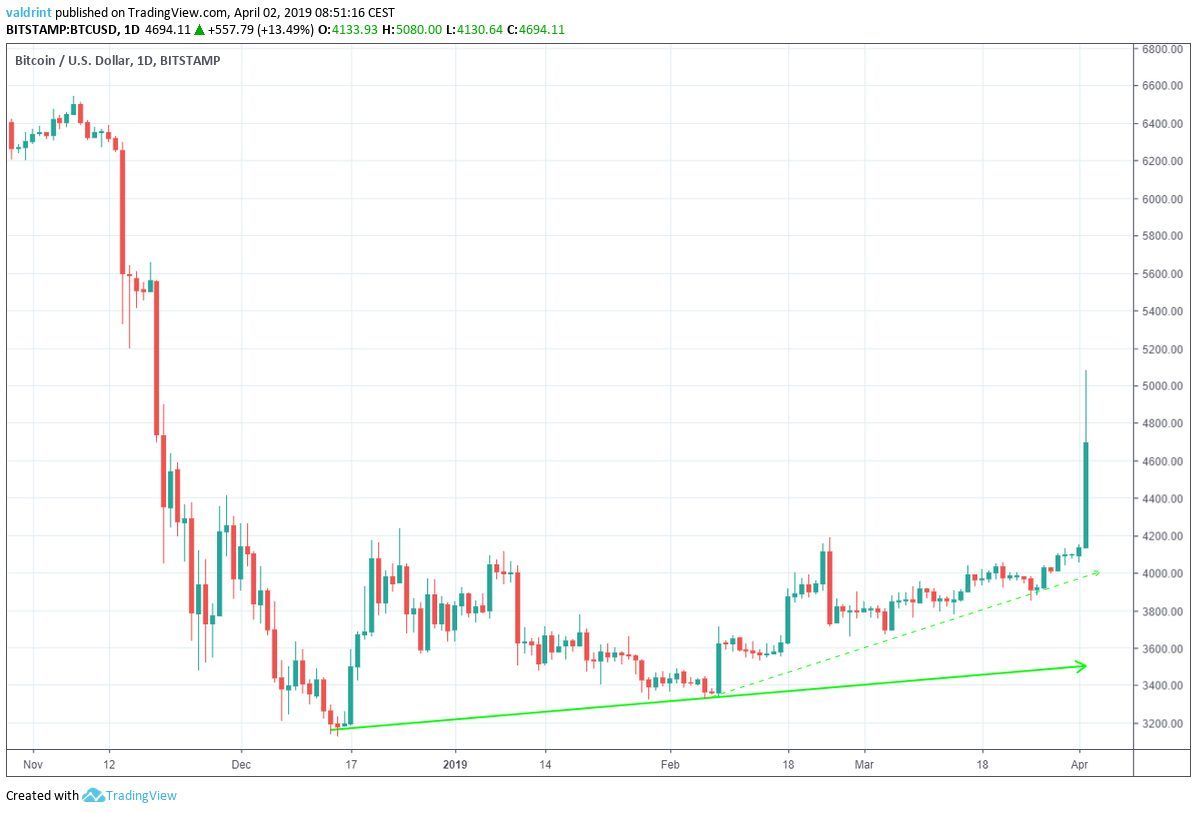
On Dec 1, the price reached a high of $4264.47. A gradual decrease followed. The price reached the same level several times. Tracing these highs gives us a horizontal resistance line.
The support and resistance lines combine to create an ascending triangle:
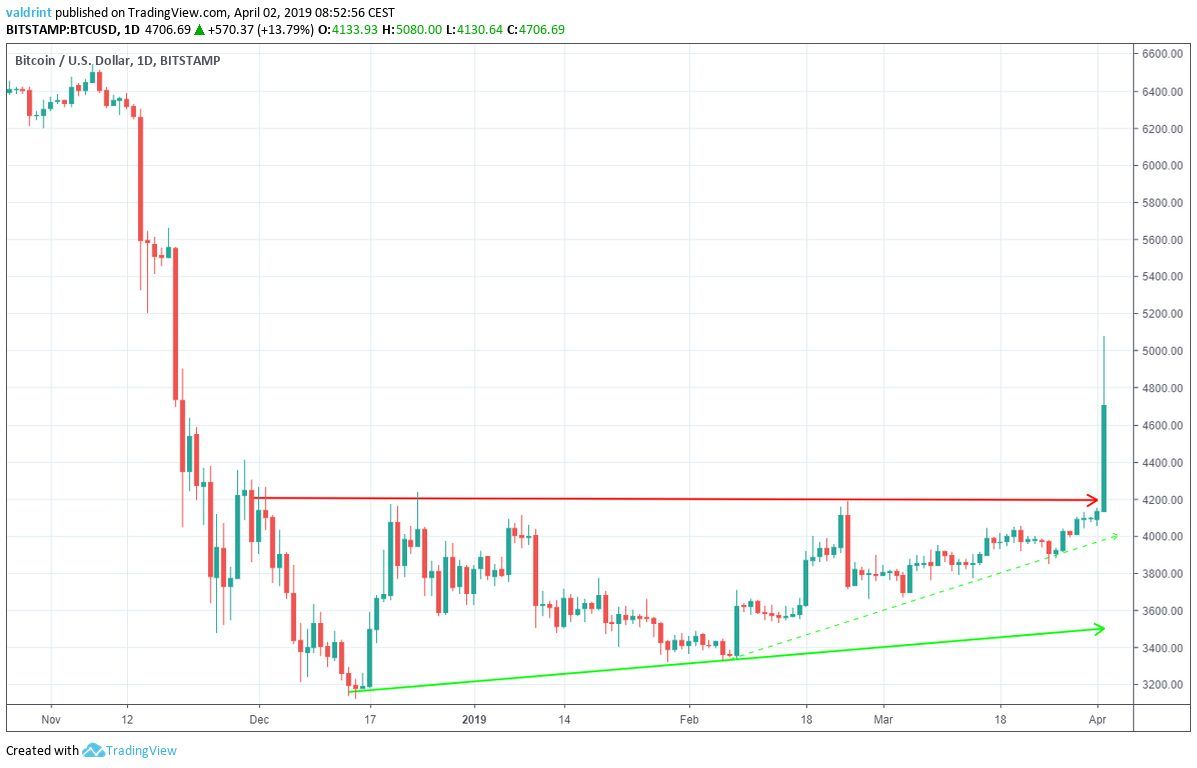
The breakout from the triangle occurred on Apr 2. If this was a valid breakout, we may expect continued price gains. However, a false breakdown may lead Bitcoin back into the triangle.
Furthermore, even if the breakout was valid, slight price drops may precede greater increases. Such decreases would most likely not represent a full reversal but a slight correction.
Moving Averages
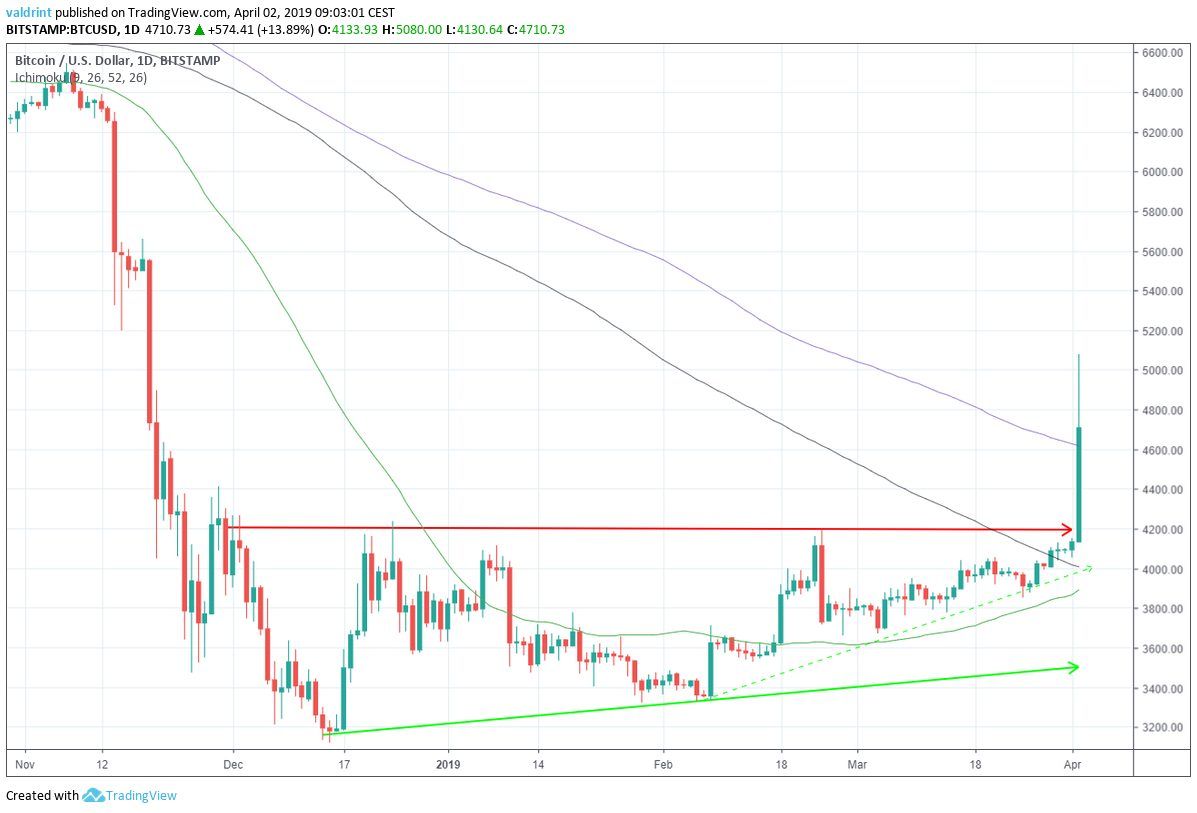
On Feb 18, the price moved past the 50-day moving average (MA). It moved past the 100-day MA on Mar 29. Lastly, Bitcoin moved past the final 200-day MA on Apr 2.
This is the first time that Bitcoin has traded above the 200-day MA it since March 2018. Such an occurrence could indicate that the breakout may be valid.
In such a case, Bitcoin has now out of major long-term resistance and may have already begun a new uptrend. This will have to be assessed in future analyses.

Volume
On Apr 2, the six hour candle from 02:00 to 08:00 (UTC+2) opened at $4133, made a high at $5080 before closing at $4738.
This movement was done with very substantial volume. It was the highest six-hour volume Bitcoin has seen since Nov 21, 2018:
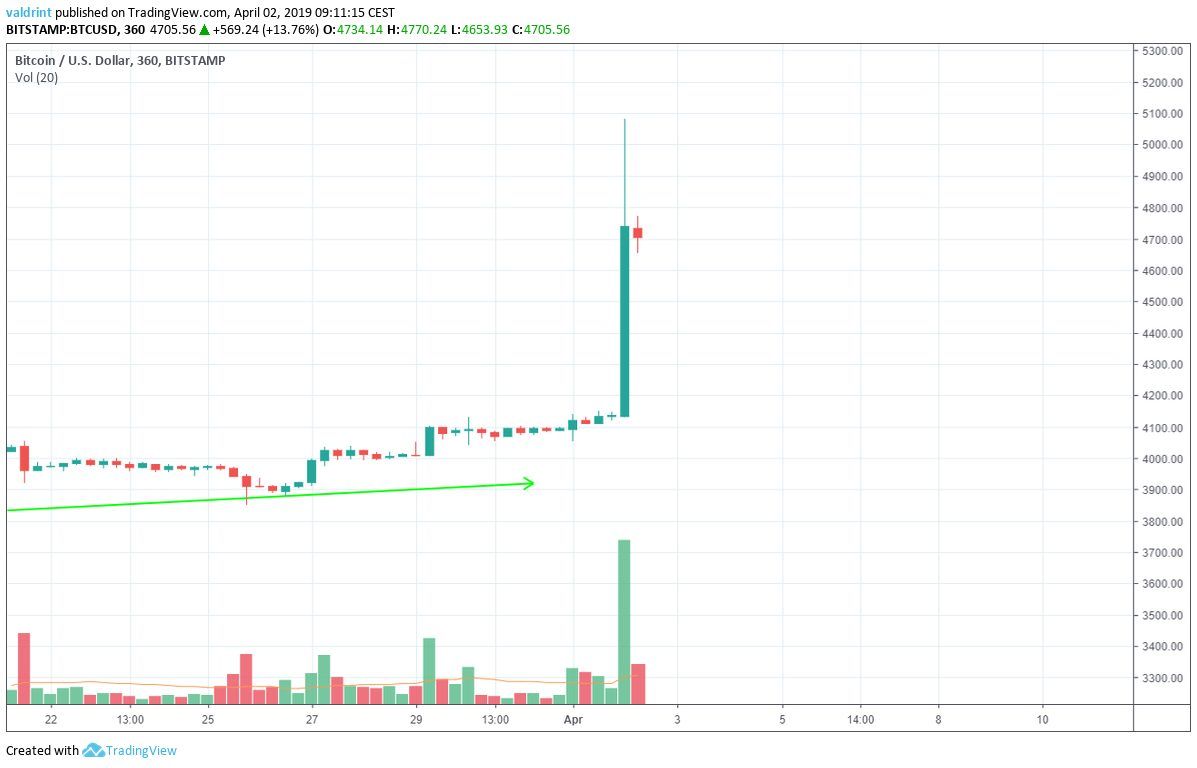
This suggests further that the breakout is genuine and higher prices are to be expected in the future.
April Price Prediction And Summary
The price had been trading inside the triangle for the past 121 days. Therefore, we would expect the movement succeeding the breakout to take around 80-160 days (±20%)
As seen from the graph, the green arrow is the height of the triangle. Copying the distance to the point of the breakout, we get a height of $5250 for the possible top of the current upward move:
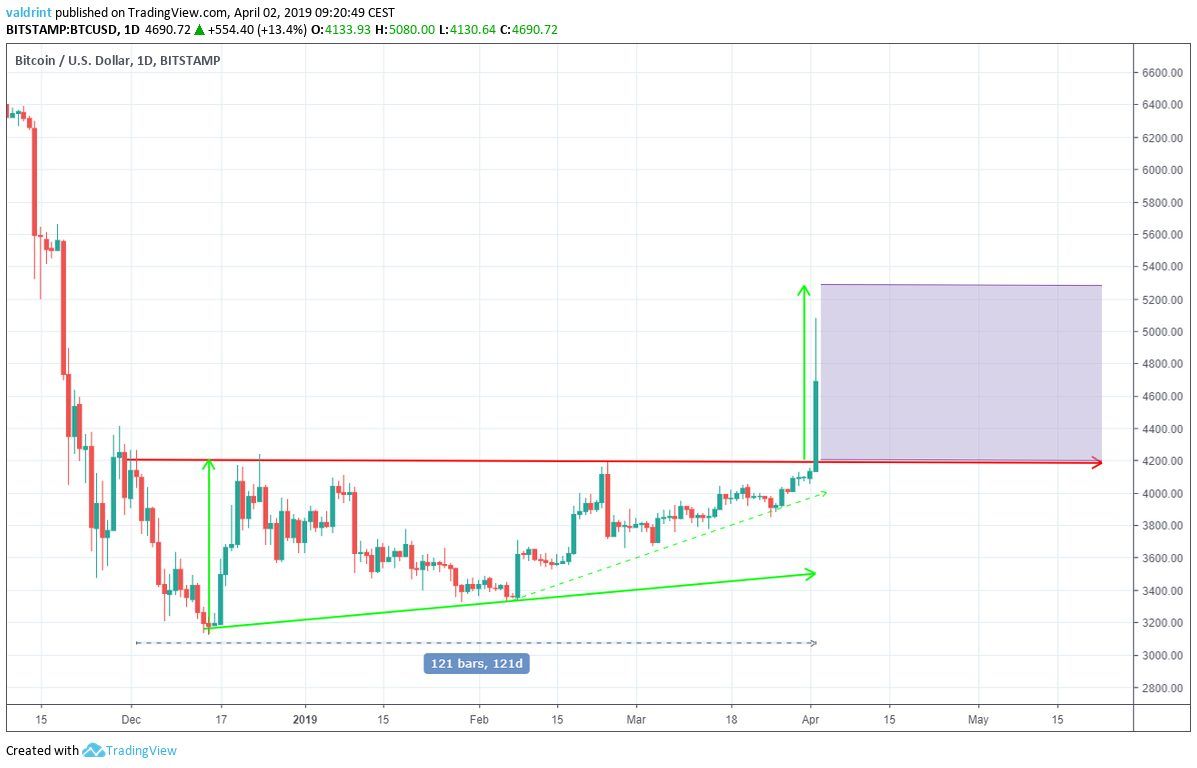
Judging by the length and height of the triangle, we believe it is likely that the price will trade between $4200 and $5200 throughout April.
It is possible that the price will drop to touch the resistance line and validate it as support, before beginning another upward move.
How much do you think the price of BTC will keep increasing? Let us know your thoughts in the comments below!
Disclaimer: This article is not trading advice and should not be construed as such. Always consult a trained financial professional before investing in cryptocurrencies, as the market is particularly volatile.


