


On Nov 12, 2018, the price of XRP (XRP) was trading at $0.51. A sharp drop began on Nov 19.
XRP reached a bottom of $0.28 on Dec 15. A sharp increase was followed by a gradual decrease.
During the first quarter of 2019, XRP was consistently trading between $0.35 and $0.28.
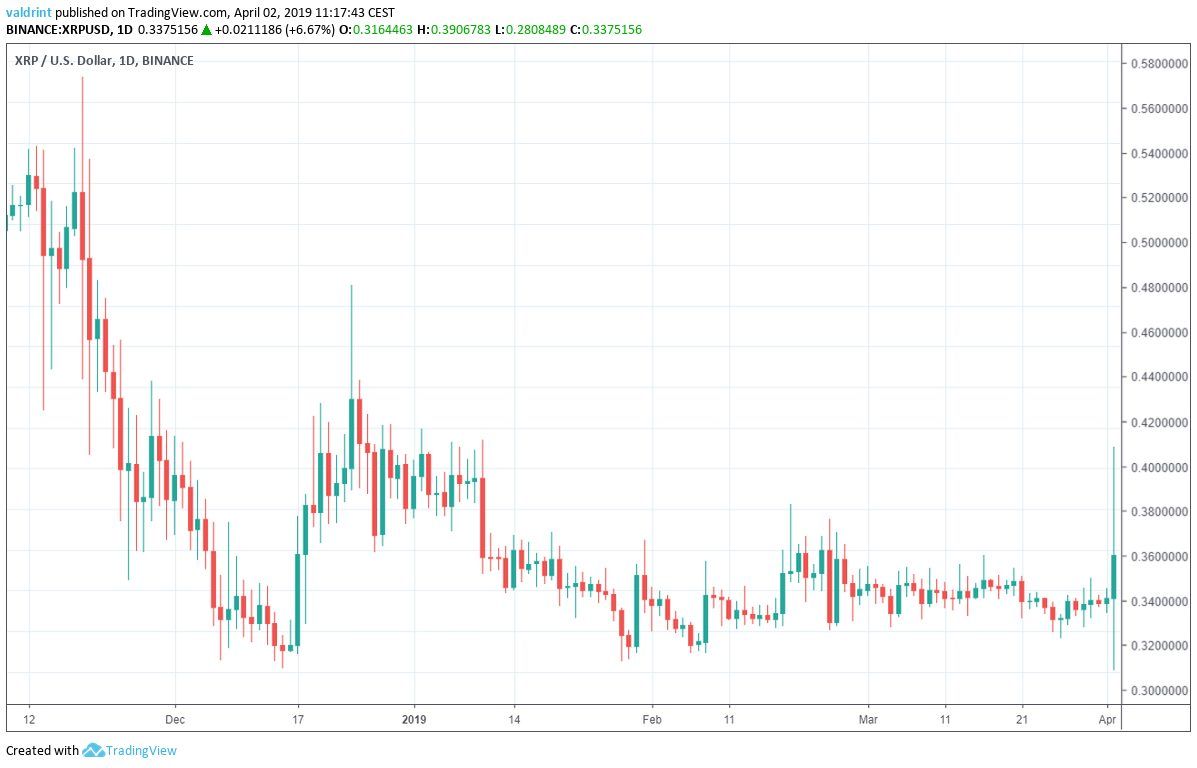
A breakout occurred on Apr 2 (see graph above). This took XRP to a surprise high of $0.39. While this may have been an organic movement, it also may have been catalyzed by Bitcoin’s recent spike to over $5000.
XRP (XRP) Key Trends And Highlights
- The price of XRP had been trading in a symmetrical triangle since Dec 17.
- A breakout occurred on Apr 2.
- The breakout occurred with above-average volume.
- XRP is trading below the 100 and 200-period moving averages.
An Ascending Triangle
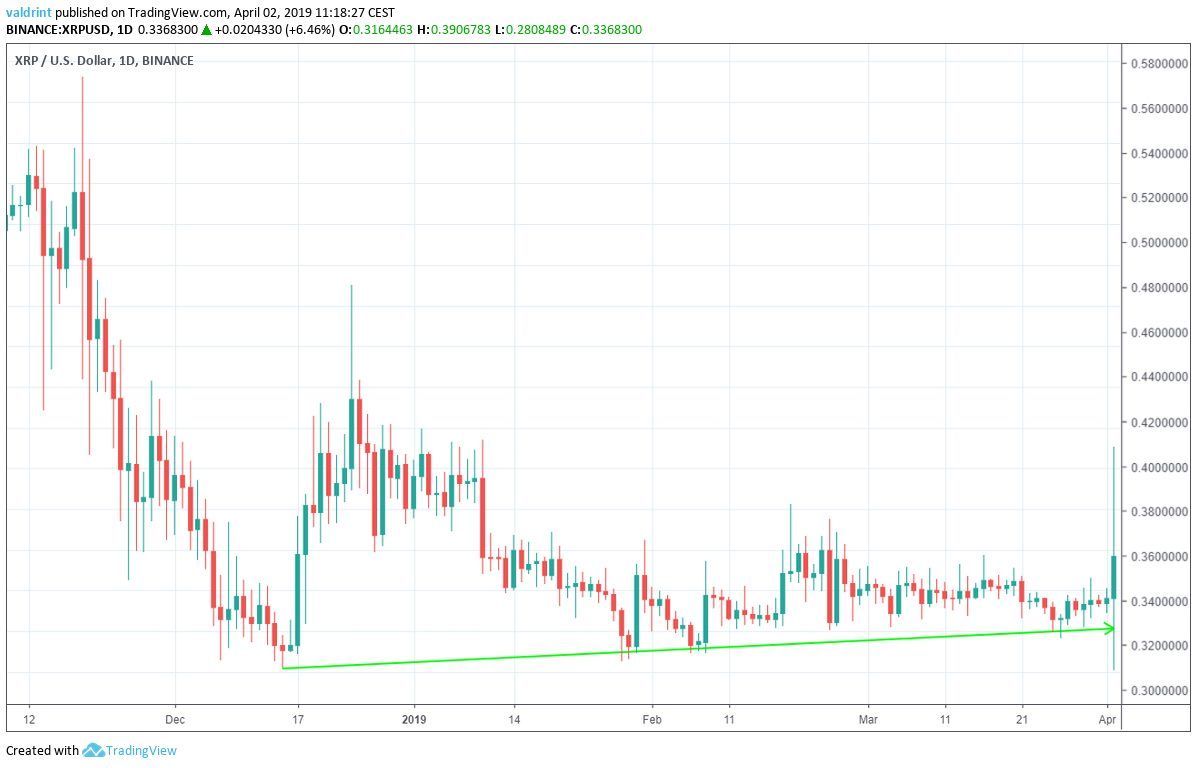
The price of XRP on Binance is analyzed at one-day intervals from Nov 12, 2018 to Apr 2, 2019. This will help us trace XRP’s long-term trading pattern.
On Dec 17, the price made a low of $0.28. A sharp upward move was followed by a gradual decrease.
Tracing the lows during this period gives us an ascending support line:
Tracing these highs gives us a descending resistance line.
The support and resistance lines combine to create a symmetrical triangle:
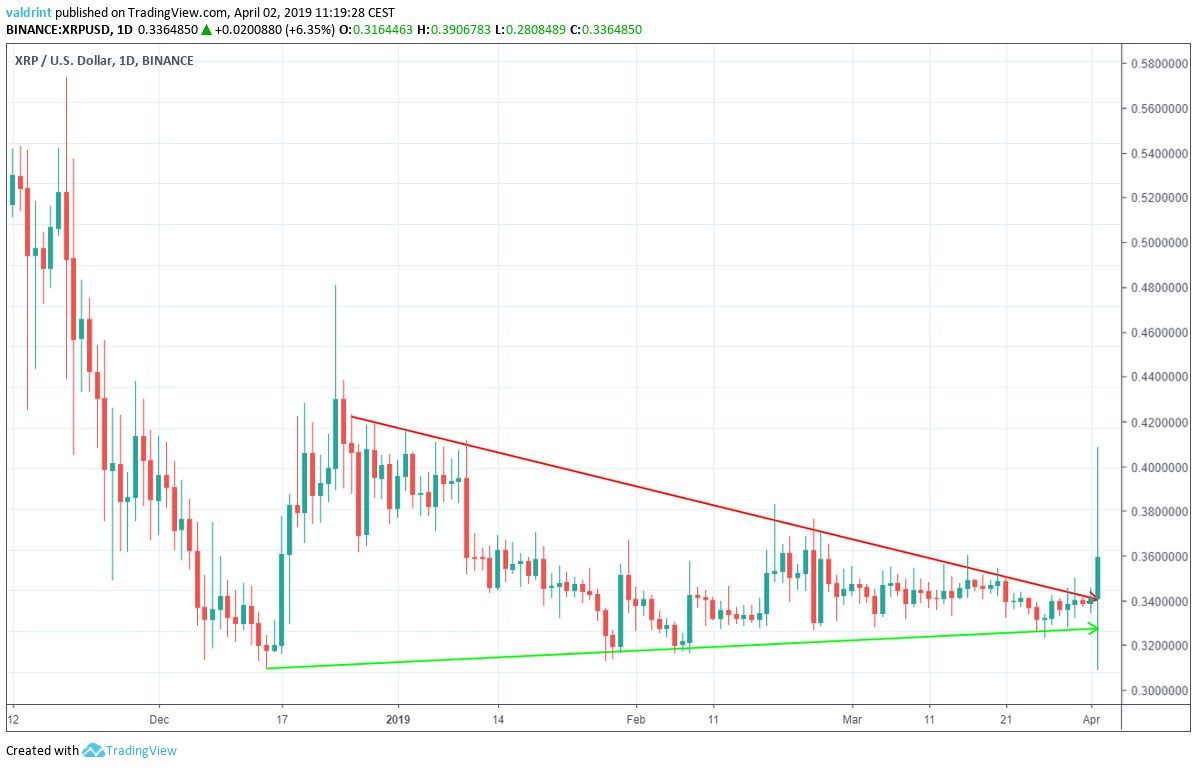
On Apr 2, the price broke out from the triangle. This breakout occurred near the point of convergence which suggests its validity.
However, the breakout might also have been false. If this movement was catalyzed by Bitcoin’s spike, this is likely the case.
If the breakout is valid, price may increase to or above $0.40. However, a false breakout may lead to continued price drops.
Throughout March, XRP lost nearly 2% of its value. If the breakout is false, continued losses may in store.
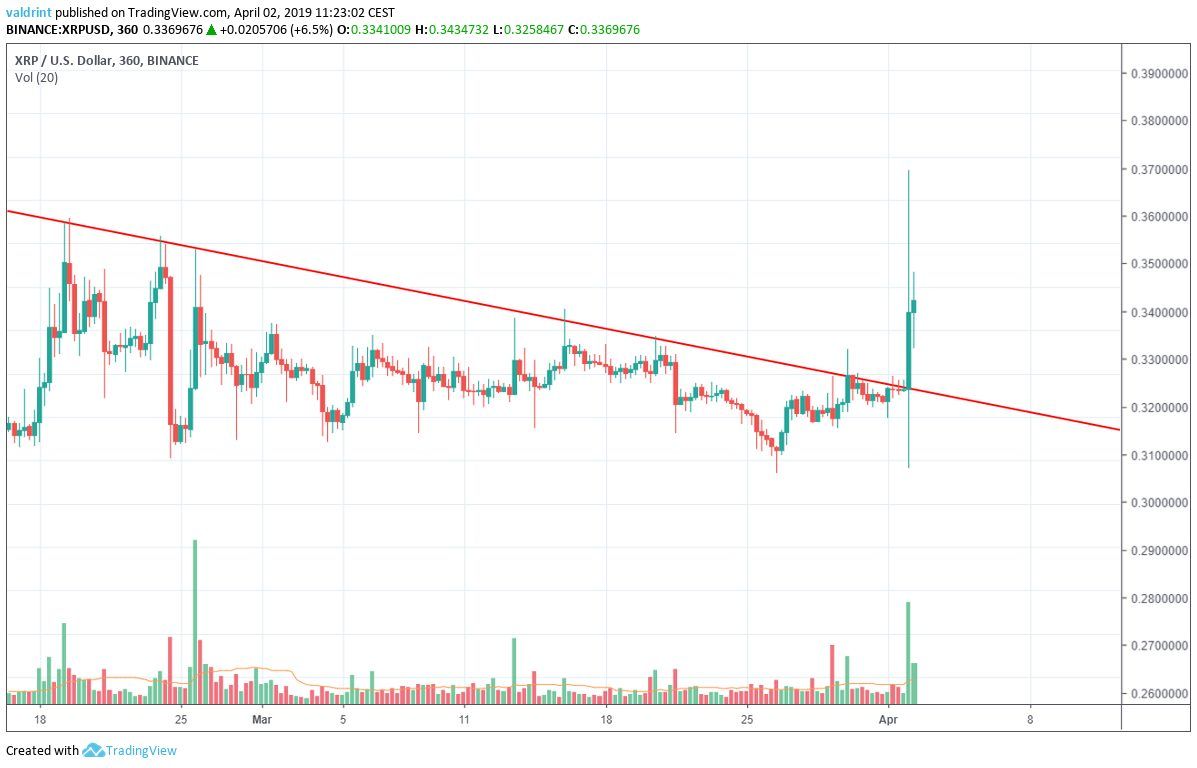
Moving Averages & Volume
Below, MAs and volume are traced alongside XRP’s price:
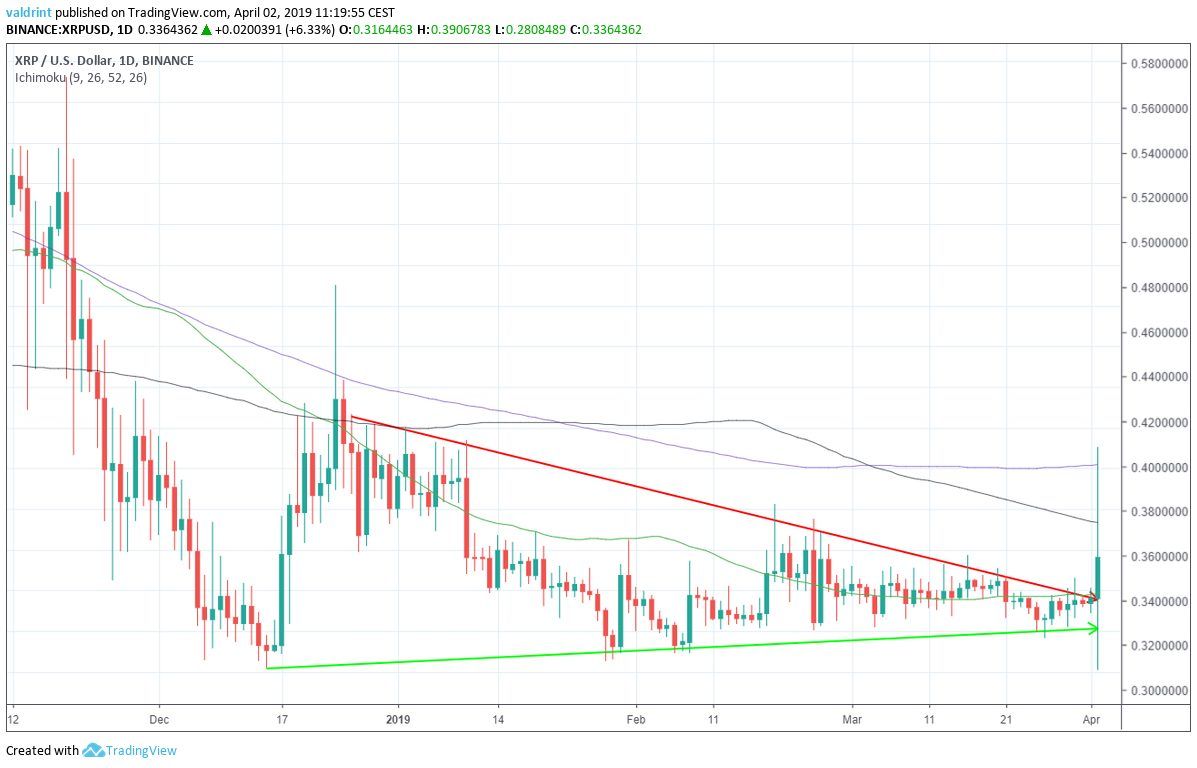
On Apr 2, the price broke out from the symmetrical triangle. It also moved above the 50-period moving average (green).The $0.39 daily high coincided with the 200-period MA (black). It immediately got pushed back.
At the time of writing, the price is trading below the 100 and 200-period MAs. Therefore, there is still some resistance left for the price to clear.
This is in contrast to other leading cryptocurrencies, such as Bitcoin and Ethereum. Both are trading above their 100-period MAs. Furthermore, BTC is trading above its 200-period MA.
In addition, the Apr 2 breakout occurred with above-average volume.
This was the highest volume recorded in a six-hour candle since February 26. Bitcoin’s breakout on Apr 2 also occurred with above-average volume.
This could be a sign that XRP’s breakout was valid.
April Price Prediction And Summary
XRP had been trading inside an ascending triangle for 107 days before the Apr 2 breakout.
In the graph below, the green arrow is the height of the triangle:
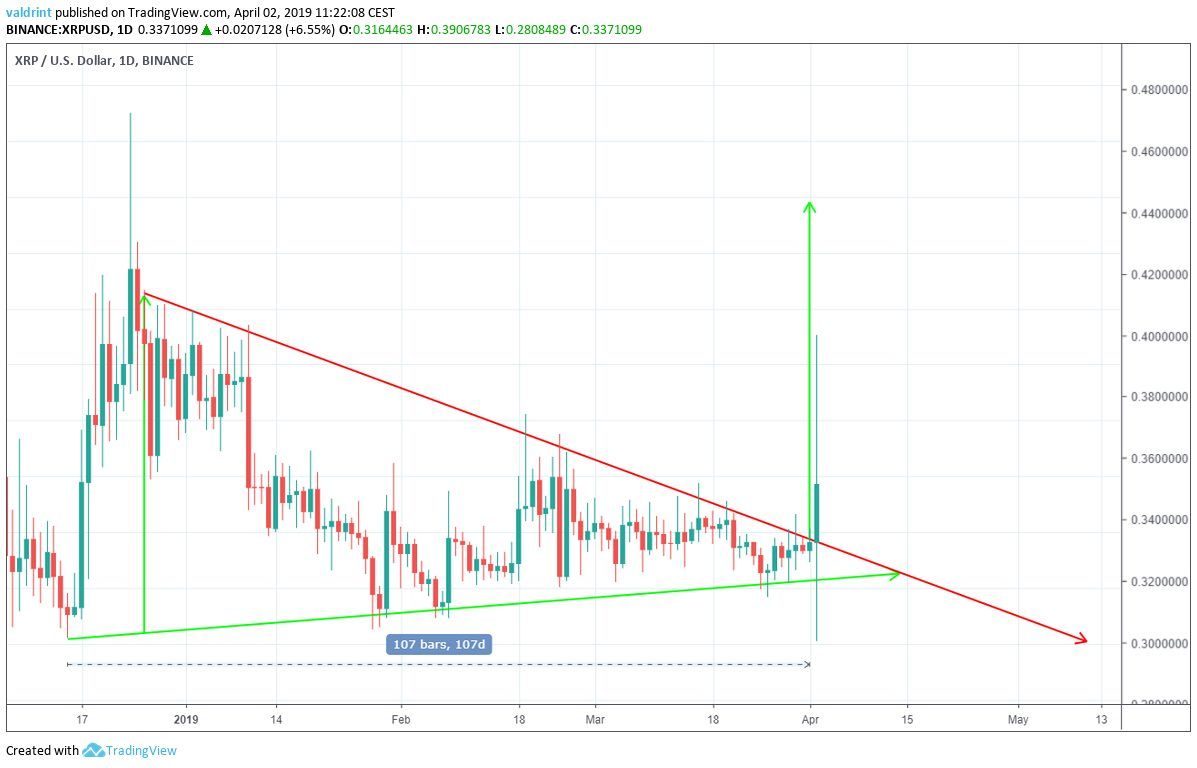
Copying the distance to the point of the breakout, we get a price of $0.44 for the possible top of the current upward move.
However, it is possible that the price will drop and validate the resistance line before continuing its upward move.
Furthermore, the price has not cleared long-term moving averages yet. Before price increases continue, another strong upward move is required.

In addition, we believe it is likely that the price will trade between $0.3 and $0.44 in April. However, the characteristics of the breakout and position of long-term MAs lead us to also believe that XRP will likely consolidate around $0.3-$0.36 before the end of the month.
Do you think the price of XRP will move above its long-term moving averages? When will that happen? Let us know your thoughts in the comments below!
Disclaimer: This article is not trading advice and should not be construed as such. Always consult a trained financial professional before investing in cryptocurrencies, as the market is particularly volatile.


