


The Dogecoin (DOGE) price reached a new yearly high on December 11 but fell sharply afterward.
Despite the decrease, the DOGE price still trades inside a critical support area. Will it be able to bounce?
Dogecoin Nearly Reaches Long-Term Resistance
The technical analysis from the weekly time frame shows that the DOGE price had followed a descending resistance trend line since its all-time high in May 2021. After several unsuccessful attempts (red icons), DOGE broke out from the long-term trend line in October 2023.
Even though the price broke out, it has not yet reached the main horizontal resistance area.
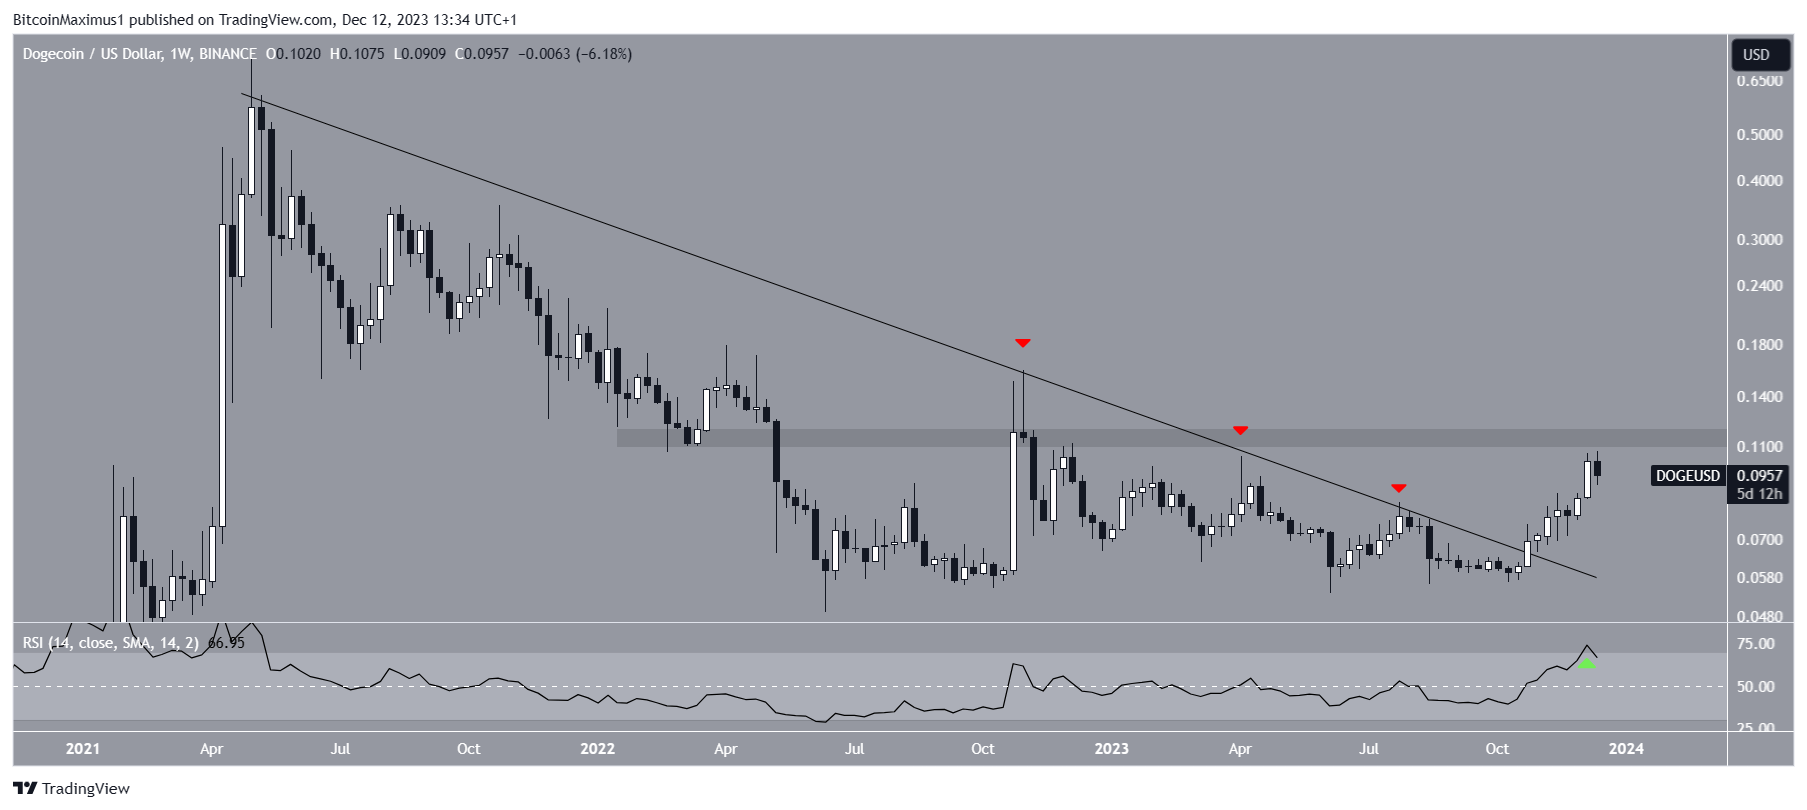
With the RSI as a momentum indicator, traders can determine whether a market is overbought or oversold and decide whether to accumulate or sell an asset. Bulls have an advantage if the RSI reading is above 50 and the trend is upward, but if the reading is below 50, the opposite is true.
The weekly RSI is increasing and is above 50, both positive signs. Additionally, the indicator just crossed into overbought territory (green icon).
DOGE Price Prediction: Breakout or Deviation?
The technical analysis of the daily time frame shows that the DOGE price broke out from the main horizontal resistance area at $0.095. This led to the new Dogecoin price yearly high of $0.107 yesterday, which was incrementally above the previous yearly high of $0.105.
Despite the yearly high, the DOGE price created a bearish candlestick (red icon) and fell significantly yesterday. Nevertheless, the DOGE price still trades inside the $0.095 support area.
Read More: 9 Best Crypto Demo Accounts For Trading
The daily RSI gives a mixed reading. On the bullish side, the indicator broke out from its bearish divergence trend line (green). However, it then fell from its overbought territory and is decreasing.
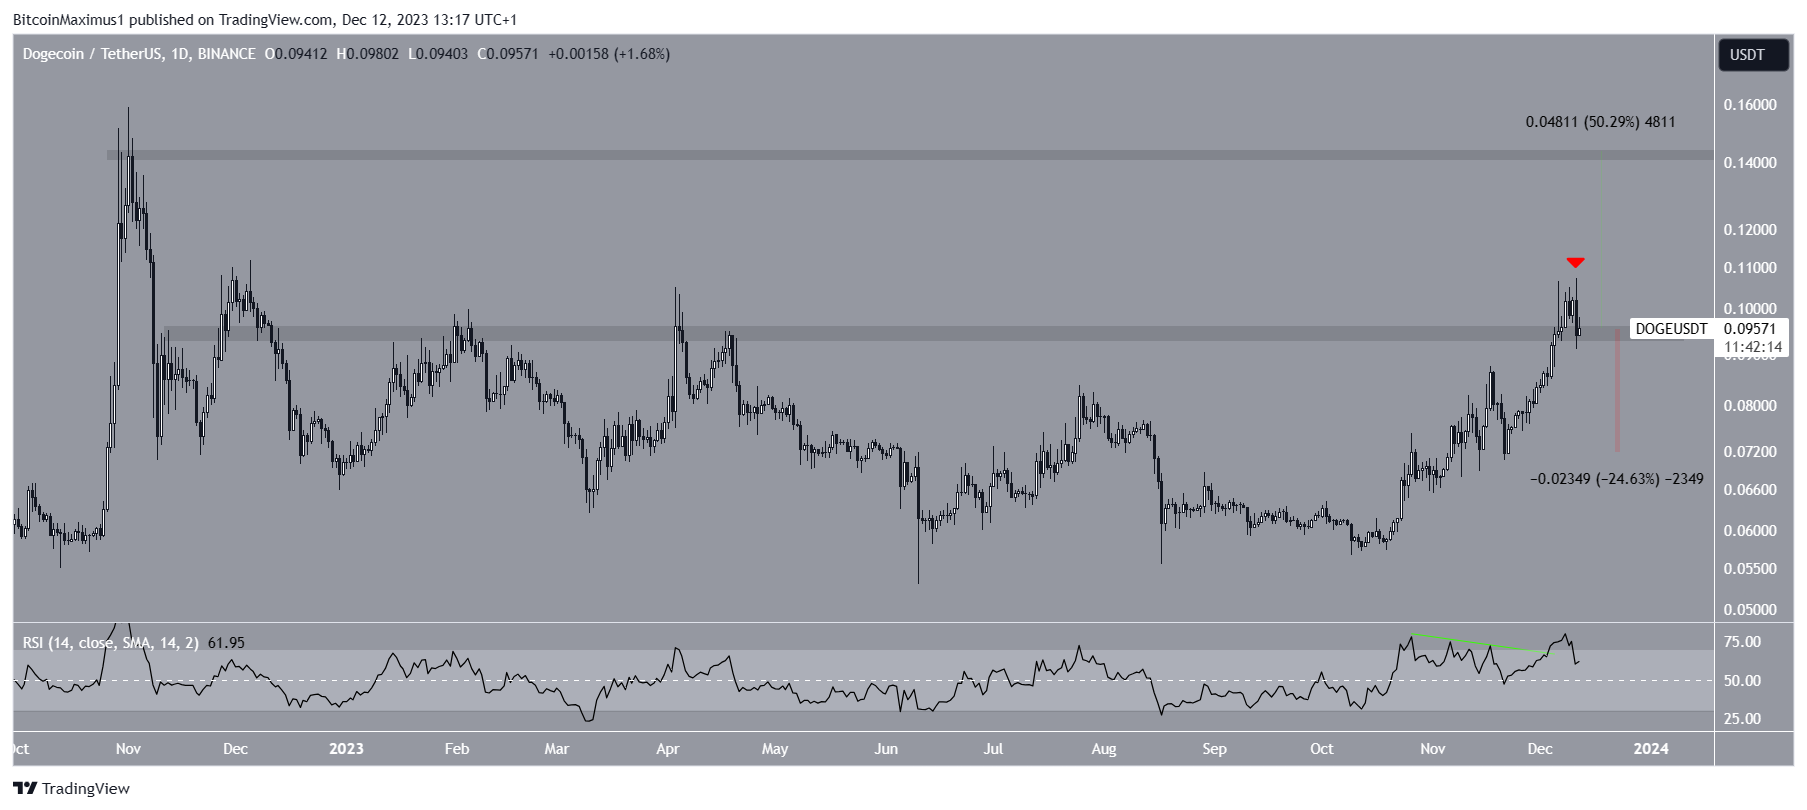
As a result of these mixed readings, whether the DOGE price bounces at $0.095 or gets rejected will determine the future trend. A successful bounce can lead to a 50% increase to the next resistance at $0.145, while a rejection can lead to a 25% drop to $0.072.
For BeInCrypto’s latest crypto market analysis, click here.


