Fantom (FTM), currently transitioning to Sonic (S), is one of today’s top market gainers, with its price rising by 8% in the last 24 hours.
As FTM climbs, indicators point to the potential for even greater gains. This analysis outlines the factors driving the token’s rise, key resistance levels to watch, and the potential benefits for investors.
Fantom Plan to Put Worried Holders Out of Pain
As of this writing, Fantom’s price is $0.75, meaning 53% of the total FTM holders are now in profits. However, according to the Global In/Out of Money (GIOM) Around Price, holders who are currently out of money might soon gain from the price appreciation.
The GIOM classifies addresses based on those making money at the break-even point and those in losses at the current price. Using an average on-chain cost basis, the indicator can tell how much volume can become profitable or otherwise, depending on the price action.
Also, the larger the clusters, the stronger the support or resistance. According to IntoTheBlock, about 25,230 addresses that accumulated FTM between $0.94 and $1.50 are currently holding over 100 million tokens at a loss.
Read more: How to Add Fantom to MetaMask: A Step-by-Step Guide

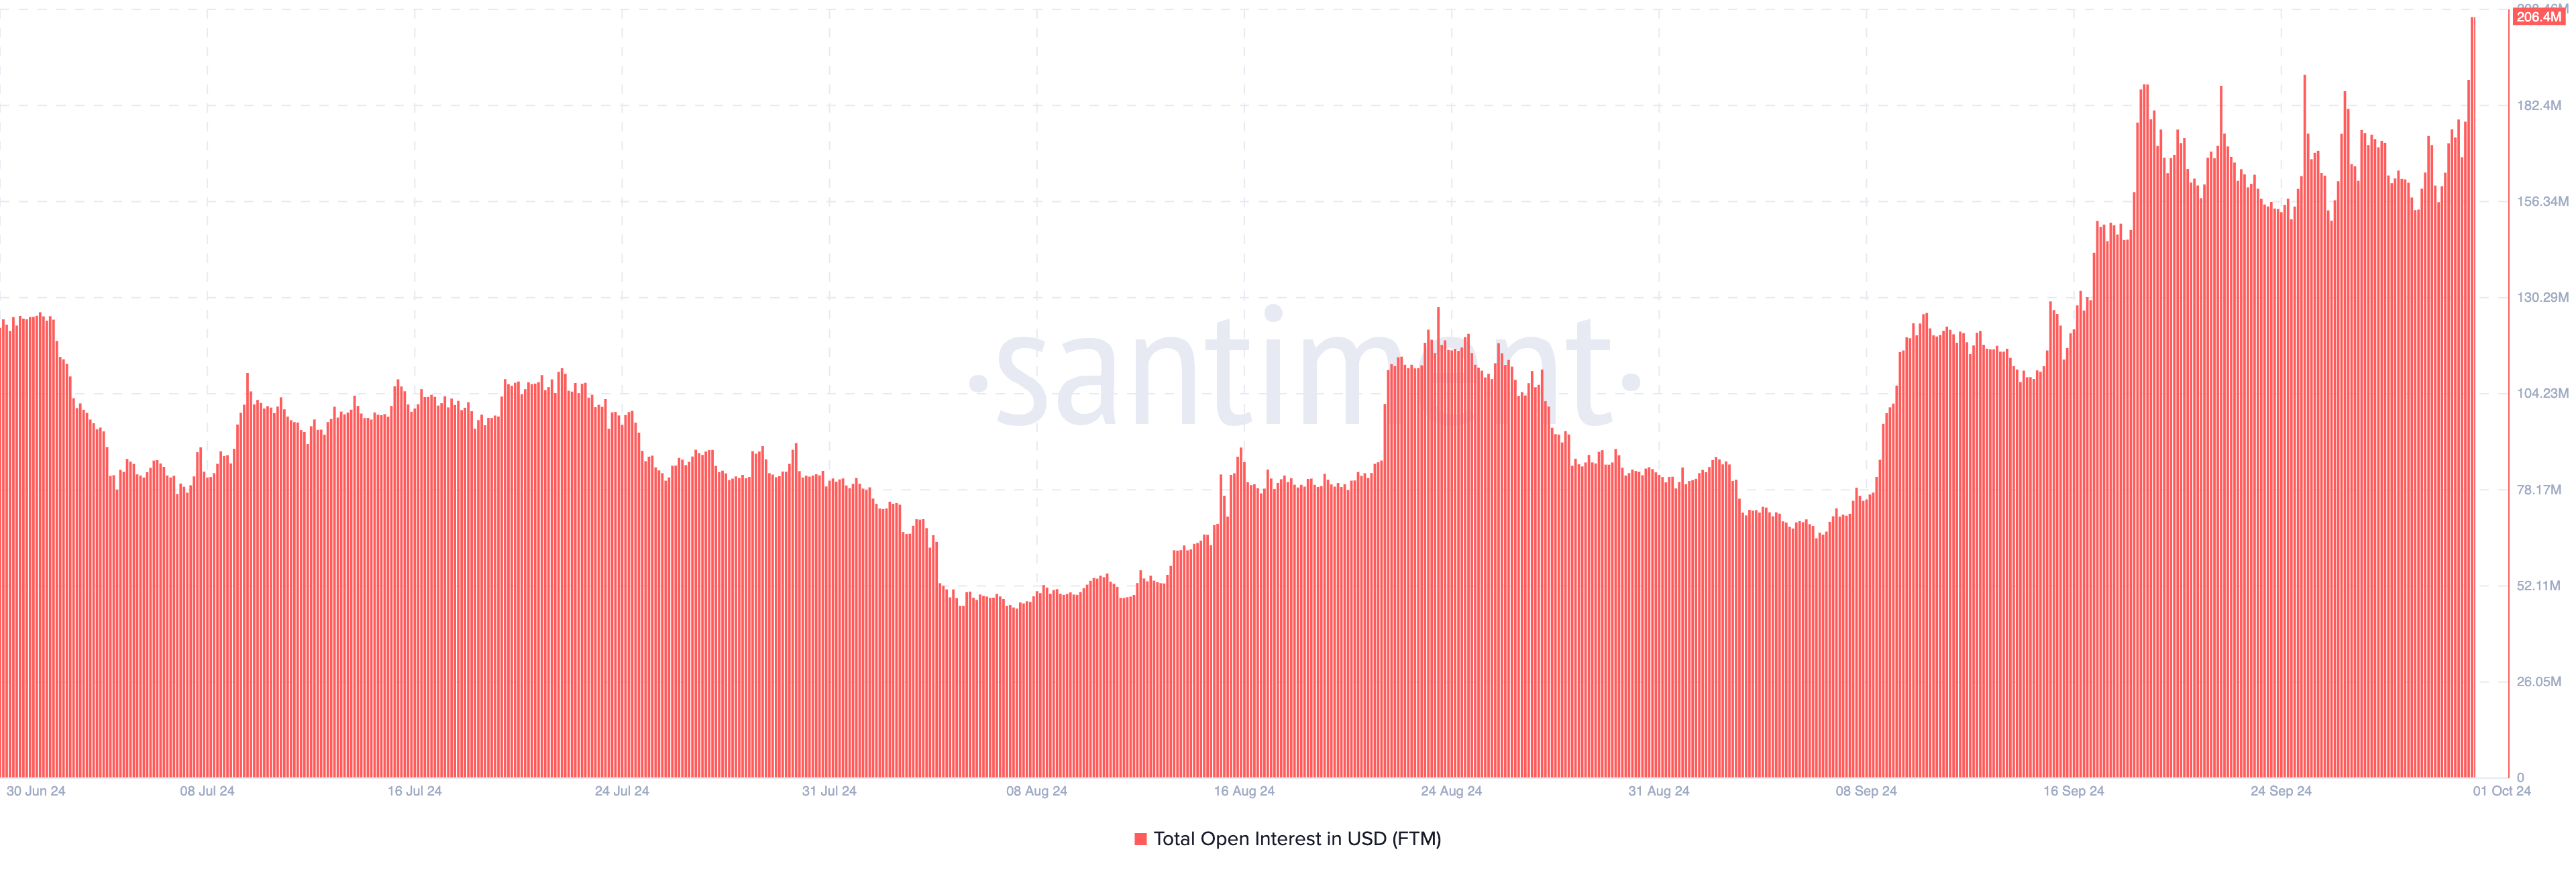
However, with strong support of around $0.75, these addresses might soon be in the money, indicating that the volume in these regions could soon be valued at $75 million. Fantom’s Open Interest has also increased, suggesting that more money is flowing into FTM-related contracts.
Historically, whenever this happens when FTM’s price increases, the uptrend becomes stronger. Thus, it is likely that the token’s uptrend might continue, and FTM’s price could close in on the $1 mark.

Interestingly, crypto trader Ansem also seems to align with the bullish bias. The trader, who has 503,900 followers on X, noted that the last quarter was for accumulation, while this new one will see FTM price trade much higher.
“FTM price action is a good indicator of the different regimes we are in now. March-> July: alts down only [-70-80%]. July -> September: sideways accumulation. currently, continuation without high timeframe retests is usually the beginning of aggro trend,” Ansem wrote.
FTM Price Prediction: Higher Values Only
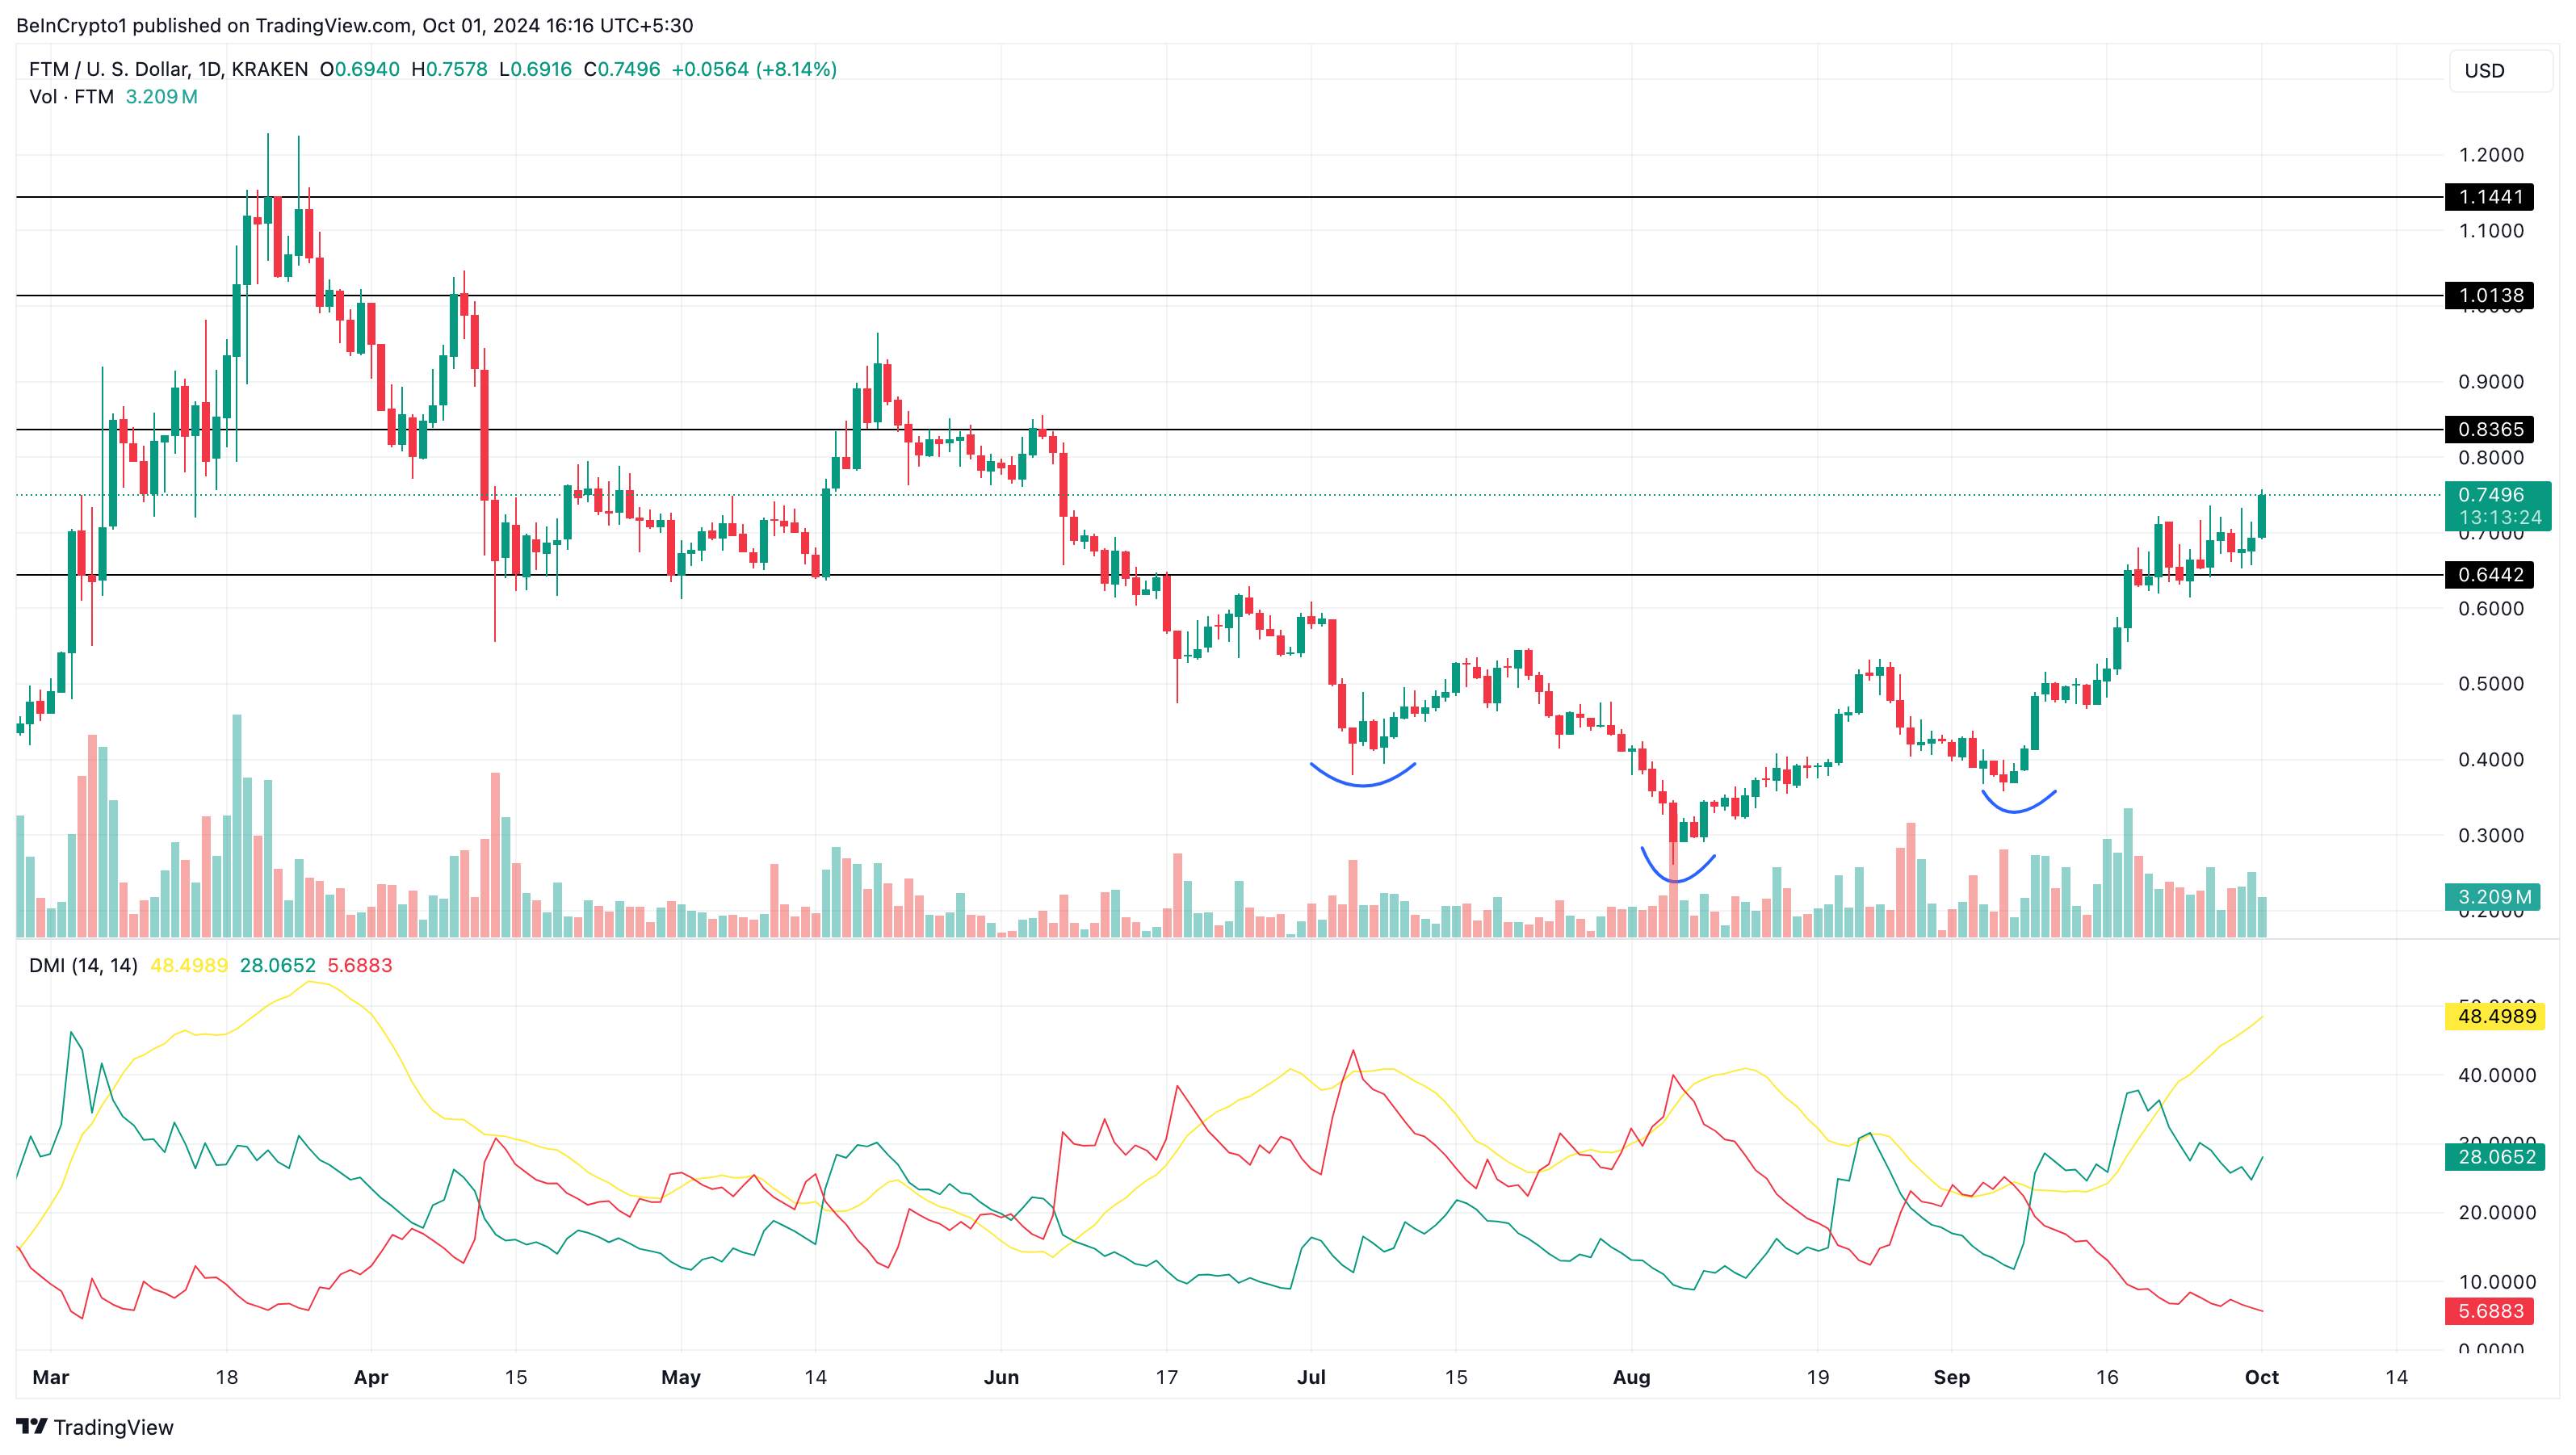
On the daily chart, FTM’s price increased after a bullish inverse head-and-shoulders pattern formed. Currently trading at $0.75, BeInCrypto examined the Directional Movement Index (DMI) to support the continuation of the altcoin’s uptrend.
As the name implies, the DMI measures a cryptocurrency’s trend. At press time, the DMI (red) was down to 5.68, which indicates that sellers are not in control. On the other hand, the DMI (green) was higher at 2.08.
In addition, the Average Directional Index (ADX), which measures directional strength, has increased. At press time, the ADX (yellow) is 48.49, suggesting that Fantom’s price might continue to move up.
Read more: 9 Best Fantom (FTM) Wallets in 2024

If validated, FTM’s price might surpass the $0.84 resistance in the short term. If that is the case, the altcoin’s next move could be to $1.01 and possibly $1.14. However, the token could pull back if the FTM holder’s book profits in large volume. If that happens, FTM could decline to $1.14.
Disclaimer
In line with the Trust Project guidelines, this price analysis article is for informational purposes only and should not be considered financial or investment advice. BeInCrypto is committed to accurate, unbiased reporting, but market conditions are subject to change without notice. Always conduct your own research and consult with a professional before making any financial decisions. Please note that our Terms and Conditions, Privacy Policy, and Disclaimers have been updated.


