


Despite a bullish reversal in 2023, the Fantom (FTM) price is struggling to move above the $0.41 resistance area. A pullback may occur before the upward movement resumes.
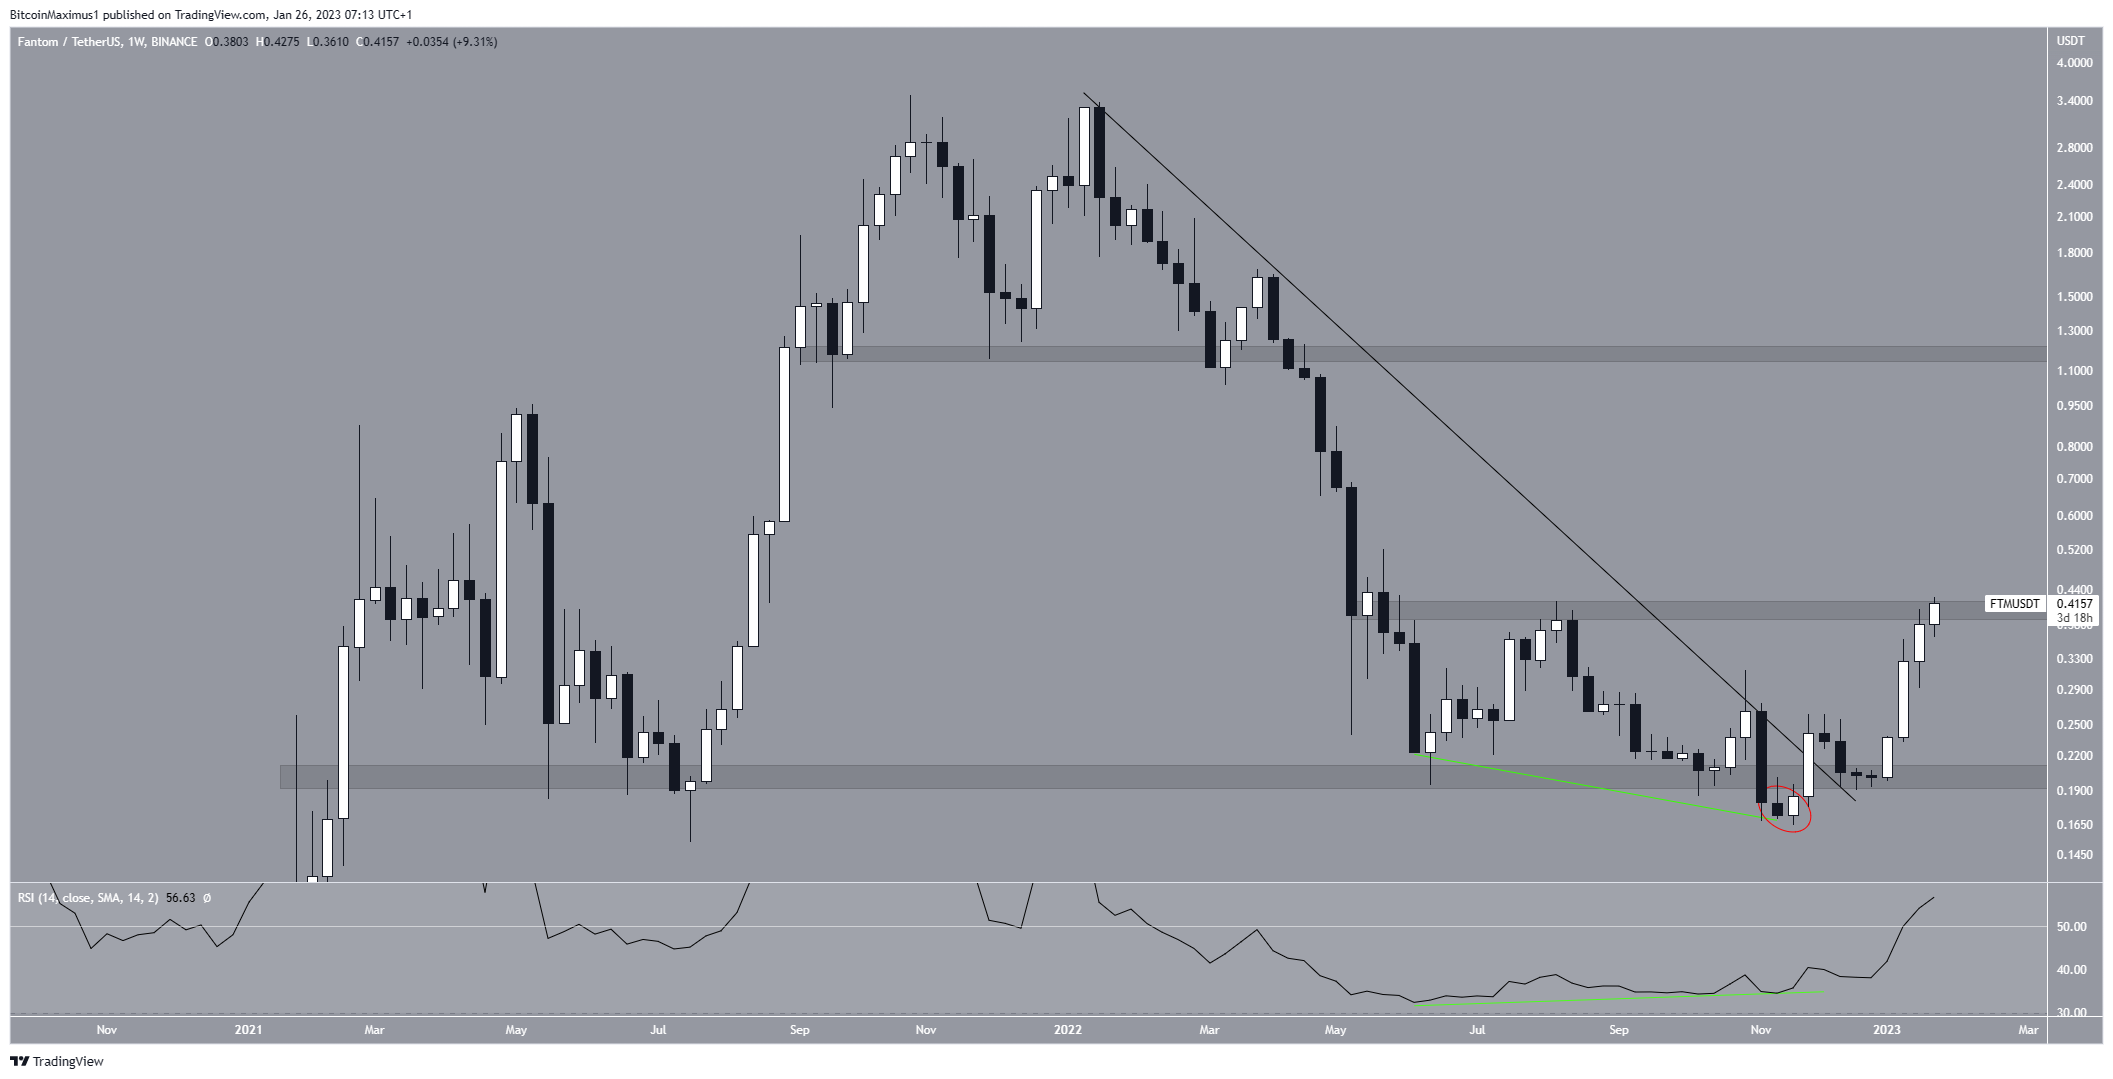
FTM is the native token of the Fantom network, a smart contract platform created as an alternative to Ethereum. The weekly time frame shows that Fantom price has decreased under a long-term descending resistance line since the beginning of 2022.
At the beginning of Nov., it broke down from the long-term $0.20 horizontal support area. However, it reclaimed the area shortly afterward, confirming that the breakdown was not legitimate (red circle).
Next, the Fantom price broke out from the descending resistance line and validated it and the resistance line as support. The price has increased since, and it is trading inside the resistance area at an average price of $0.41.
Due to the lack of overhead resistance, a breakout above could accelerate the increase toward the $1.20 resistance level. Since the weekly RSI has confirmed the bullish divergence and moved above 50, a breakout would be the most likely scenario.
On the other hand, if the Fantom price gets rejected instead, the future price could fall back to the $0.20 horizontal area, which is now expected to provide support.
Fantom Price Prediction for Feb: Pullback Before Breakout?
The technical analysis from the daily time frame reiterates the bullish outlook from the weekly one and provides a bullish Fantom price prediction for Feb. There are two main reasons for this:
Firstly, the FTM price broke out from a descending resistance line (dashed) on Jan. 7. It accelerated its rate of increase afterward.
Next, the price broke out from an ascending parallel channel on Jan. 14 and validated it as support five days later (green icon). This is a sign that the upward movement is impulsive.
Over the past 24 hours, the Fantom price has been attempting to break out from the $0.41 resistance area while the daily RSI generated bearish divergence (green line).
As a result, the FTM price may fall toward the channel’s resistance line, which is currently at $0.34. Afterward, the previously outlined upward movement can continue.
A daily close above the $0.41 resistance area would mean that the retracement will not occur at all, rather FTM will pump to $1.20.
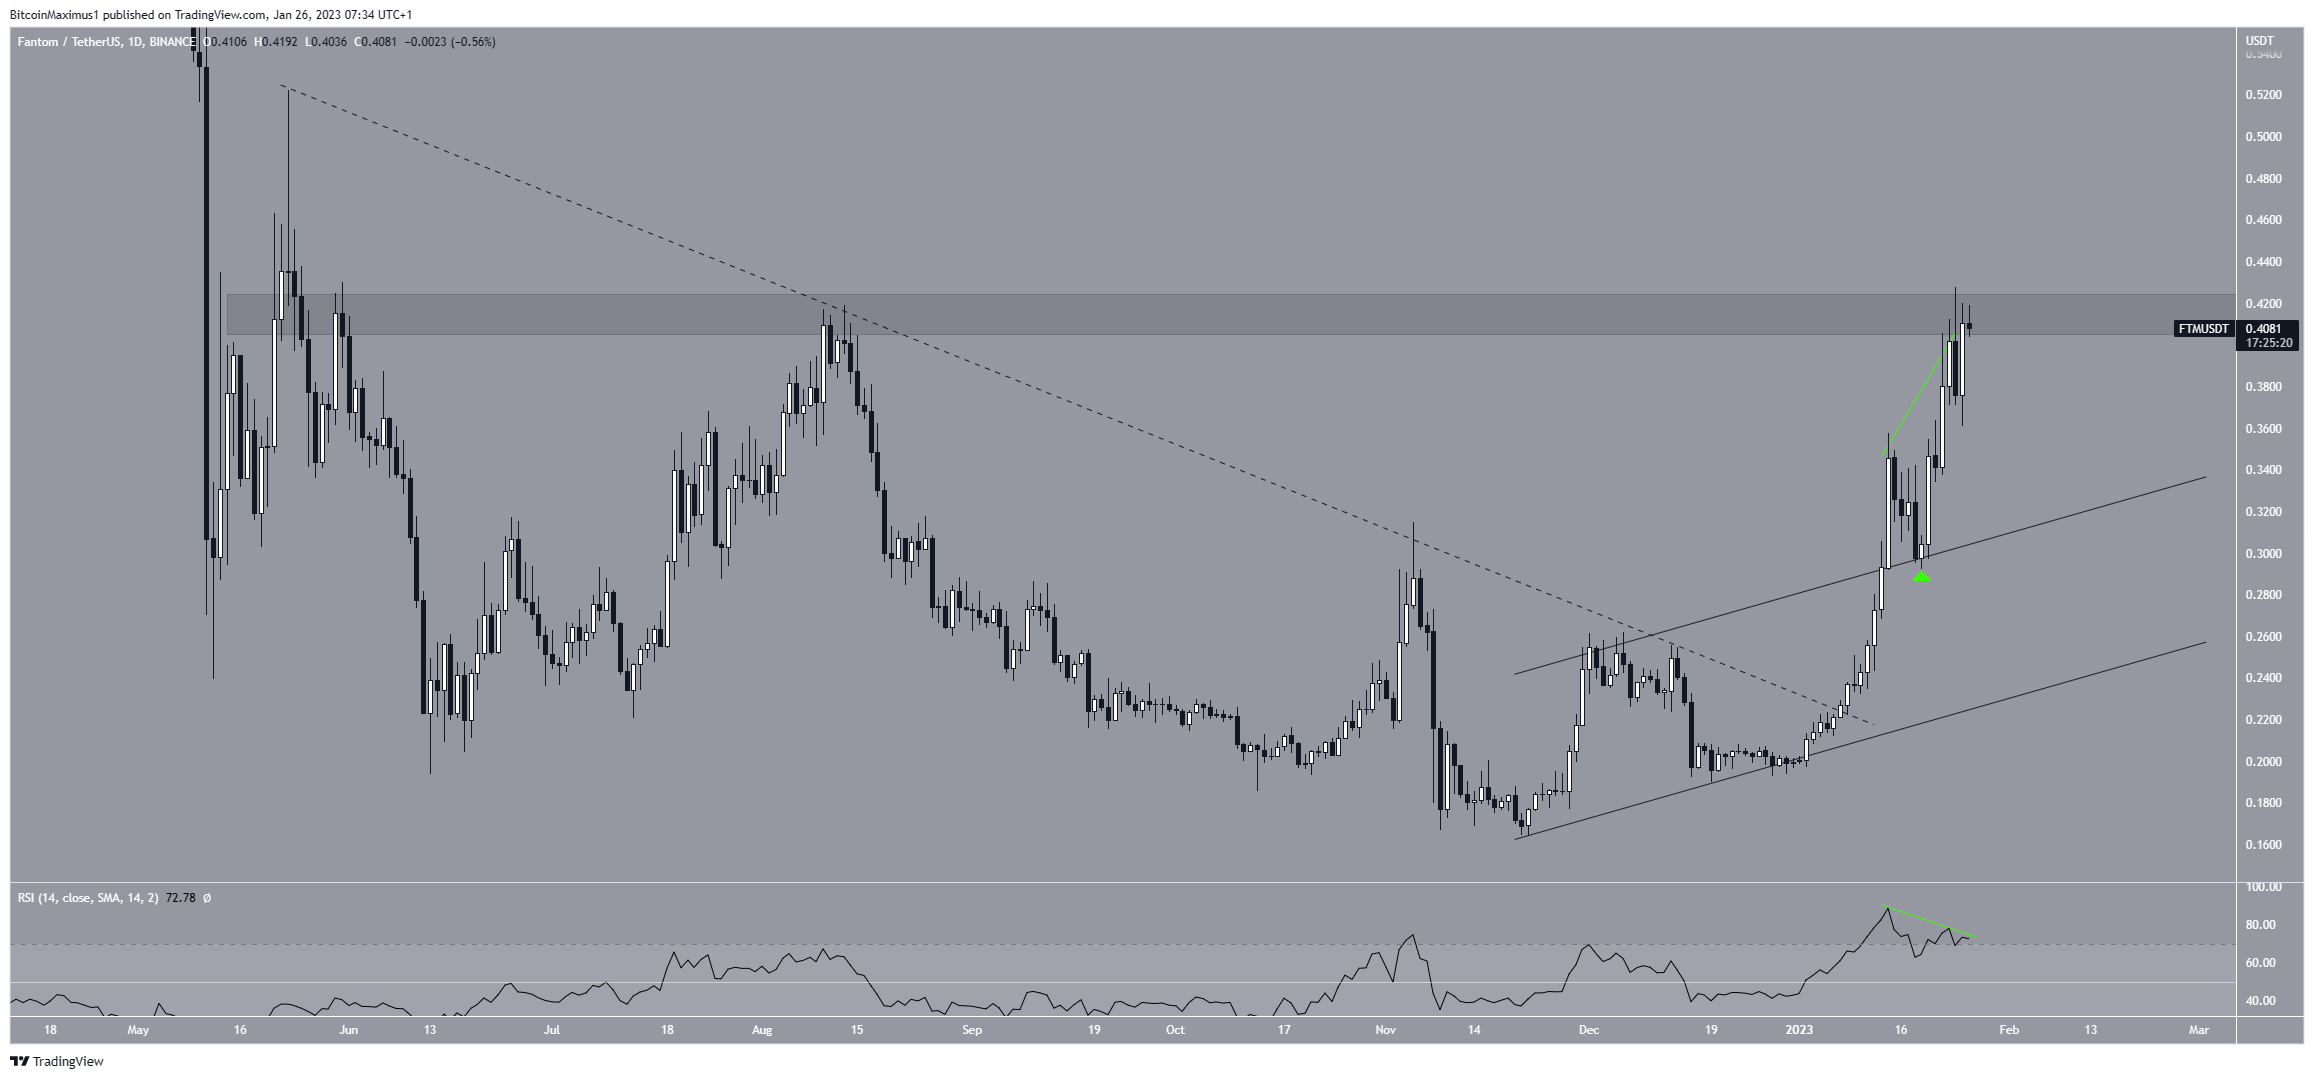
To conclude, the most likely Fantom price analysis is a fall toward $0.34 before the upward movement resumes. A daily close above $0.41 would instead indicate that the upward movement will continue without a setback.
For BeInCrypto’s latest crypto market analysis, click here.


