


The Ethereum (ETH) price trades inside an important horizontal area previously providing resistance.
ETH also trades inside a confluence of short-term support levels, which can be key in determining the future trend.
Ethereum Falls to Channel’s Support
The technical analysis of the daily time frame shows that the ETH price has traded inside an ascending parallel channel for the past 95 days. The upward movement led to a high of $2,717 on January 12. The high validated the channel’s resistance trend line (red icon).
However, Ethereum has fallen since and trades close to the pattern’s support trend line. Currently, ETH trades inside an important horizontal area that previously provided resistance. A bounce would validate it as support.
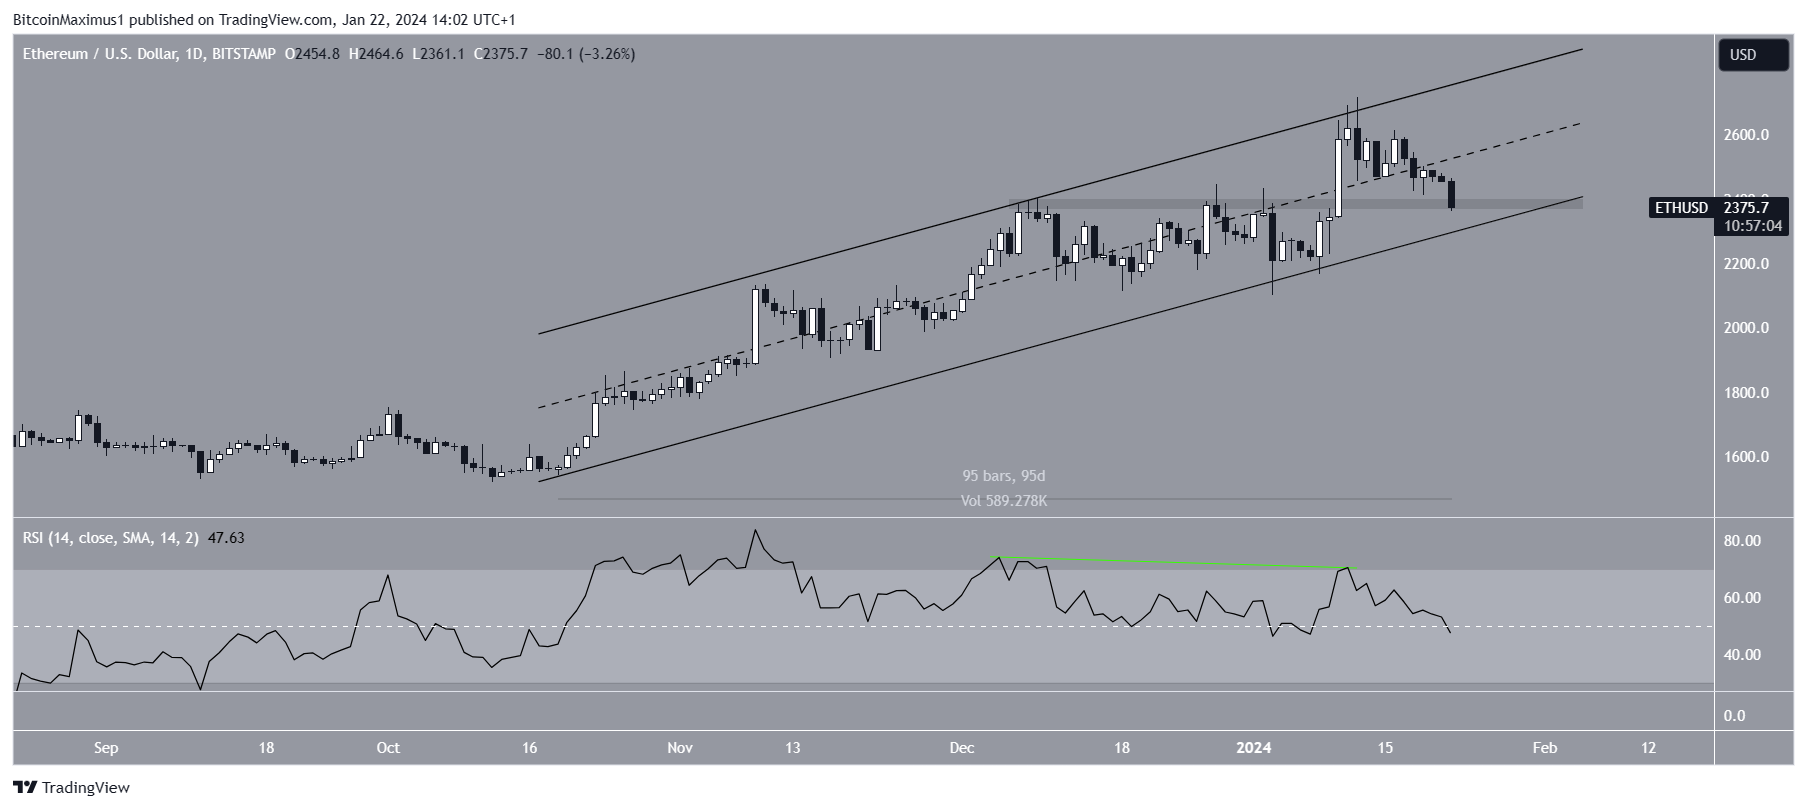
The daily Relative Strength Index (RSI) is bearish. When evaluating market conditions, traders use the RSI as a momentum indicator to determine whether a market is overbought or oversold and whether to accumulate or sell an asset.
If the RSI reading is above 50 and the trend is upward, bulls still have an advantage, but if the reading is below 50, the opposite is true. The RSI generated a bearish divergence before the drop (green) and is now below 50 (red icon), both signs of a bearish trend.
Read More: What Is Wrapped Ethereum (WETH)?
What do Analysts Say?
Despite the ongoing decrease, cryptocurrency traders and analysts on X have a bullish view of the Ethereum price.
MuroCrypto said he is longing ETH with a target of $2,700.
TheCryptomist believes that an ETH bounce can kickstart altseason. She tweeted:
Where others are scared, I am excited!! We have hit my support level from last week. Perhaps smaller TF chop present here. Should we bounce .. it is ALT SEASON
Finally, VellaCryptoX suggests the price will increase toward $2,800.
Read More: How To Buy Ethereum (ETH)
ETH Price Prediction: Is the Bottom Close?
While the daily time frame is bearish, the four-hour chart suggests a bounce could occur. This is because of the price action and RSI readings.
The price action shows that ETH bounced at the support trend line of an ascending parallel channel. This also coincides with the support trend line of a short-term descending wedge (white). The wedge is considered a bullish pattern.
Read More: What is the Ethereum Shanghai Upgrade?
Also, the four-hour RSI has moved outside its oversold territory after briefly falling below it today (green circle).
If the ETH price breaks out from its wedge, it can increase by 8% to the channel’s resistance trend line at $2,580. The trend line also coincides with the 0.618 Fib retracement resistance level.
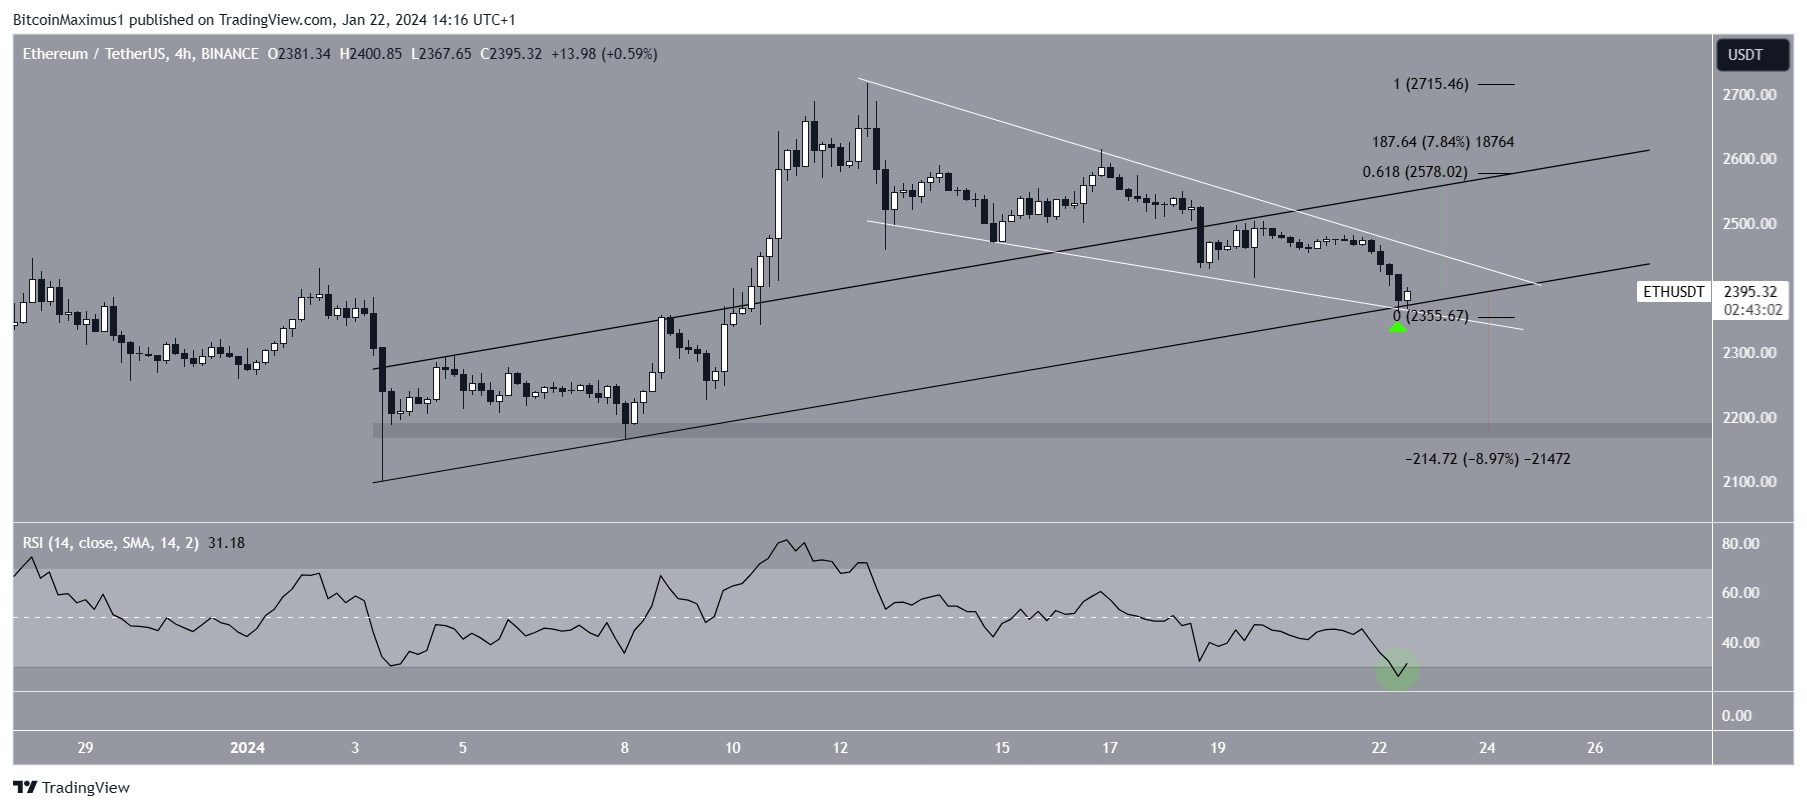
Despite this bullish ETH price prediction, a breakdown from the channel can trigger a 9% drop to the closest support at $2,170.
For BeInCrypto’s latest crypto market analysis, click here.


