


Ethereum (ETH) has reclaimed a short-term support level and in the process created its first higher low since June 18.
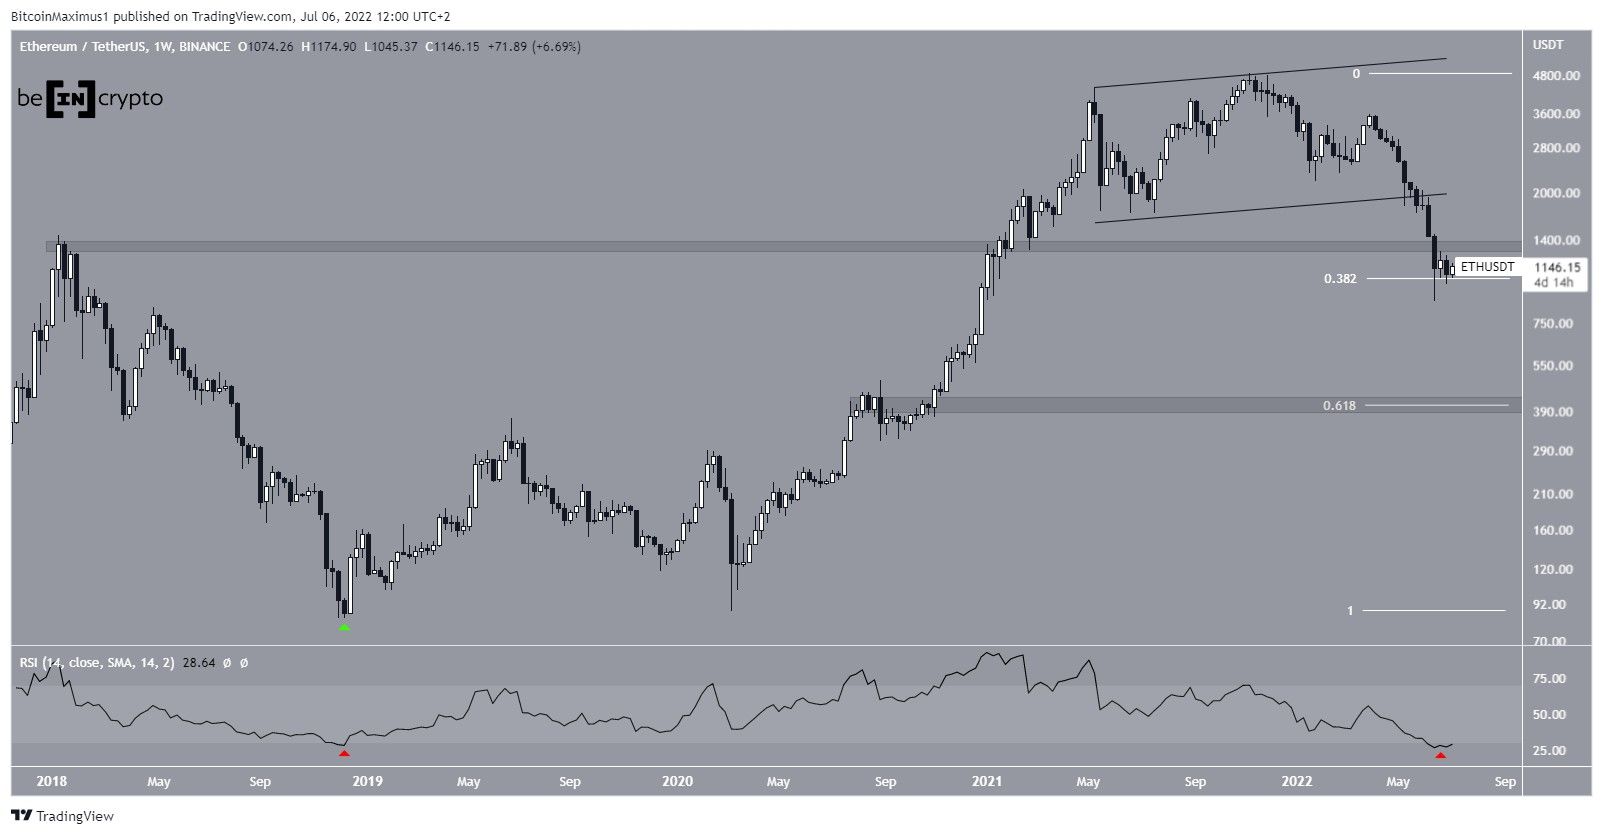
ETH has been falling since reaching an all-time high price of $4,868 in Nov. The downward movement caused a breakdown from a long-term ascending parallel channel, which had been in place since May 2021.
Afterward, the price resumed its downward movement until it reached a low of $881 on June 18. The low was made right at the 0.382 Fib retracement support level (white) when measuring the entire upward movement since Dec 2018.
However, it was also made below the $1,350 horizontal area, which previously acted as the all-time high in Dec 2017. The area is now expected to provide resistance once more.
Additionally, the weekly RSI reached a new all-time low of 26 (red icon). The only other time it came close to this reading was in Dec 2018 (green icon), when the bullish trend was just beginning.
Current ETH resistance
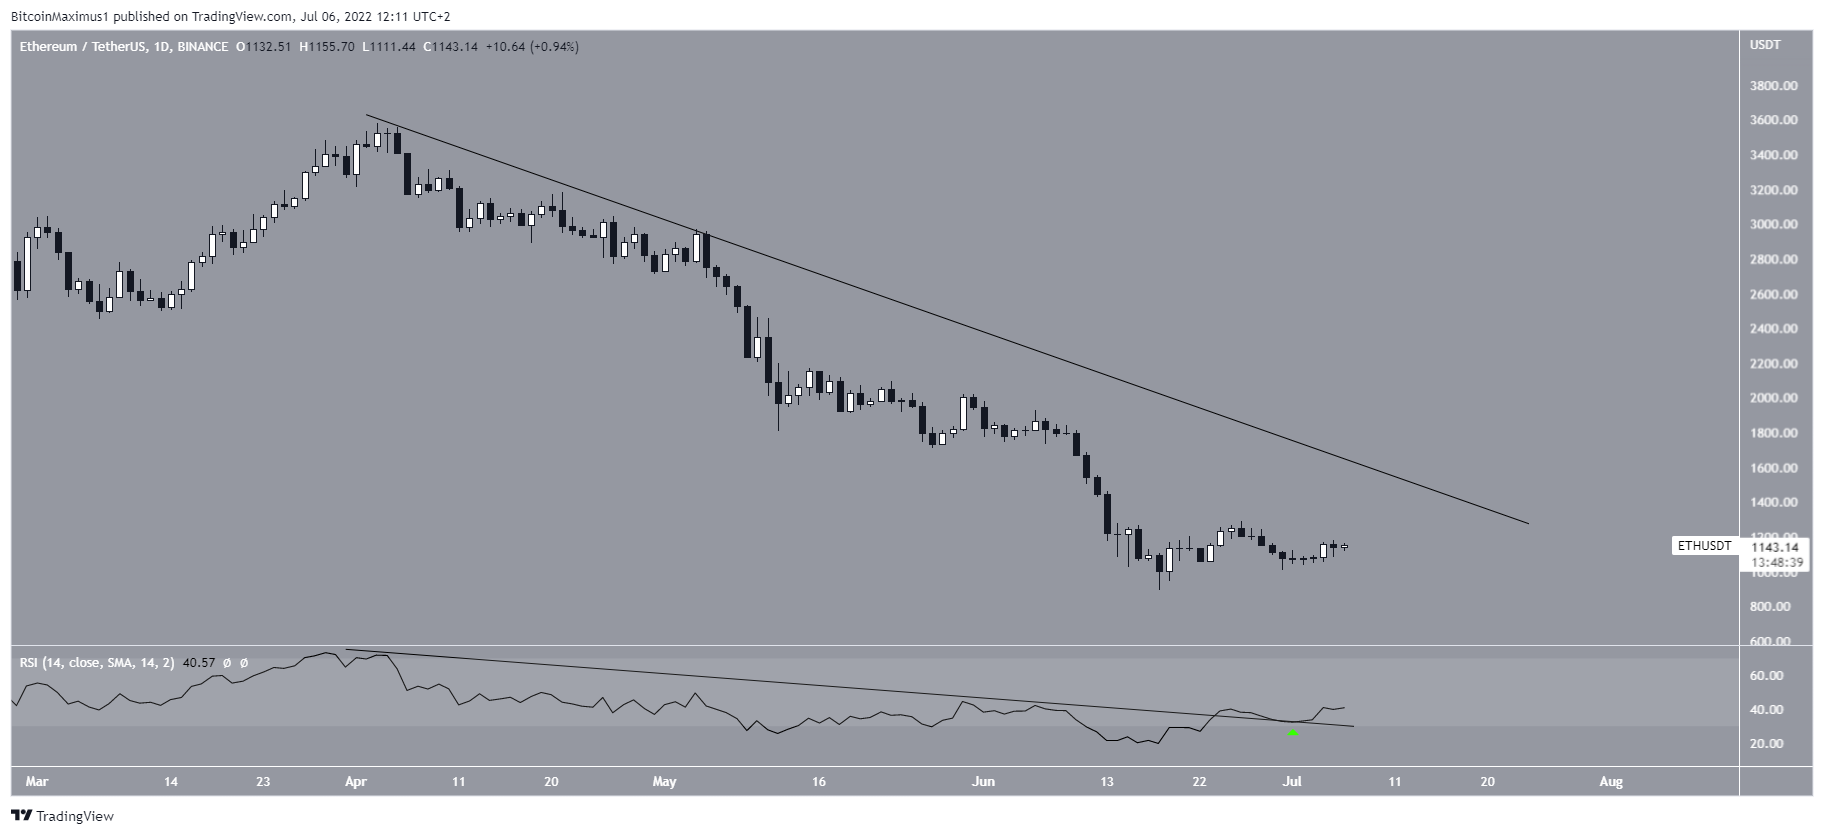
The daily chart shows that the price has been following a descending resistance line since the beginning of April. The line is currently at $1,250.
The RSI has broken out from this same trend line and validated it as support afterward (green icon). So, it is possible that the price will follow suit. An RSI increase above 50 would support this possibility.
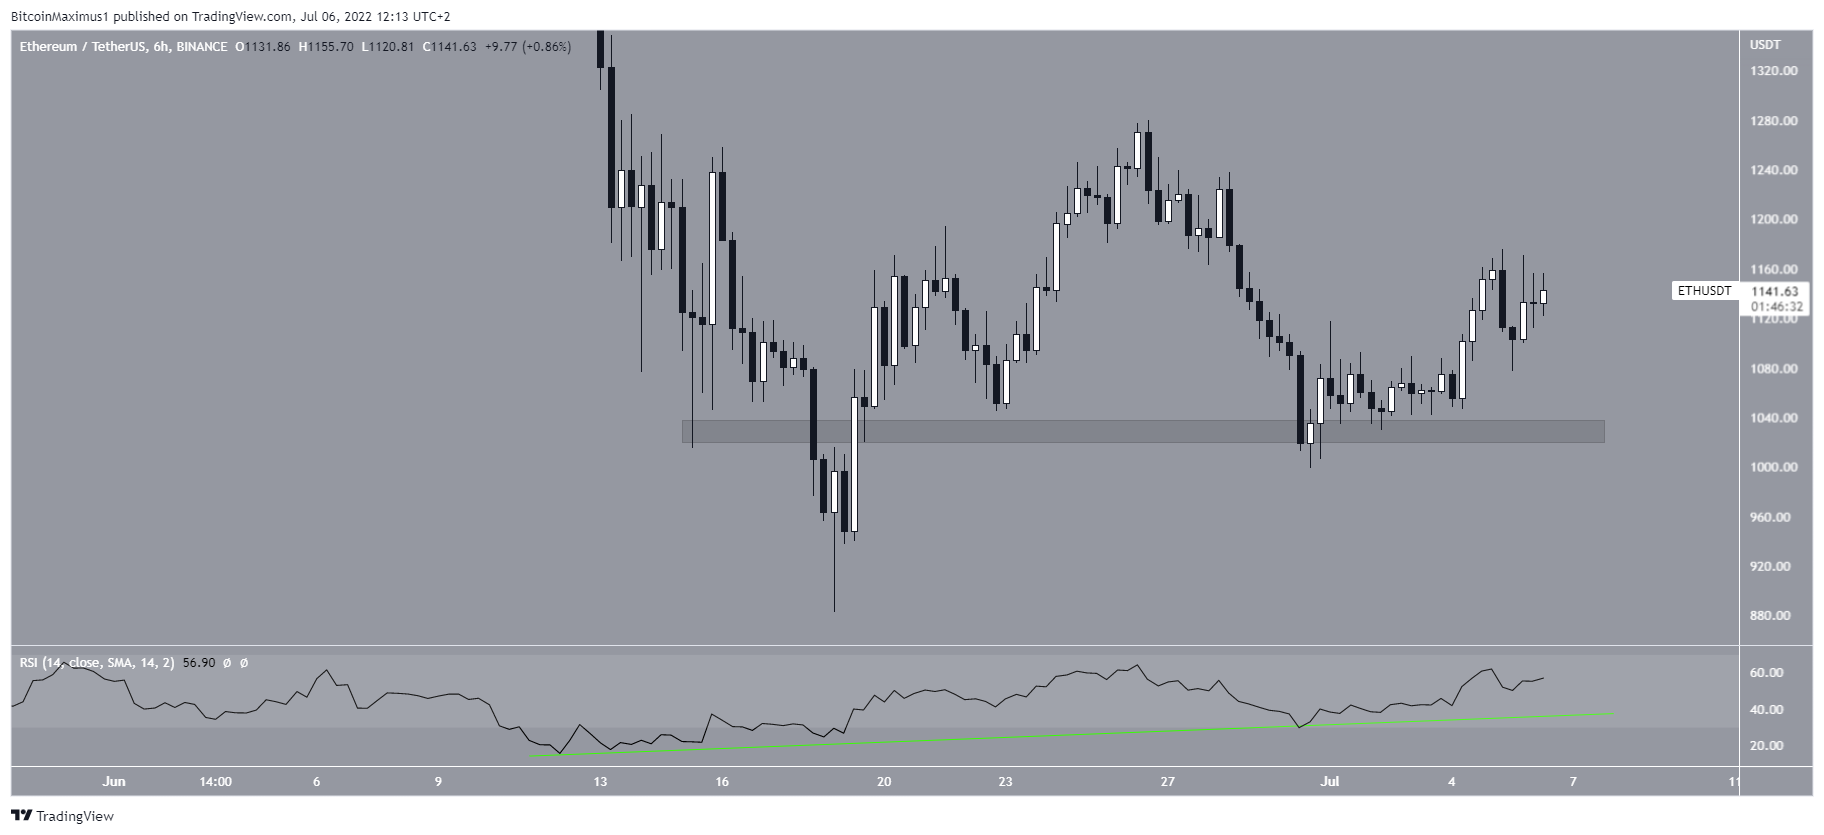
Finally, the six-hour chart provides a clearly bullish outlook. The two reasons for this are that the bullish divergence trend line in the RSI is still intact and that the price has made a higher low above the $1,040 horizontal support area.
This indicates that an upward movement towards at least the aforementioned descending resistance line is forthcoming.
Wave count analysis
The most likely wave count suggests that ETH completed its five-wave downward movement that began in March 2020 (white). Therefore, it is now in an A-B-C corrective structure. In it, waves A:C have had an exactly 1:1 ratio, which is the most common in such structures.
As for the longer-term movement, it is possible that the price is in the process of completing a fourth wave pullback (red).
Due to the length of the preceding upward movement and the current correction (black lines), it is not yet certain if the ongoing correction is complete or if it is just part one of a larger correction.
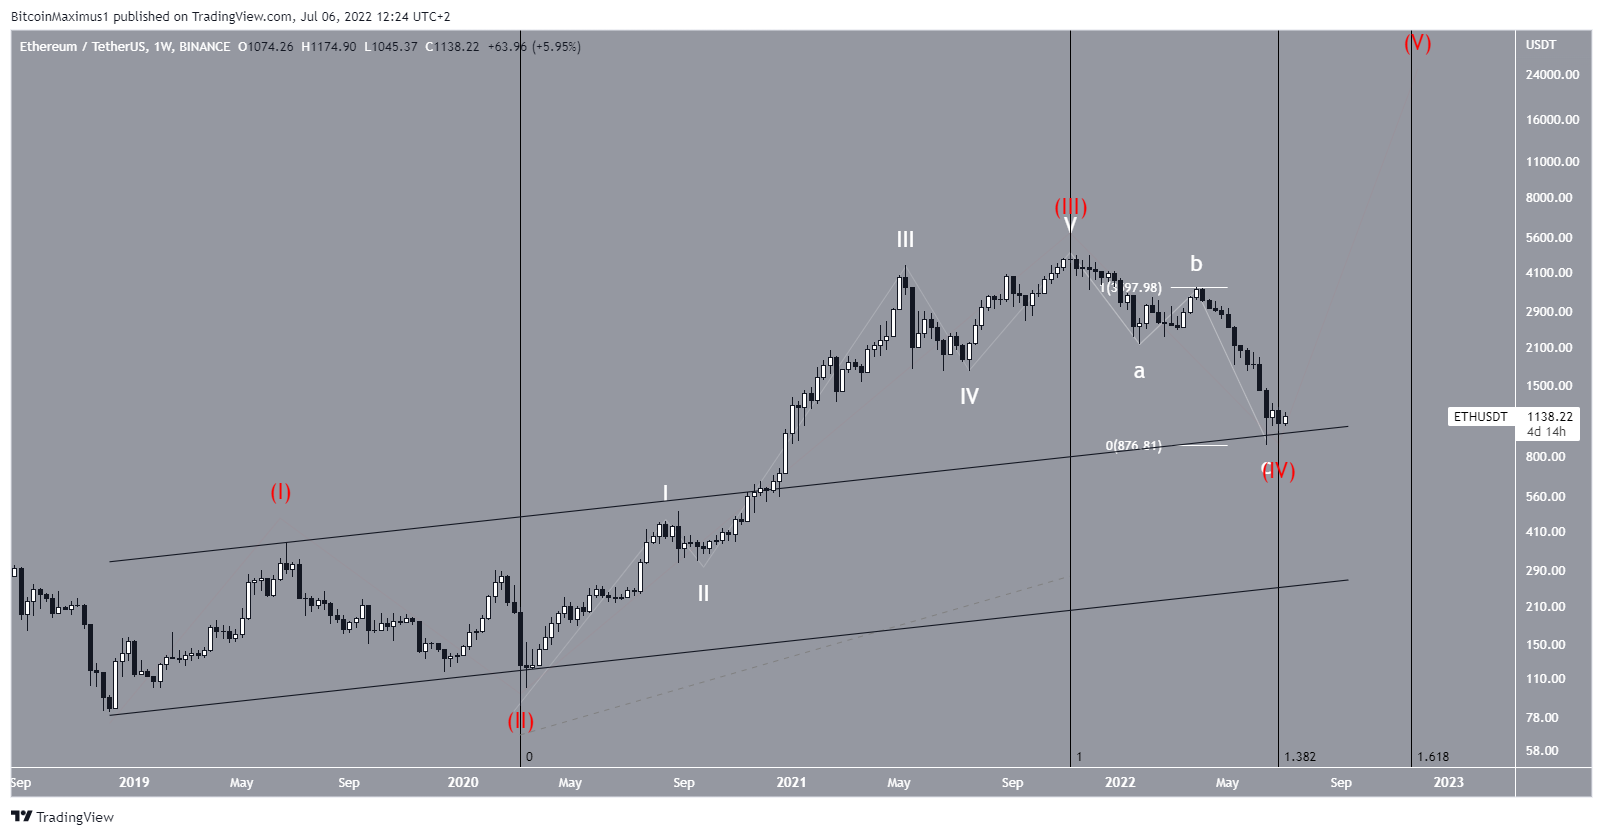
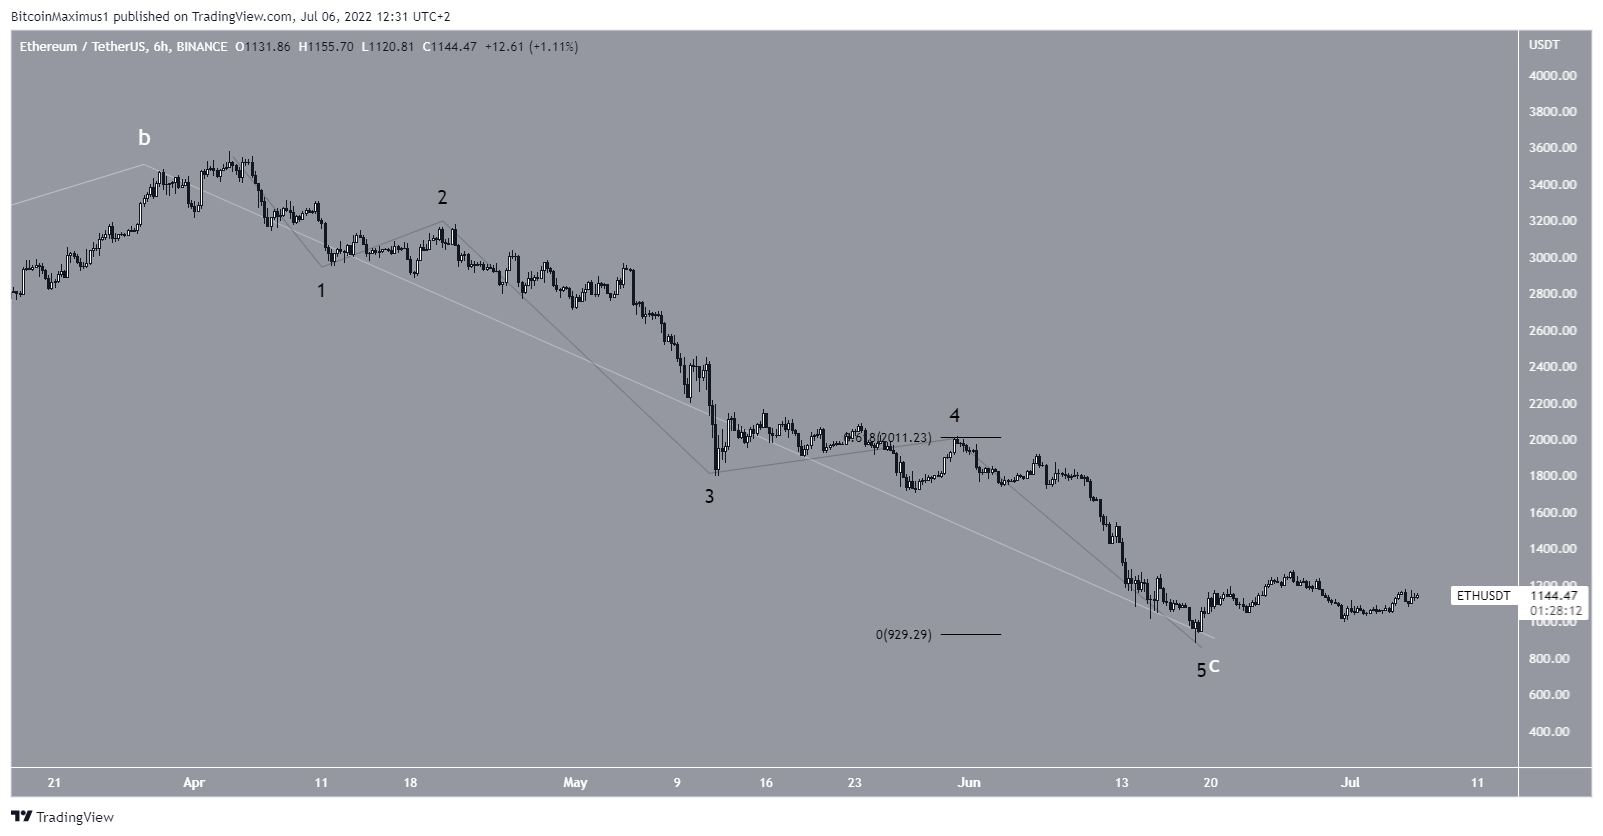
As for the shorter-term movement, ETH has completed a five-wave decrease, in which wave five had 0.618 the length of waves one and three.
Therefore, the short-term count is in alignment with the long-term one.
For Be[in]Crypto’s latest bitcoin (BTC) analysis, click here


