


Ethereum’s (ETH) price failed to sustain the increase that began on Sept. 12. The $1,650 horizontal resistance area rejected the price.
While the ETH/USD trend still seems bearish, the ETH/BTC analysis suggests that a bullish trend reversal is on the horizon.
Ethereum Price Fails to Reclaim Resistance
The Ethereum price analysis in the daily time frame provides a bearish reading for several reasons.
Firstly, the price broke down from an ascending support line that has been in place since November 2022. This is considered a bearish sign, meaning that the previous upward movement has ended.
The price action since the breakdown has also been bearish. During the decrease, ETH broke down from the $1,650 horizontal support area, which had been in place since June 2023.
Crypto investing, simplified. Get Ethereum (ETH) price predictions here.
Between Aug. 18 and Sept. 12, the daily RSI generated bullish divergence (green line). Traders utilize the RSI as a momentum indicator to assess whether a market is overbought or oversold.
If the RSI reading is above 50 and the trend is upward, bulls still have an advantage, but if the reading is below 50, the opposite is true. A bullish divergence occurs when a price decrease is combined with a momentum increase. It is a bullish sign that usually leads to price increases.
While this was the case for ETH, the price failed to reclaim the $1,650 area. Rather, the area rejected the price on Sept. 18 (red icon) and ETH has fallen since.
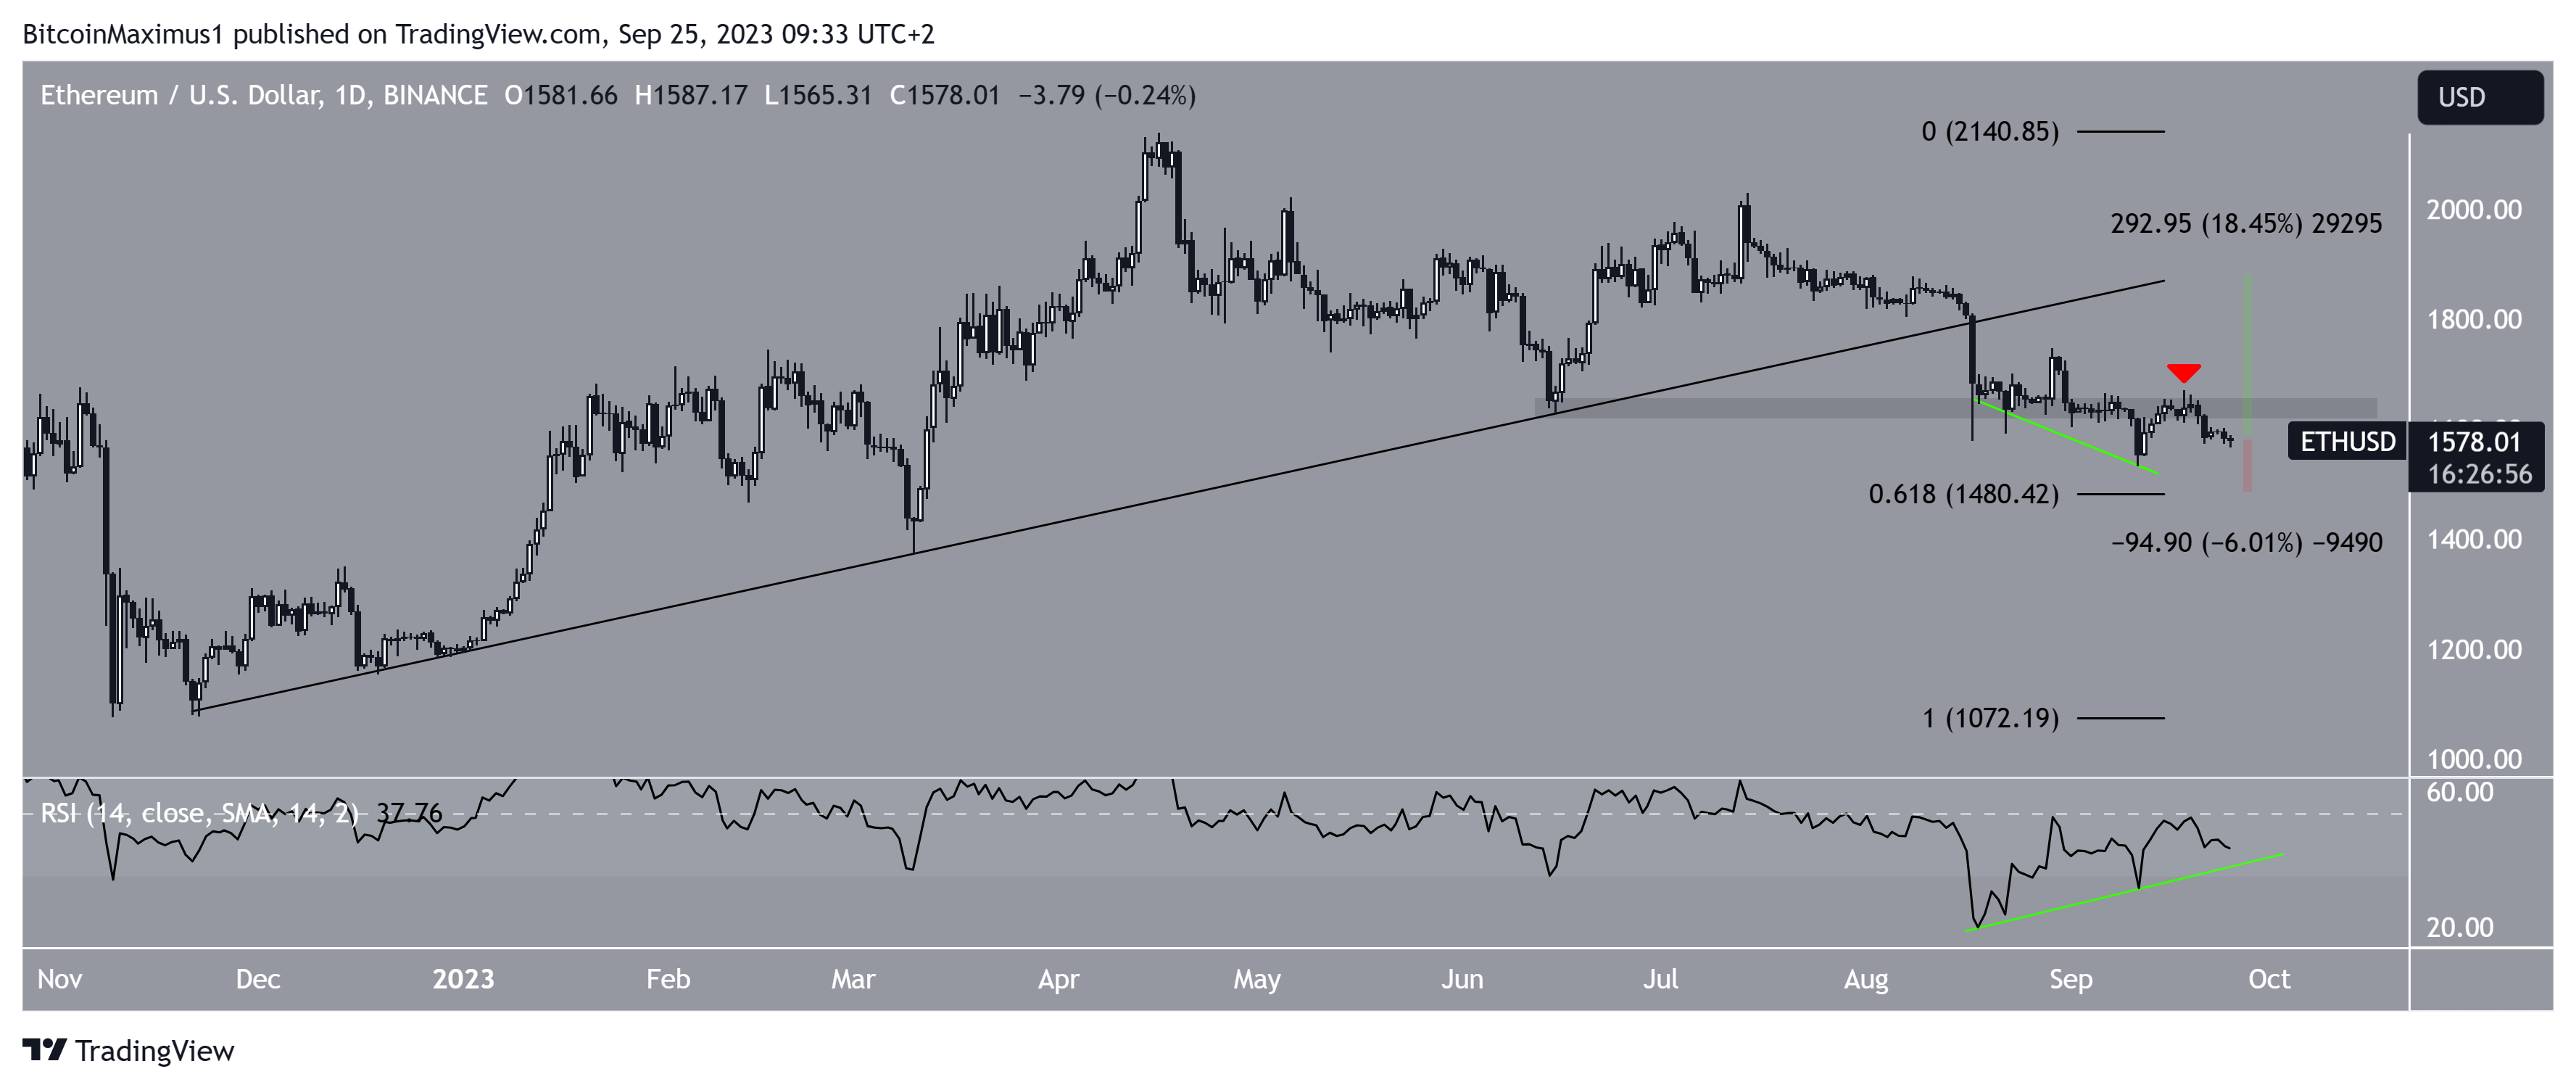
If the ongoing decrease continues, ETH can fall to the 0.618 Fib retracement support level at $1,480. However, if it reclaims the $1,650 area, a 20% increase to the previous ascending resistance line at $1,900 will be likely.
It is worth mentioning that Ethereum’s founder Vitalik Buterin has moved 400 ETH tokens to centralized exchanges. This could be a sign that he is planning to sell.
However, not all news are negative. Ethereum’s daily active addresses crossed 1 million, overtaking Bitcoin (BTC) in the process. Furthermore, Grayscale has filed an application for an Ethereum Exchange-Traded Fund (ETF).
Check out the 9 best AI crypto trading bots to maximize your profits.
Will Ethereum Reverse Trend Against Bitcoin?
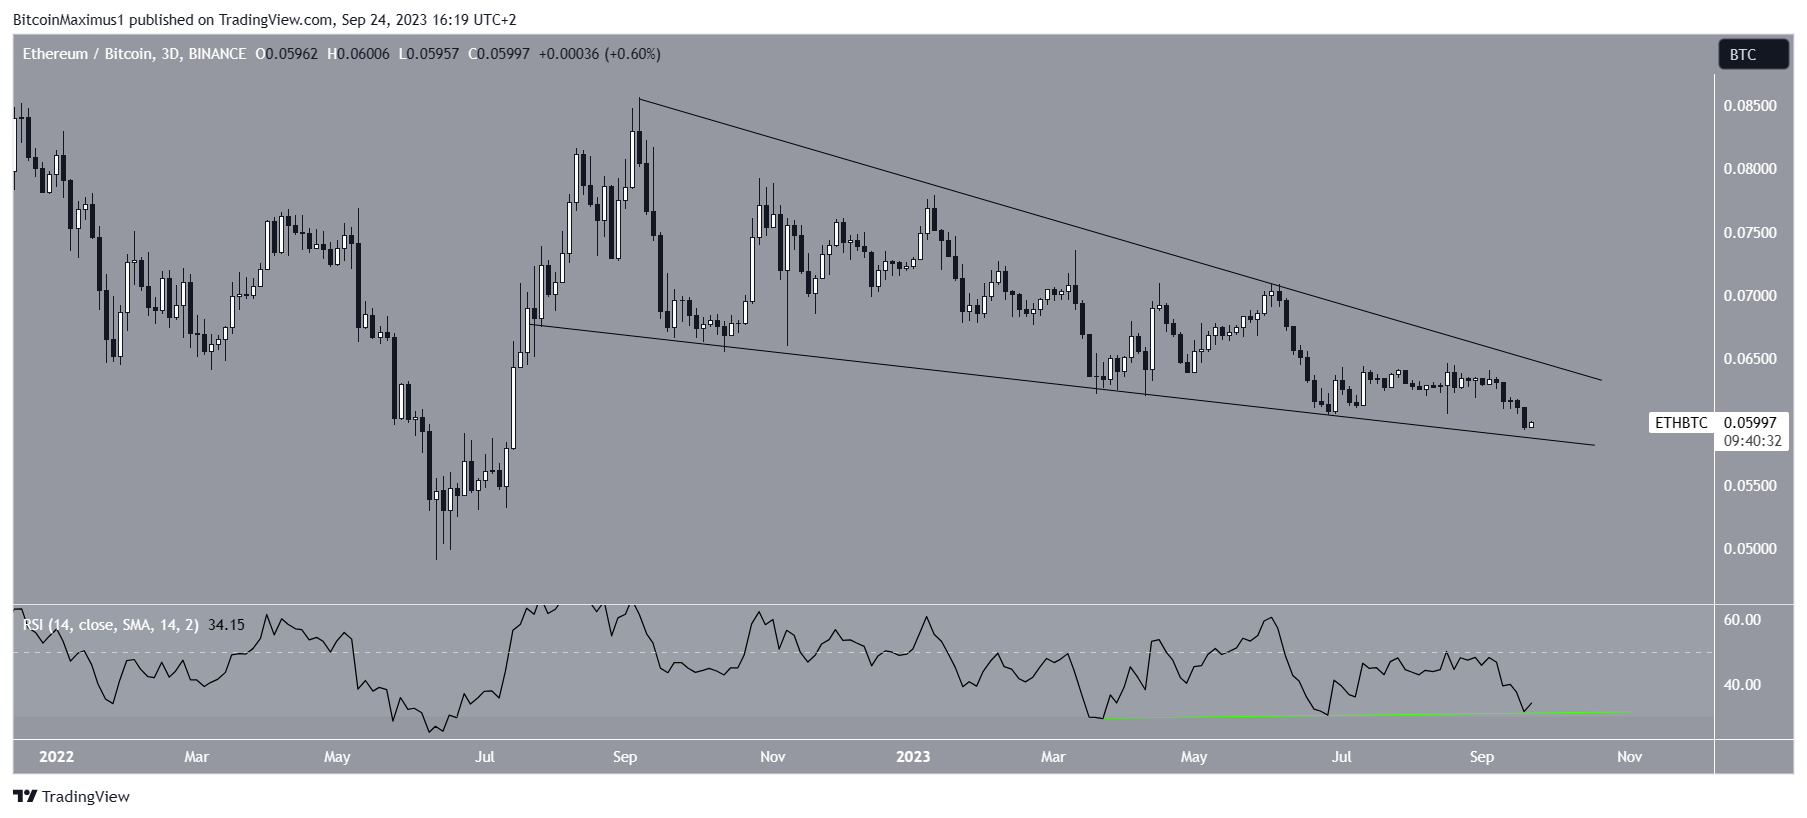
Similar to the ETH/USD chart, the ETH/BTC three-day time frame shows an ongoing descent since September 2022, when the price was trading at a high of ₿0.085.
However, the decrease has also been contained inside a descending wedge, which is considered a bullish pattern. The price is approaching the end of the wedge, at which time a decisive movement outside of it is expected. Since the wedge is considered a bullish pattern, a breakout is more likely.
Finally, the 3-day RSI has generated a significant amount of bullish divergence (green line). This is another sign that suggests an eventual breakout is likely.
As a result, the Ethereum price analysis still looks bearish in both the ETH/USD and ETH/BTC pairs. However, the latter also indicates that an eventual bullish trend reversal is quite close. Reclaiming the $1,650 area will mean that the ETH/USD trend is now also bullish.
Looking to be profitable? Learn how to make money in a bear market.
For BeInCrypto’s latest crypto market analysis, click here.


