


The Shiba Inu (SHIB) price broke down from the $0.0000080 horizontal support area, a sign of a bearish trend.
While the weekly timeframe readings are decisively bearish, the daily timeframe offers a more neutral outlook.
Shiba Inu Price Continues Falling Towards Support
The technical analysis in the weekly timeframe provides a bearish SHIB price outlook. The price action shows that the meme coin has been falling since it was rejected by a resistance line in August (red icon). The decrease caused a breakdown from the $0.0000080 horizontal support area. The area will now likely provide resistance.
Besides the rejection, the weekly RSI provides a bearish outlook. By using the RSI as a momentum indicator, traders can determine whether a market is overbought or oversold and decide whether to accumulate or sell an asset.
If the RSI reading is above 50 and the trend is upward, bulls have an advantage, but if the reading is below 50, the opposite is true. The indicator has been rejected by the 50 line (red circle) and is falling, both signs of a bearish trend.
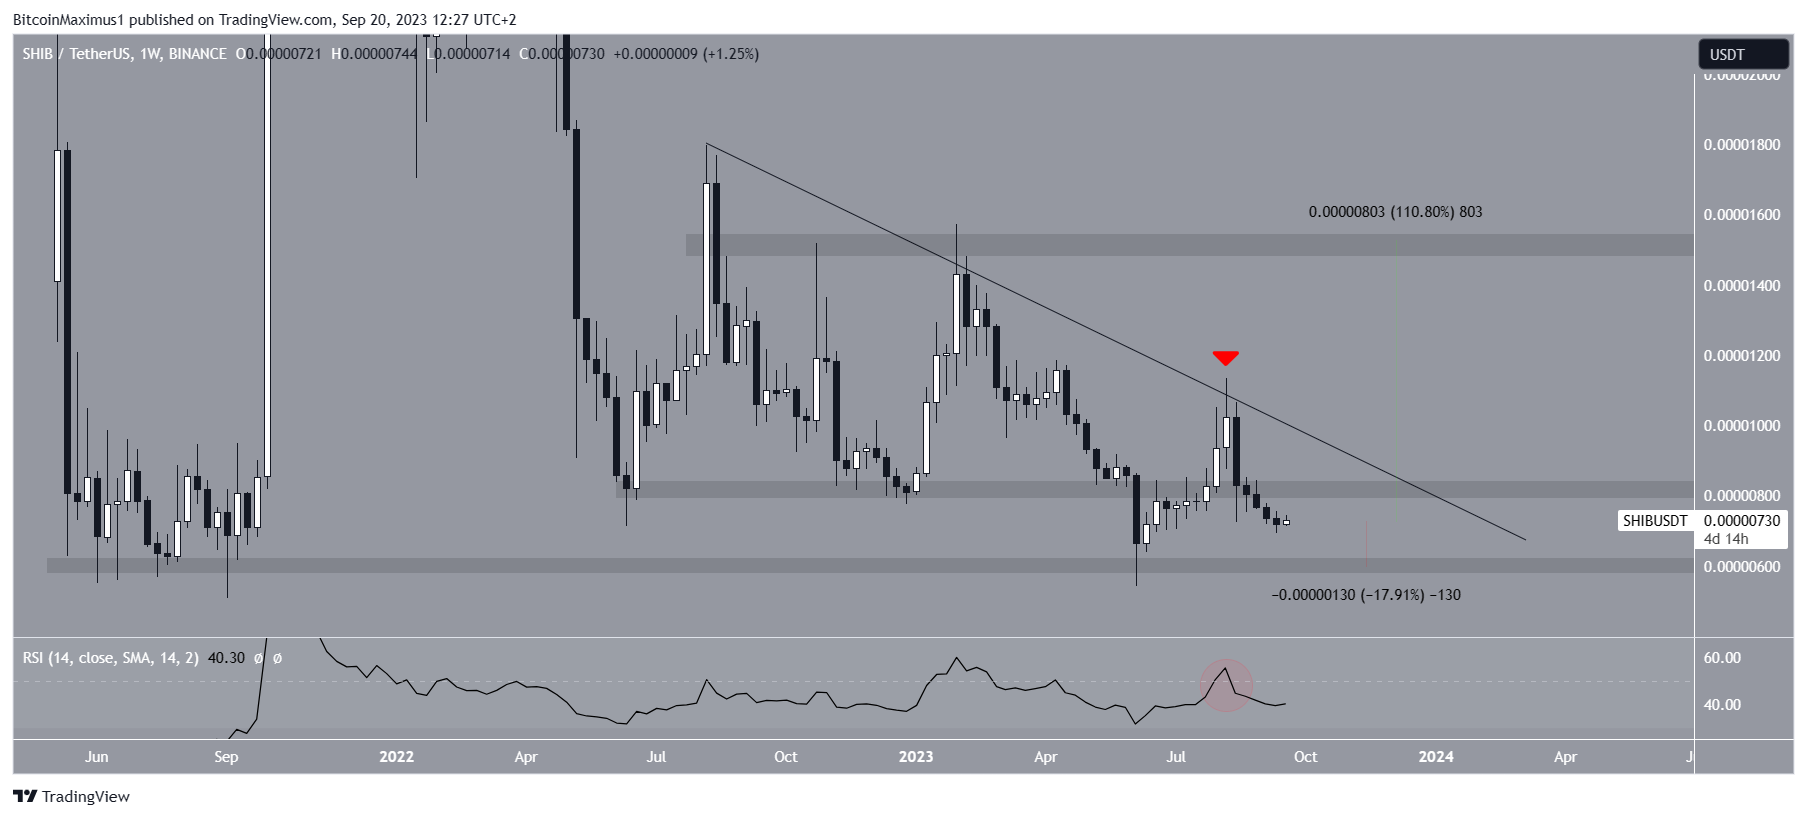
If the cryptocurrency continues to fall, the next closest support area will be at $0.0000060, a drop of 18% from the current price. On the other hand, a sudden increase in momentum and breakout from the descending resistance line will likely cause a 100% increase to $0.0000150. Currently, this does not seem likely.
SHIB Price Prediction: Where to Next?
The analysis from the six-hour timeframe offers conflicting readings, coming from both the price action and the RSI.
The SHIB price broke down from an ascending support line on Aug. 17, confirming that the previous upward movement had ended.
However, the price movement since has been contained inside a descending parallel channel. These channels often contain corrective movements, meaning that an eventual breakout is expected.
Additionally, the price bounced at the channel’s support line on Sept. 11 (green icon). This bounce coincided with the minor $0.0000072 horizontal support area.
The six-hour RSI is also unclear. While the indicator is increasing, it is still below 50, making the future trend undetermined.
If the price were to continue decreasing, it will reach the $0.0000060 area on Oct. 12, since at that time the area will coincide with the channel’s support line.
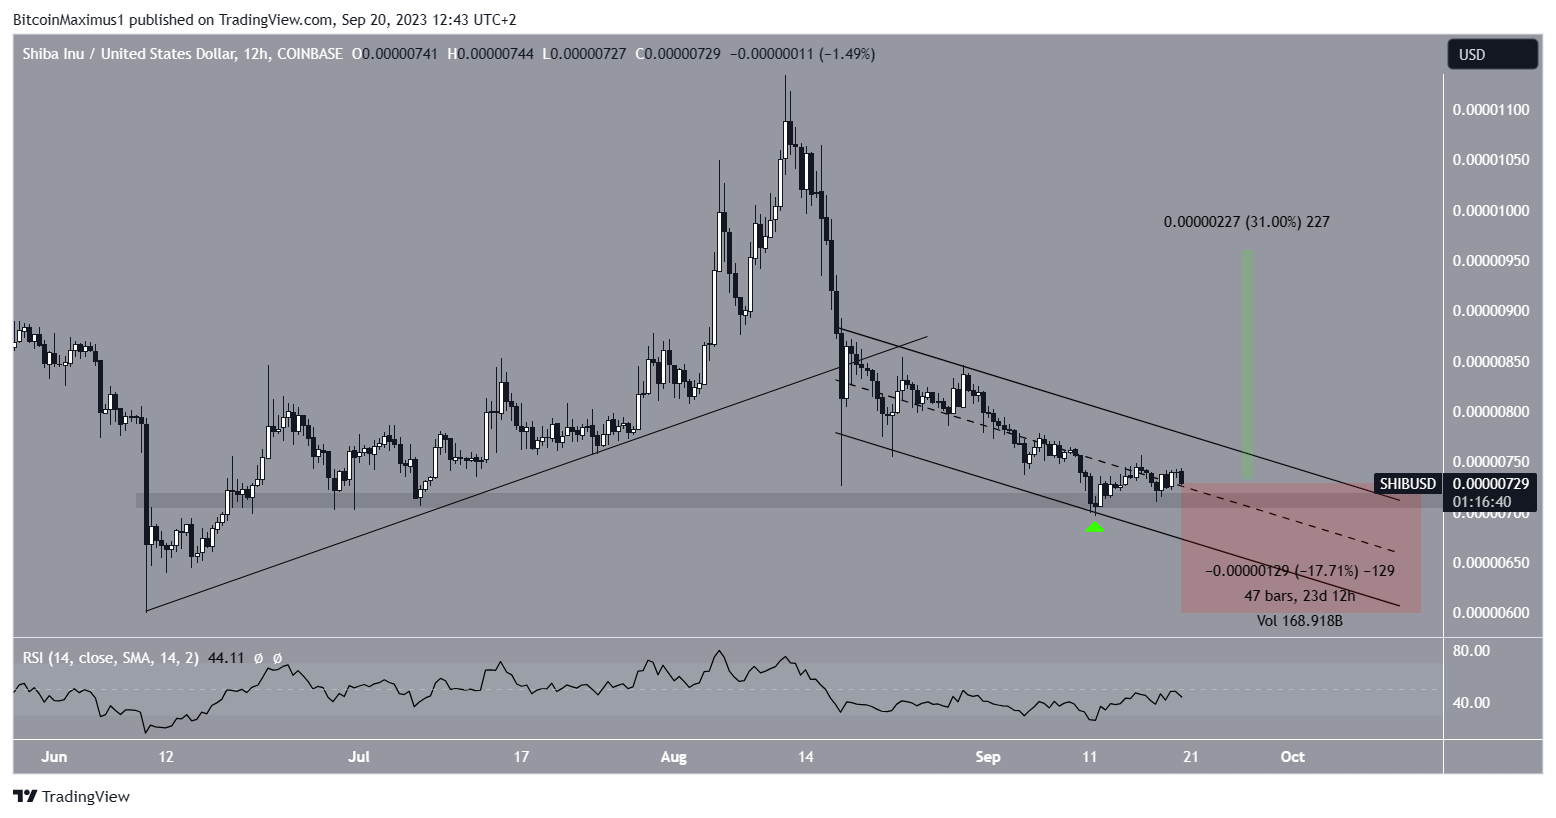
However, the SHIB price prediction could turn bullish if a breakout from the channel occurs. In that case, a 30% increase to the long-term resistance line at $0.0000095 will be likely.
Check Out the 9 Best AI Crypto Trading Bots to Maximize Your Profits
For BeInCrypto’s latest crypto market analysis, click here.



