The Ethereum (ETH) price finally started an upward movement this week, increasing by 20% and reaching a 620-day high.
Can this upward movement take the ETH price to $3,000, or will the rally die soon? Let’s find out!
Will Ethereum Catch Up to Solana?
Speaking to BeInCrypto, Slater Heil, CEO at Composable Corp and leader at Blueberry Protocol, discussed reasons for Ethereum’s perceived underperformance relative to Solana.
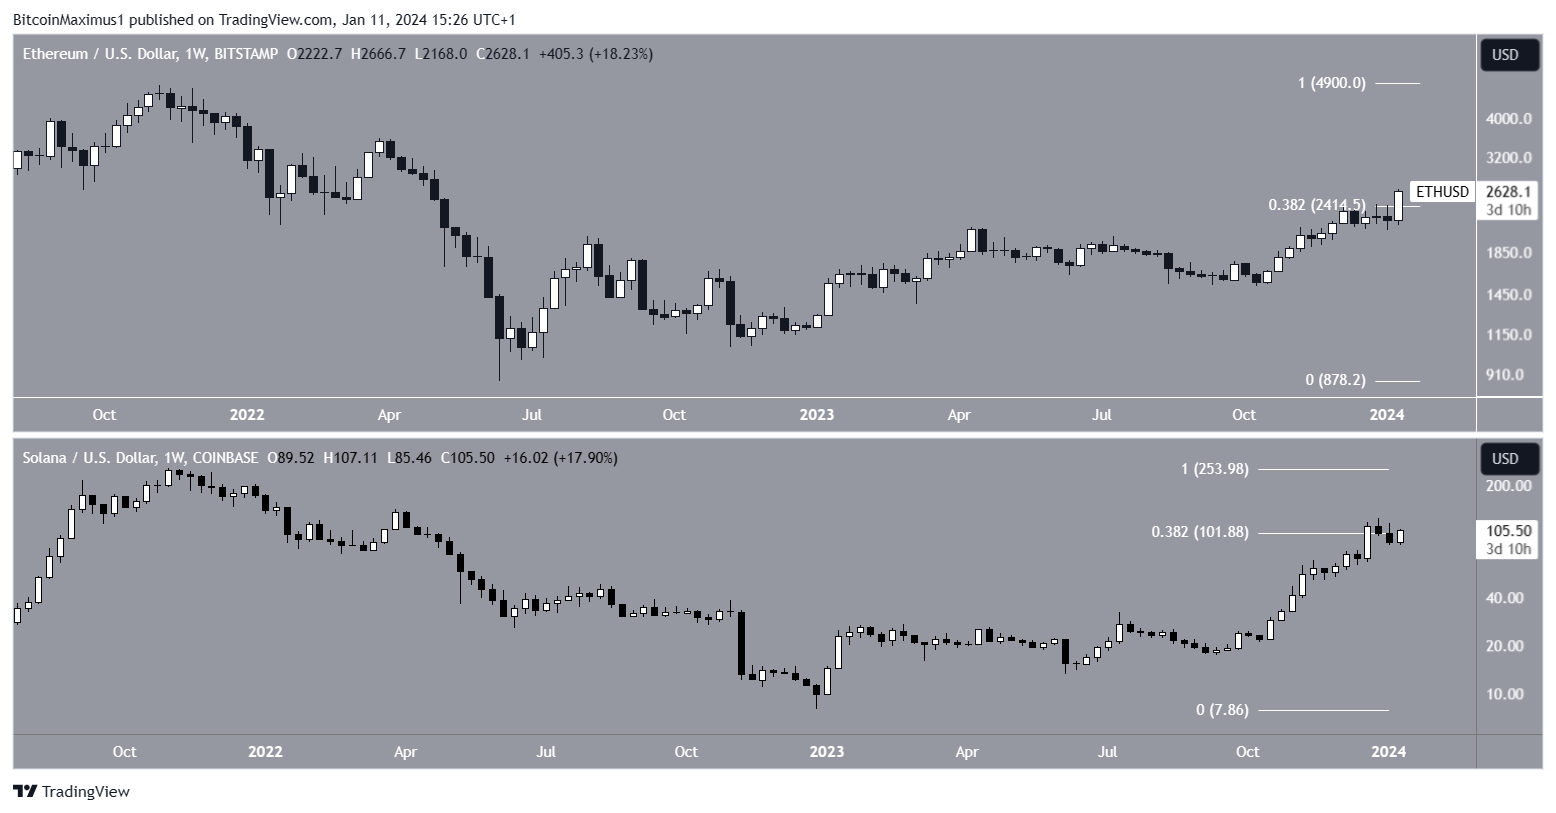
One of the reasons that Solana appreciated more in 2023 is that its price had fallen more the previous year. More specifically, SOL had fallen by nearly 97% since the all-time high, compared to “only” 77% for Ethereum.
When looking at Fib levels, SOL and ETH have retraced similarly. Both are close to their 0.382 Fib retracement resistance levels.

In the cryptocurrency markets, Mr. Heil believes that price drives narrative. Hence, the recent outperformance by SOL has led to the belief that Solana has taken over Ethereum.
Another interesting thing to note is the outperformance of Ethereum by its betas, such as Lido DAO (LDO), Arbitrum (ARB), and Optimism (OP). This can be attributed to the possibility that investors and speculators are always looking for new things.
Read More: How to Buy Ethereum
However, in the case of LDO, its growth as a network shows substantial progress. Its total Value Locked (TVL) is at an all-time high of $21 billion. In contrast, Ethereum’s TVL of $85 billion is well below its all-time high of $192 billion.
Mr. Heil correctly suggested that once the Bitcoin ETF narrative dies down, Ethereum will be next. The ETH/BTC pair showed strong signs of the bottom the day the fake ETF approval tweet came out.
Regarding Ethereum vs Solana, Mr. Heil states that:
The prevailing narrative around Ethereum rightly calls out the high transaction fees and a user experience that seems more tailored to large investors than to everyday users. Yet, the reality is that Ethereum deliberately prioritizes long-term security and scalability over the immediate user experience. This strategy aligns with protocols that seek to attract investors who place a higher value on security than on quick, low-cost transactions.
As for the Blueberry Protocol, which Mr. Heil is leading, the DeFi terminal will launch on January 23, while its governance token BLB will launch on March 23.
Read More: How to Buy Ethereum
Ethereum Price Prediction: Where to Next?
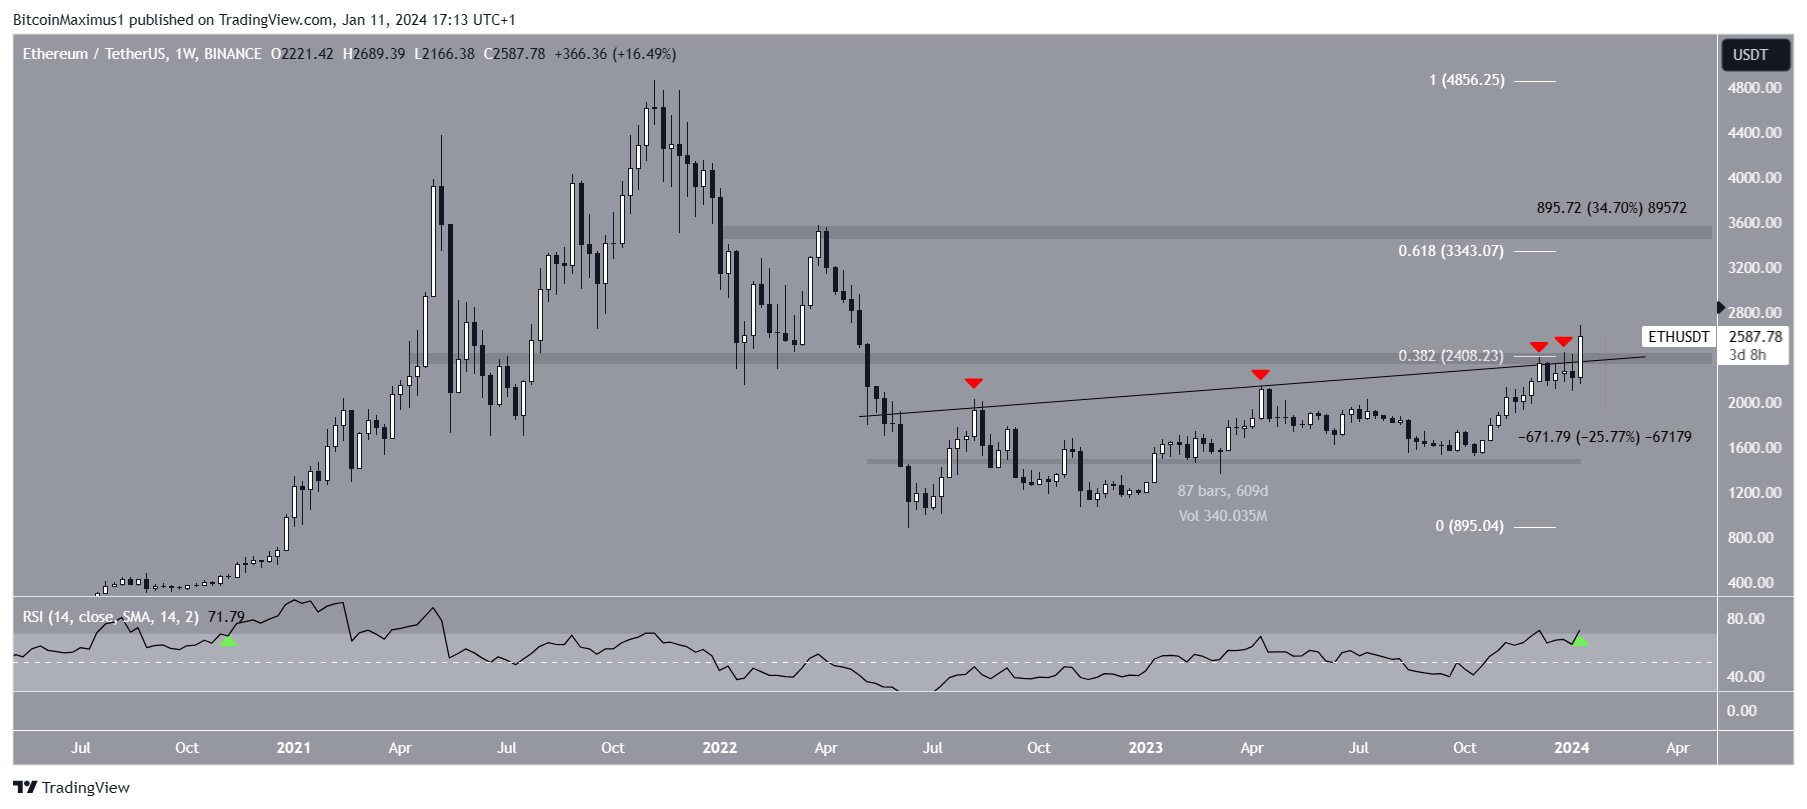
The technical analysis from the weekly time frame shows that the ETH price has increased in a gradual trajectory since May 2022.
ETH traded below the $2,410 resistance area and an ascending resistance trend line during this time. The $2,410 area is critical since it is both a horizontal and the 0.382 Fib retracement resistance level.
After four unsuccessful attempts (red icons), the ETH price finally broke out this week, culminating with a high of $2,689. At the breakout, the trend line had been in place for more than 600 days.
The weekly Relative Strength Index (RSI) supports this increase. Market traders use the RSI as a momentum indicator to identify overbought or oversold conditions and to decide whether to accumulate or sell an asset.
Readings above 50 and an upward trend indicate that bulls still have an advantage, whereas readings below 50 suggest the opposite. The RSI is increasing and crossed into overbought territory (green icon). In the previous cycle, this preceded an increase to an all-time high.
If the ETH increase continues, the closest resistance area will be between $3,340 and $3,500, 35% above the current price. The 0.618 Fib retracement resistance level and a horizontal resistance area create the resistance.

Despite this bullish ETH price prediction, a weekly close below the ascending resistance trend line will invalidate the breakout. Then, ETH can fall 25% to the closest support at $2,000.
For BeInCrypto’s latest crypto market analysis, click here.
Disclaimer
In line with the Trust Project guidelines, this price analysis article is for informational purposes only and should not be considered financial or investment advice. BeInCrypto is committed to accurate, unbiased reporting, but market conditions are subject to change without notice. Always conduct your own research and consult with a professional before making any financial decisions. Please note that our Terms and Conditions, Privacy Policy, and Disclaimers have been updated.


