


Ethereum’s (ETH) price has fallen since reaching a high of $2,720 on January 12. The decrease continued for 11 days.
ETH has traded inside a horizontal range for the past 61 days. Will it break out or down?
Ethereum Fails to Clear Resistance
The weekly time frame technical analysis shows that ETH has increased since June 2022. During this time, it created three higher lows (green icons), each accelerating the increase afterward.
The Ethereum price increase culminated with a high of $2,720 in January 2024. The high was above the 0.382 Fib retracement resistance level and a horizontal resistance area.
However, ETH fell below the area afterward, making the previous movement a deviation. ETH still trades below this resistance area.
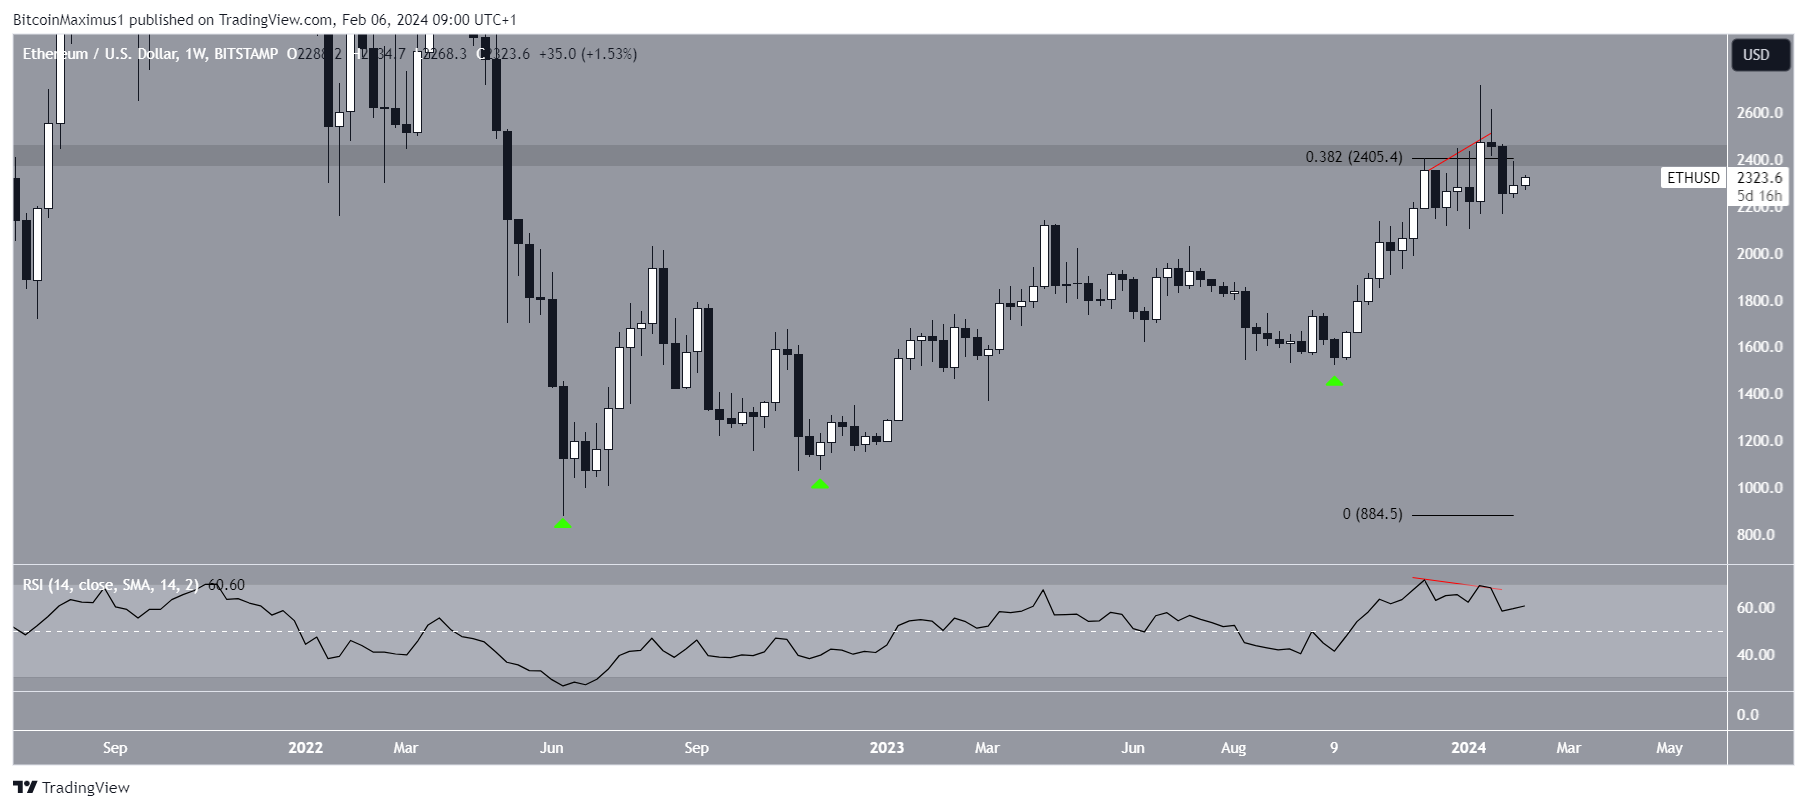
The weekly Relative Strength Index (RSI) is leaning bearish. Market traders use the RSI as a momentum indicator to identify overbought or oversold conditions and to decide whether to accumulate or sell an asset.
Readings above 50 and an upward trend indicate that bulls still have an advantage, whereas readings below 50 suggest the opposite. Even though it is above 50, the RSI is falling. Also, it generated bearish divergence (red) before the decrease, which often precedes downward movements.
Read More: What Is Wrapped Ethereum (WETH)?
What Are Analysts Saying?
Cryptocurrency analysts and traders on X are uncertain about the future ETH trend.
CryptoMichNL suggests that as long as the price holds above $2,150, ETH will increase to $3,000.
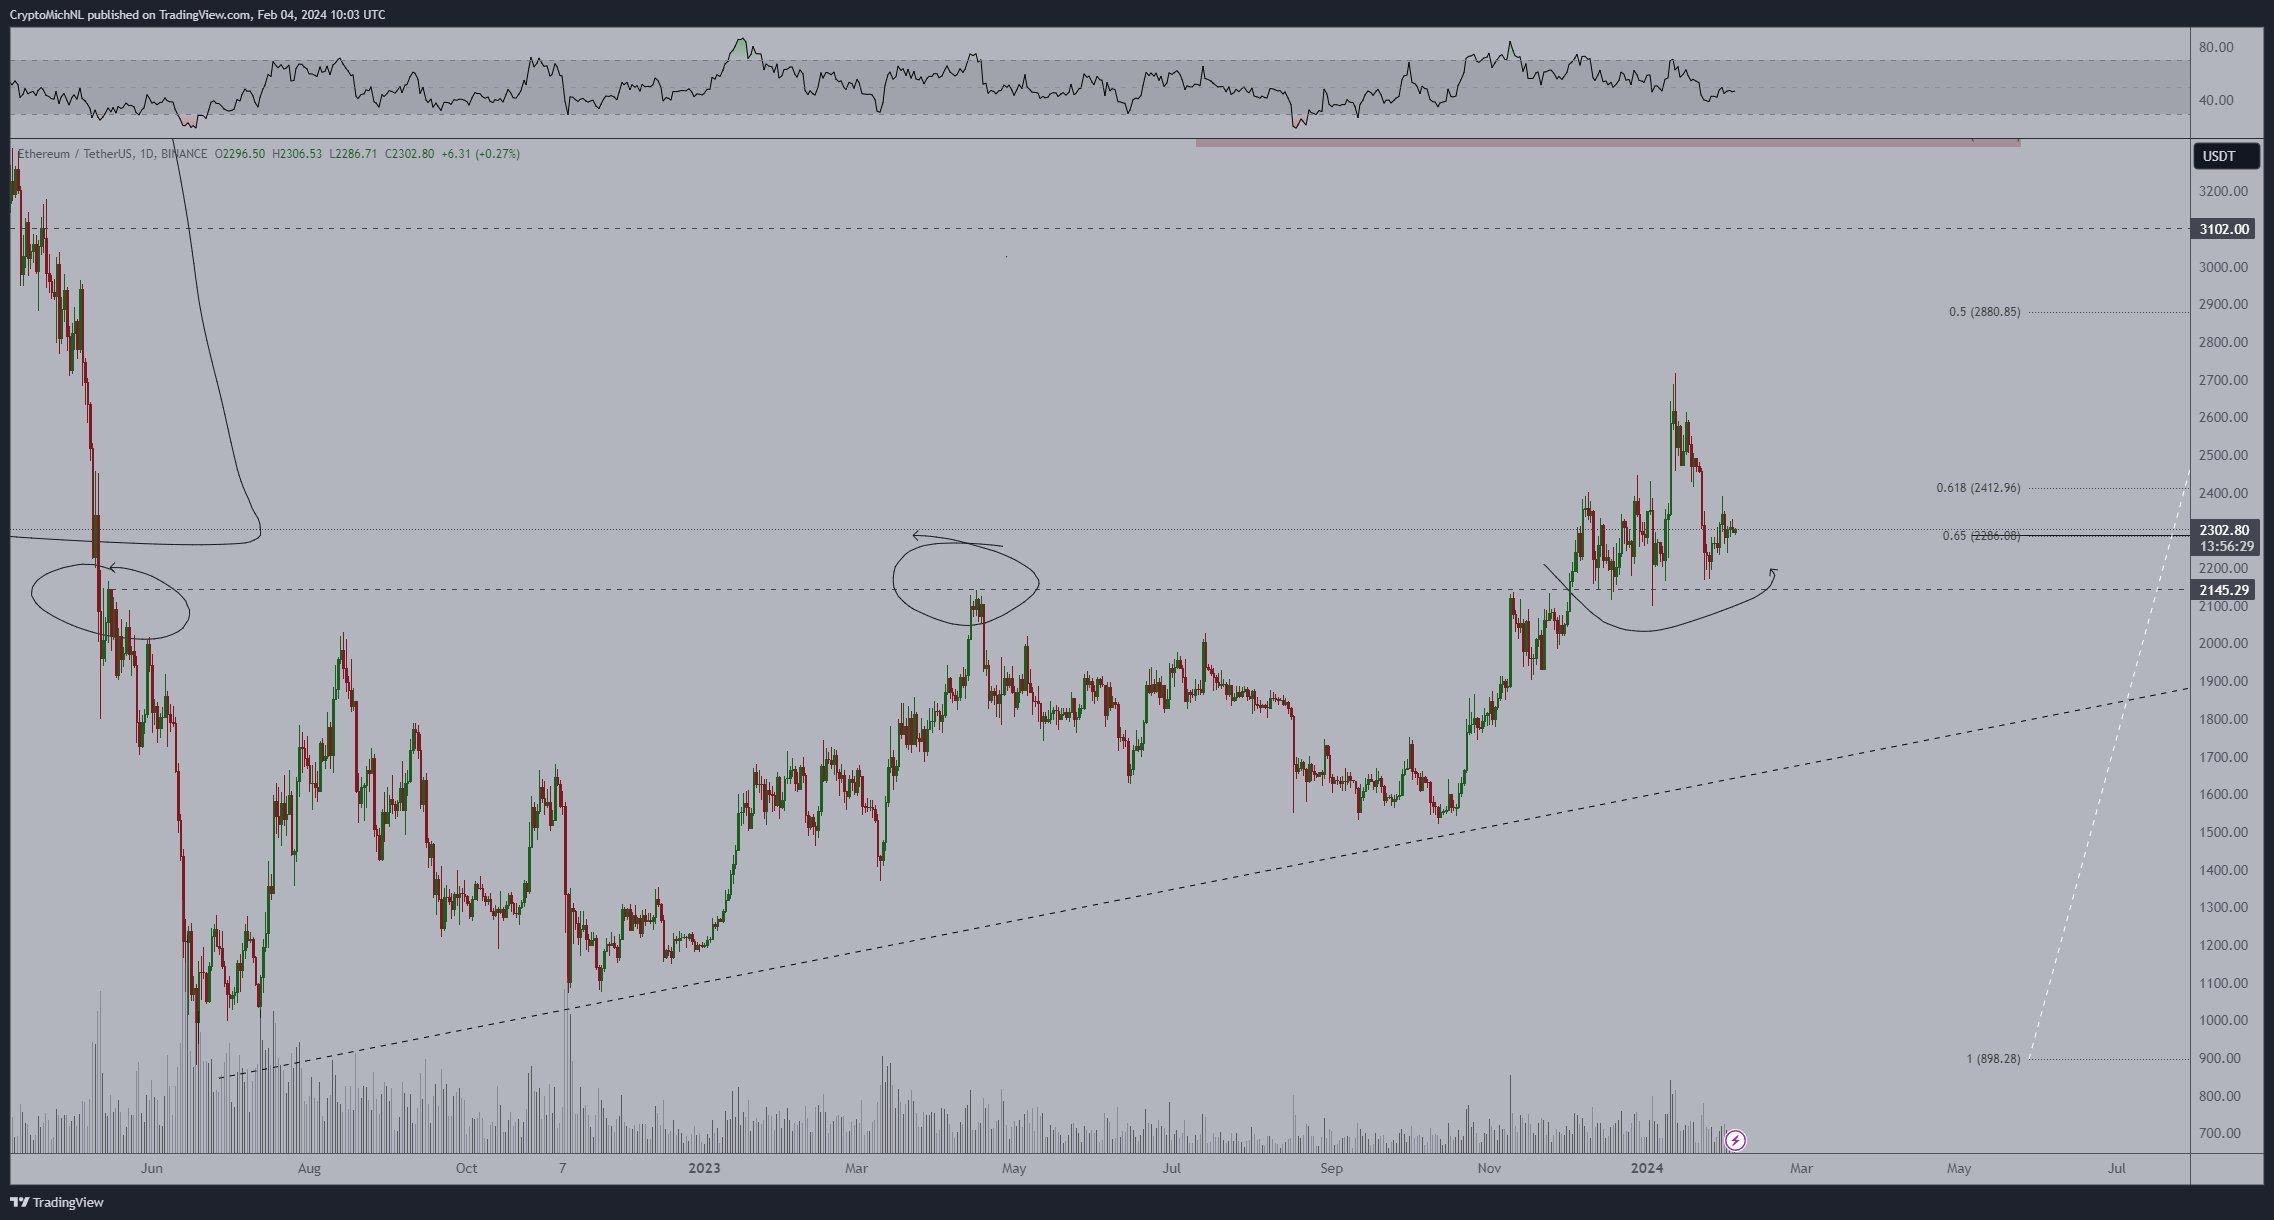
He also believes ETH will outperform Bitcoin (BTC) because of the Dencun upgrade:
The Dencun upgrade is taking place on the final testnet in the next few days. Most likely it will have a positive impact on the price of Ethereum, but I’d rather want to see a flip of 0.06 for confirmation or a sweep of the lows.
XForceGlobal uses Elliott Wave Theory to make his analysis. However, he suggests there are still two possible counts for the future trend, one bullish and the other bearish.
CryptoGodJohn suggests the price will initially fall but will bounce afterward.
Read More: How To Buy Ethereum (ETH)
ETH Price Prediction: What Happens to the Range?
The daily time frame outlook gives a similarly undetermined trend because of the price action and RSI readings.
The price action shows that ETH has traded between $2,200 and $2,370 for the past 61 days. It is currently nearing the top of the range, which coincides with the 0.382 Fib retracement resistance level.
However, while the RSI is increasing, it is still below 50 (red circle), a likely resistance level.
So, whether ETH breaks out from its range or breaks down instead will determine the future ETH price prediction.
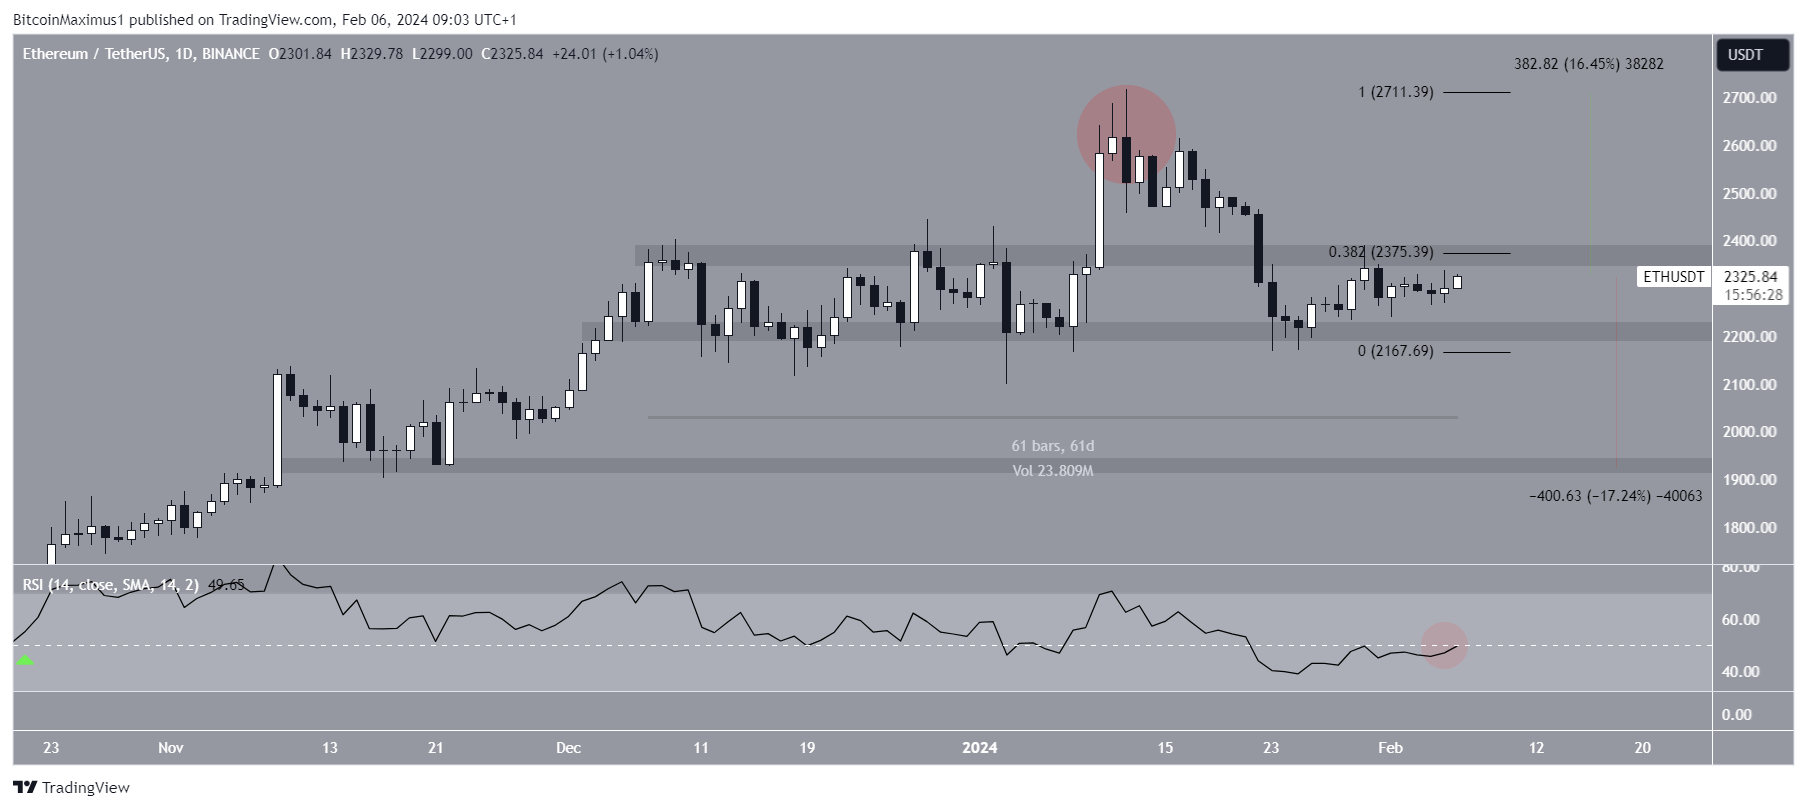
A successful ETH breakout can trigger a 16% increase to the next resistance at $2,700, while a breakdown from the $2,200 support area can cause a 17% drop to the next support at $1,950.
For BeInCrypto‘s latest crypto market analysis, click here.


