


The Ethereum (ETH) price has nearly fallen to a 910-day low against the Bitcoin (BTC) price.
ETH bounced at a confluence of support levels this week. Will this mark the cycle bottom?
How Money Moves in Bull Markets
While most cryptocurrency markets flourished in October, some altcoins have lagged behind, both in social volume and price returns.
This is particularly noticeable in Ethereum, which is being discussed almost 20% less than last week despite a 15% Ethereum rally.
Some X users are not concerned since they believe that the usual money flow in bull markets suggests that BTC will increase first, followed by ETH and then other large- and medium-cap cryptocurrencies.
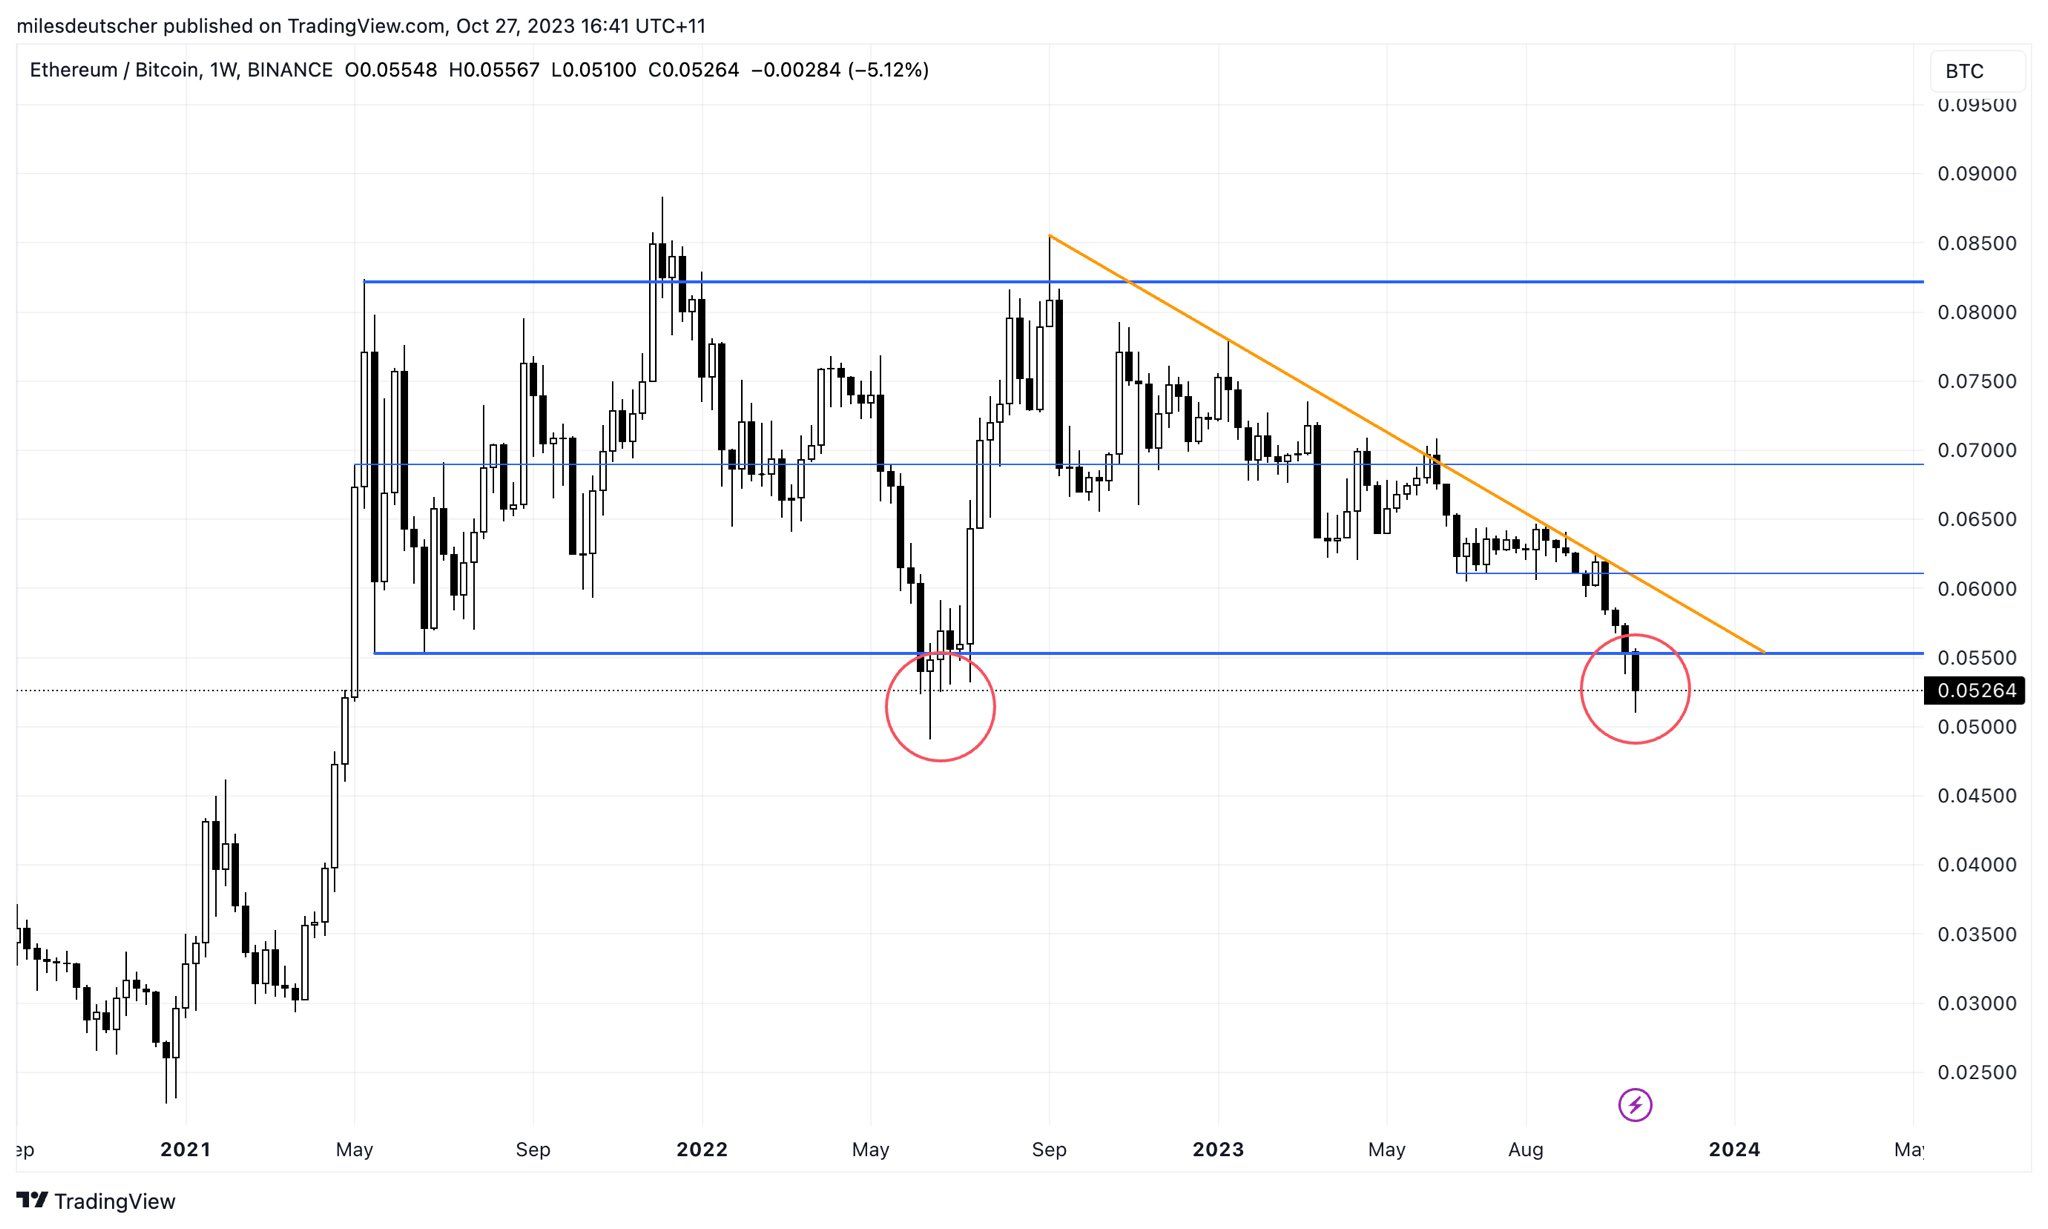
A particularly interesting chart is the ETH/BTC one, which shows the price approaching a 910-day low. The previous time the price reached this level, a significant upward movement followed.
Some users believe that the Ethereum price will replicate the rapid increase of BTC since the chart shows both bullish price action and Elliott wave count, with crypto trader @cryptotony__ expecting the price to climb over $2,000, Saying
“This would be absolutely perfect to come in 100 Complete this flat wave 4 pattern then pump”
Despite these claims, the Ethereum price trades below a 190-day descending resistance trendline.
ETH Price Prediction: Has Cycle Low Been Reached Against BTC?
The weekly timeframe chart for ETH/BTC shows several bullish signs that could mean the price will bottom soon. These signs are visible in the price action and Relative Strength Index (RSI).
The price action shows that ETH has bounced at a confluence of long-term support levels at ₿0.051 (green circle).
The support is created by a 1400-day ascending support trendline (black) since the start of 2020 and a descending parallel channel (white) in place since June 2022.
The RSI has fallen into oversold territory at 27 (red trendline). This is the lowest weekly RSI value since July 2019, when the price was trading at ₿0.017.
If Ethereum rallies at this support, a 20% increase to the channel’s resistance trendline at ₿0.063 will be likely.
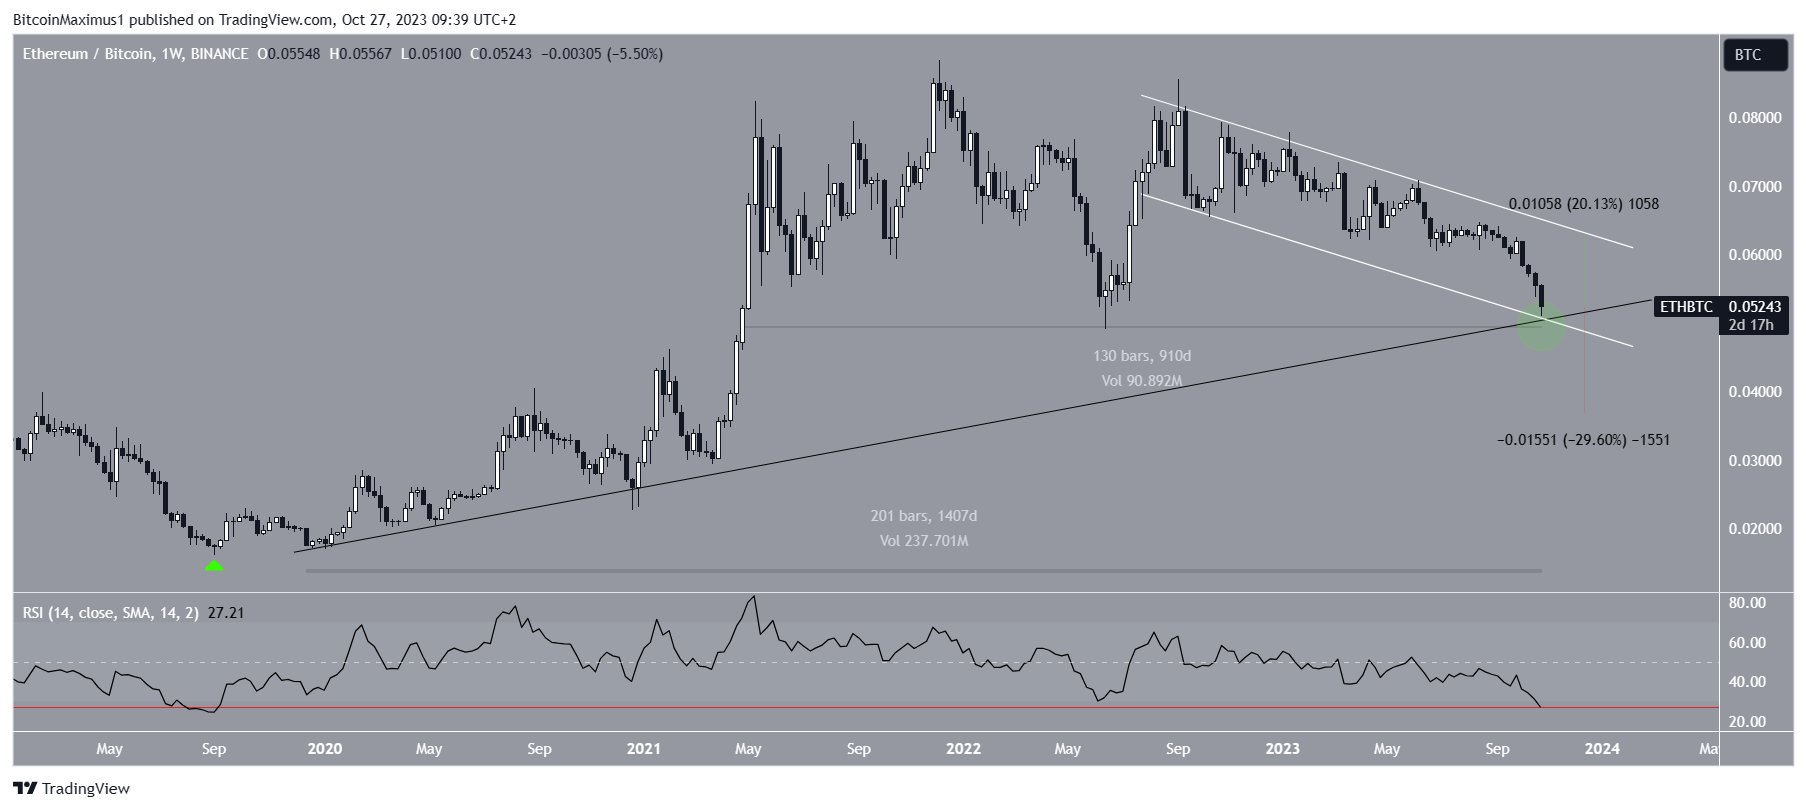
Despite this bullish Ethereum price prediction, a breakdown from the long-term ascending support line can cause a 30% drop to the next closest support at ₿0.037.
For BeInCrypto‘s latest crypto market analysis, click here.


