
The DYDX price has increased in the past two weeks, moving above $3 and reclaiming a horizontal support area.
The price also broke out from a short-term descending parallel channel pattern. Has the bullish trend reversal started?
DYDX Reclaims Lost Resistance
The DYDX price has increased inside an ascending parallel channel since the start of 2023. The channel’s support and resistance trend lines have been validated sufficiently, most recently in November (red icon).
The ensuing decrease took DYDX below a critical horizontal resistance area, from which the price had seemingly broken out. However, DYDX regained its footing in the past two weeks and is reclaiming the horizontal area.
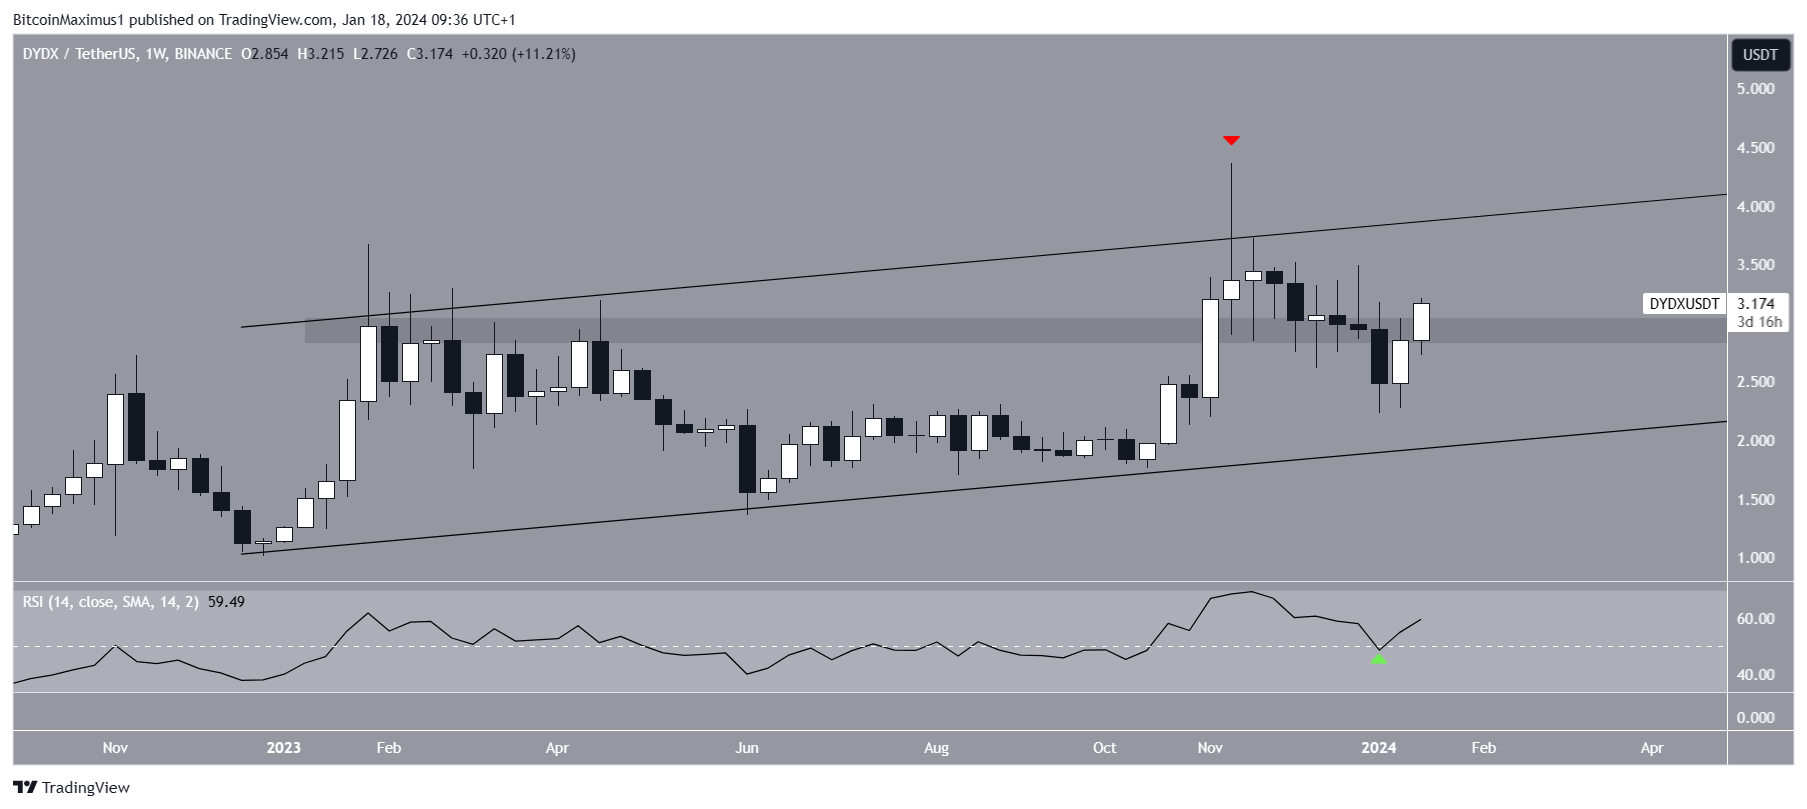
Market traders use the RSI as a momentum indicator to identify overbought or oversold conditions and to decide whether to accumulate or sell an asset.
Readings above 50 and an upward trend indicate that bulls still have an advantage, whereas readings below 50 suggest the opposite. The weekly RSI supports reclaiming the horizontal resistance area since the indicator bounced at 50.
What do the Analysts Say?
Cryptocurrency traders and analysts on X have a bullish view of the future trend. Cryptocurrency trader Nihilus said that the trend will be confirmed as bullish once the price breaks out from its resistance trend line.
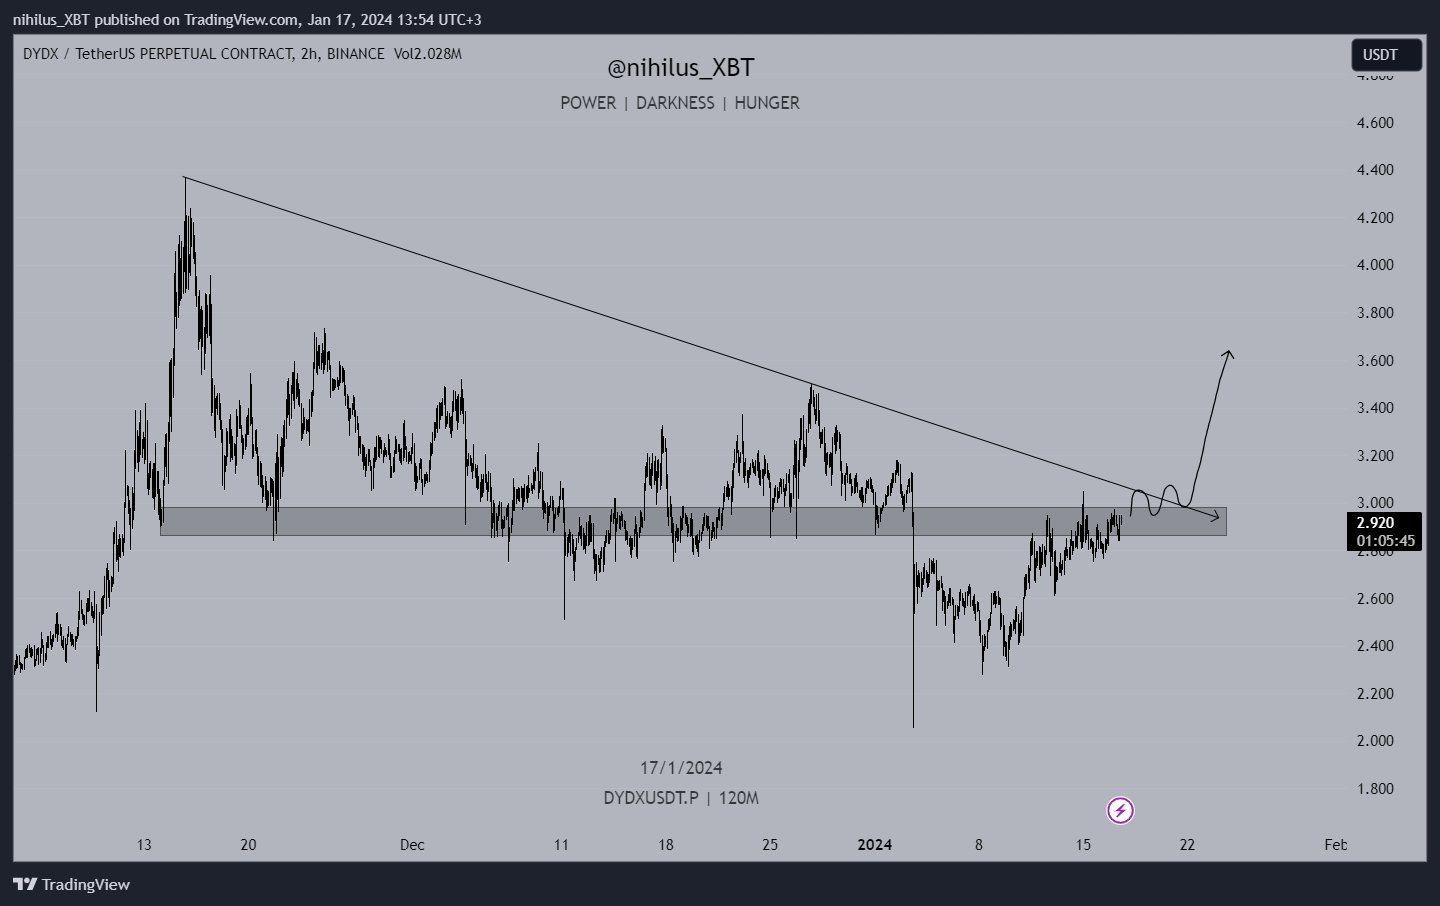
Since the tweet, DYDX has broken out and increased above $3. CryptoDude999 is also bullish because of the breakout and retest. Finally, KMvision suggests that the price will increase above $4 soon.
DYDX Price Prediction: Will the Upward Movement Continue?
While the weekly time frame does not confirm the trend’s direction, the daily one gives a bullish reading. This is because of the price action and RSI.
The price action shows that DYDX broke out from a descending parallel channel today. Previously, the channel had been in place since the rejection from the long-term pattern in November 2023.
The daily RSI (green) also broke out from its resistance trend line and increased above 50. Both are considered signs of a bullish trend.
If the upward movement continues, DYDX can increase by 25% and reach the next resistance at $3.90. This would take the price to the resistance trend line of the long-term channel.
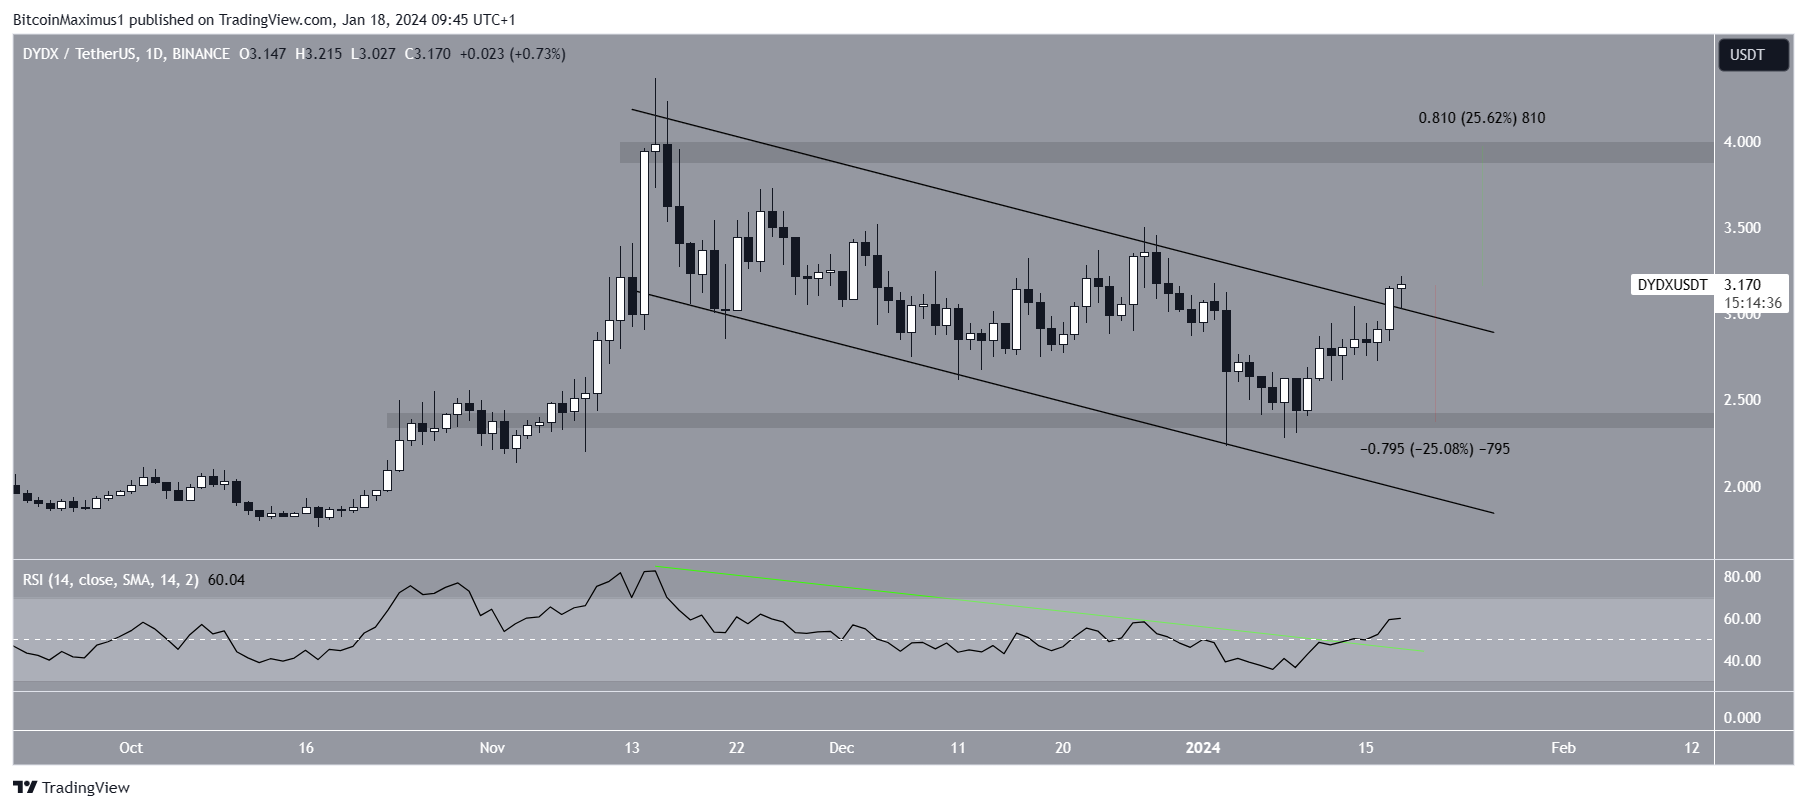
Despite this bullish DYDX price prediction, closing below the channel’s resistance trend line will invalidate the breakout. Then, DYDX can fall 25% to the closest support at $2.40.
For BeInCrypto‘s latest crypto market analysis, click here.
