


The Dogecoin (DOGE) price increase culminated with a new yearly high of $0.106 on Wednesday.
While the price fell slightly today, the bullish trend remains intact. Will the DOGE price increase continue?
Dogecoin (DOGE) Approaches Long-Term Resistance
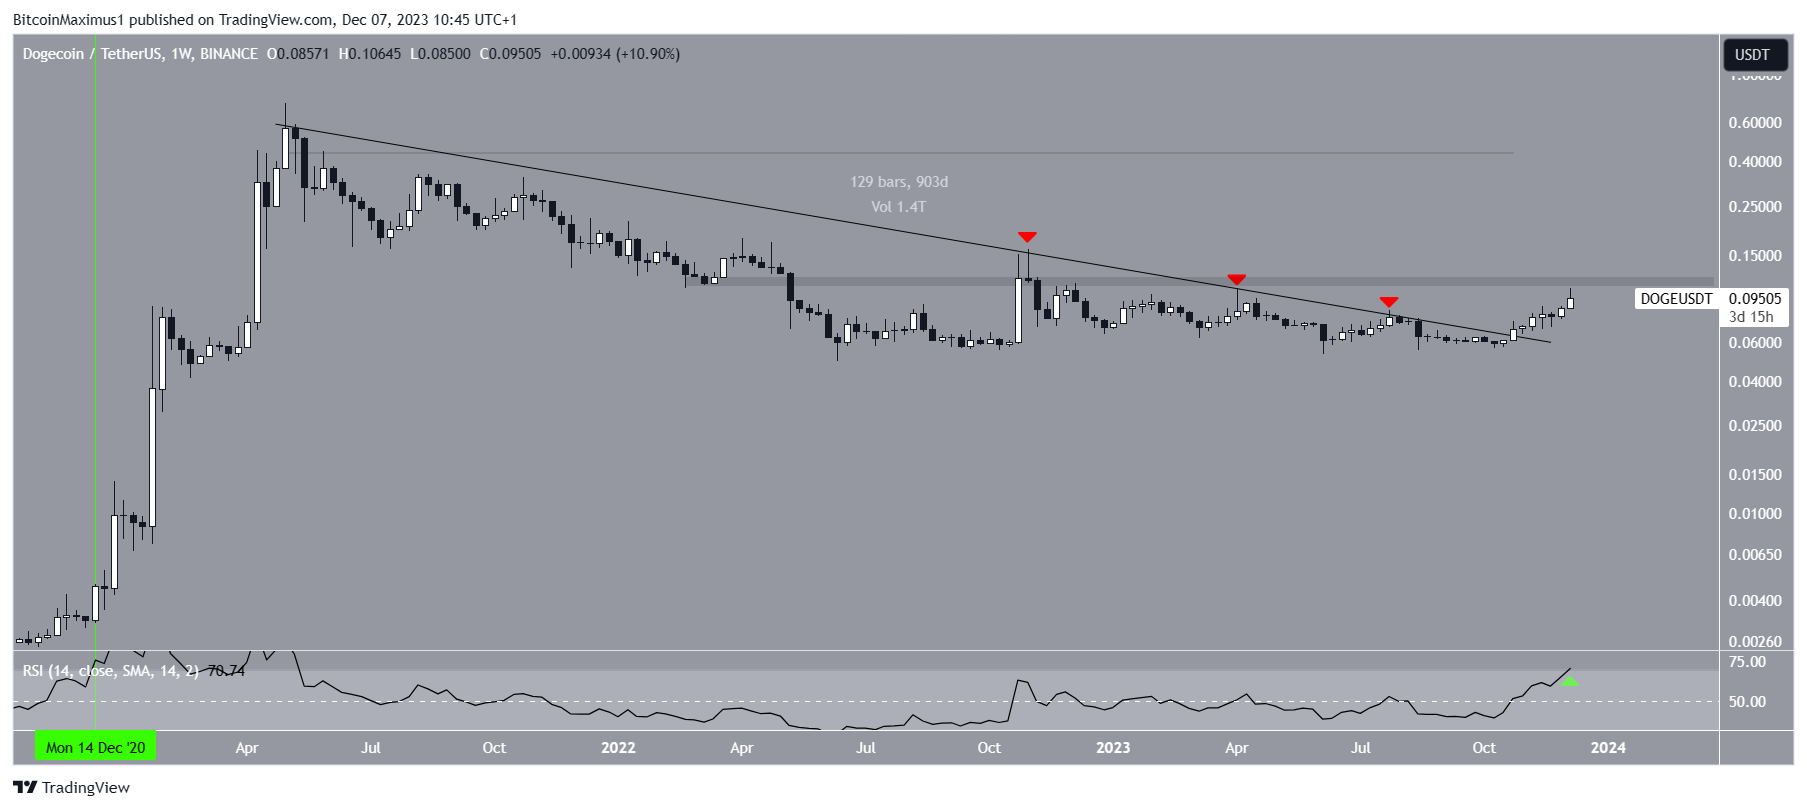
The weekly time frame technical analysis shows that the DOGE price broke out from a more than 900-day descending resistance trend line in October.
Previously, the trend line had been in place since the all-time high, and DOGE made three unsuccessful breakout attempts (red icons).
The DOGE increase led to a new yearly high of $0.106 today, close to a pivotal horizontal resistance area. The high was made on DOGE’s 10-year anniversary.
With the Relative Strength Index (RSI) as a momentum indicator, traders can determine whether a market is overbought or oversold and decide whether to accumulate or sell an asset.
Bulls have an advantage if the RSI reading is above 50 and the trend is upward, but if the reading is below 50, the opposite is true.
The Relative Strength Index (RSI) is above 50 and increasing, both signs of a positive trend. An interesting development is that the RSI has nearly moved above 70 (green icon), crossing into overbought territory.
Previously, the RSI moved into overbought territory (green vertical trend line), which preceded the increase toward the all-time high.
Read more: How To Buy Dogecoin (DOGE) and Everything You Need To Know
DOGE Price Prediction: Is Increase Sustainable?
The daily time frame chart shows that despite the new yearly high, the DOGE price created a very long upper wick on Wednesday (red icon). Such wicks are considered signs of selling pressure.
Additionally, the DOGE price trades inside the $0.095 resistance area, which has been in place since the start of the year.
Cryptocurrency trader Efloud said that he is exiting his position since the price reached resistance. More specifically, he stated:
I sold 95% of spot (with 50% profit) and all of margin position (with average 20% profit) in the red box. Loss of the $0.085 level may create a squeeze. If it falls into the green box, close to the price, I would consider buying it again. Enjoy.
Even though the price action is bearish, the daily RSI is bullish. The indicator broke out from its bearish divergence trend line (green) and is moving upwards.
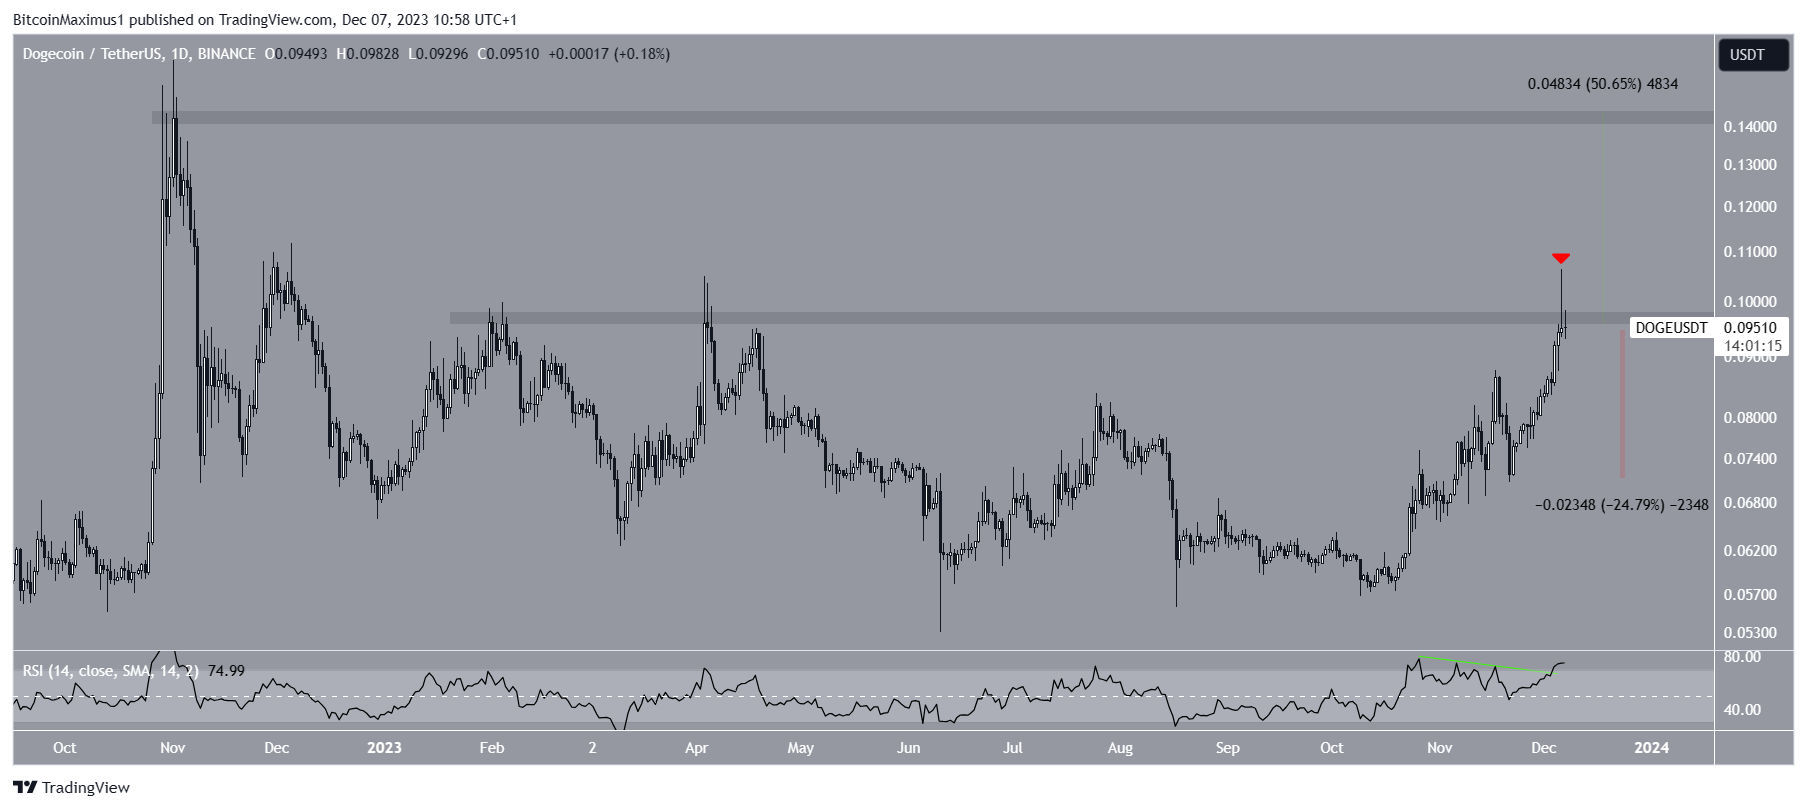
As a result of these mixed readings, the DOGE price prediction will depend on whether the price breaks out above this area or not. A successful breakout can lead to a 50% increase to the next resistance at $0.145. On the other hand, a rejection can lead to a drop of 25% to the closest support at $0.070.


