


There has been a rebound in the price of Dogecoin (DOGE) on shorter timeframes, leading to a breakout from a diagonal resistance. But, there are still noticeable concerns regarding its long-term prospects.
The DOGE price attempts to break out from an important Fib resistance level. Doing so would go a long way in confirming that a bullish reversal has begun, and new highs will follow.
Dogecoin Price Consolidates Below Long-Term Resistance
The technical analysis from the weekly time frame shows that the DOGE price has fallen under a descending resistance line since its all-time high of $0.739 in May 2021. The decrease culminated with a low of $0.049 in June 2022.
Read More: 9 Best Crypto Demo Accounts For Trading
The DOGE price bounced afterward and has traded above the $0.060 horizontal area since. However, it has not broken out from the long-term descending resistance line. The line has now been in place for 791 days.
The weekly RSI provides an undetermined reading. The RSI is a momentum indicator traders use to evaluate whether a market is overbought or oversold and to determine whether to accumulate or sell an asset.
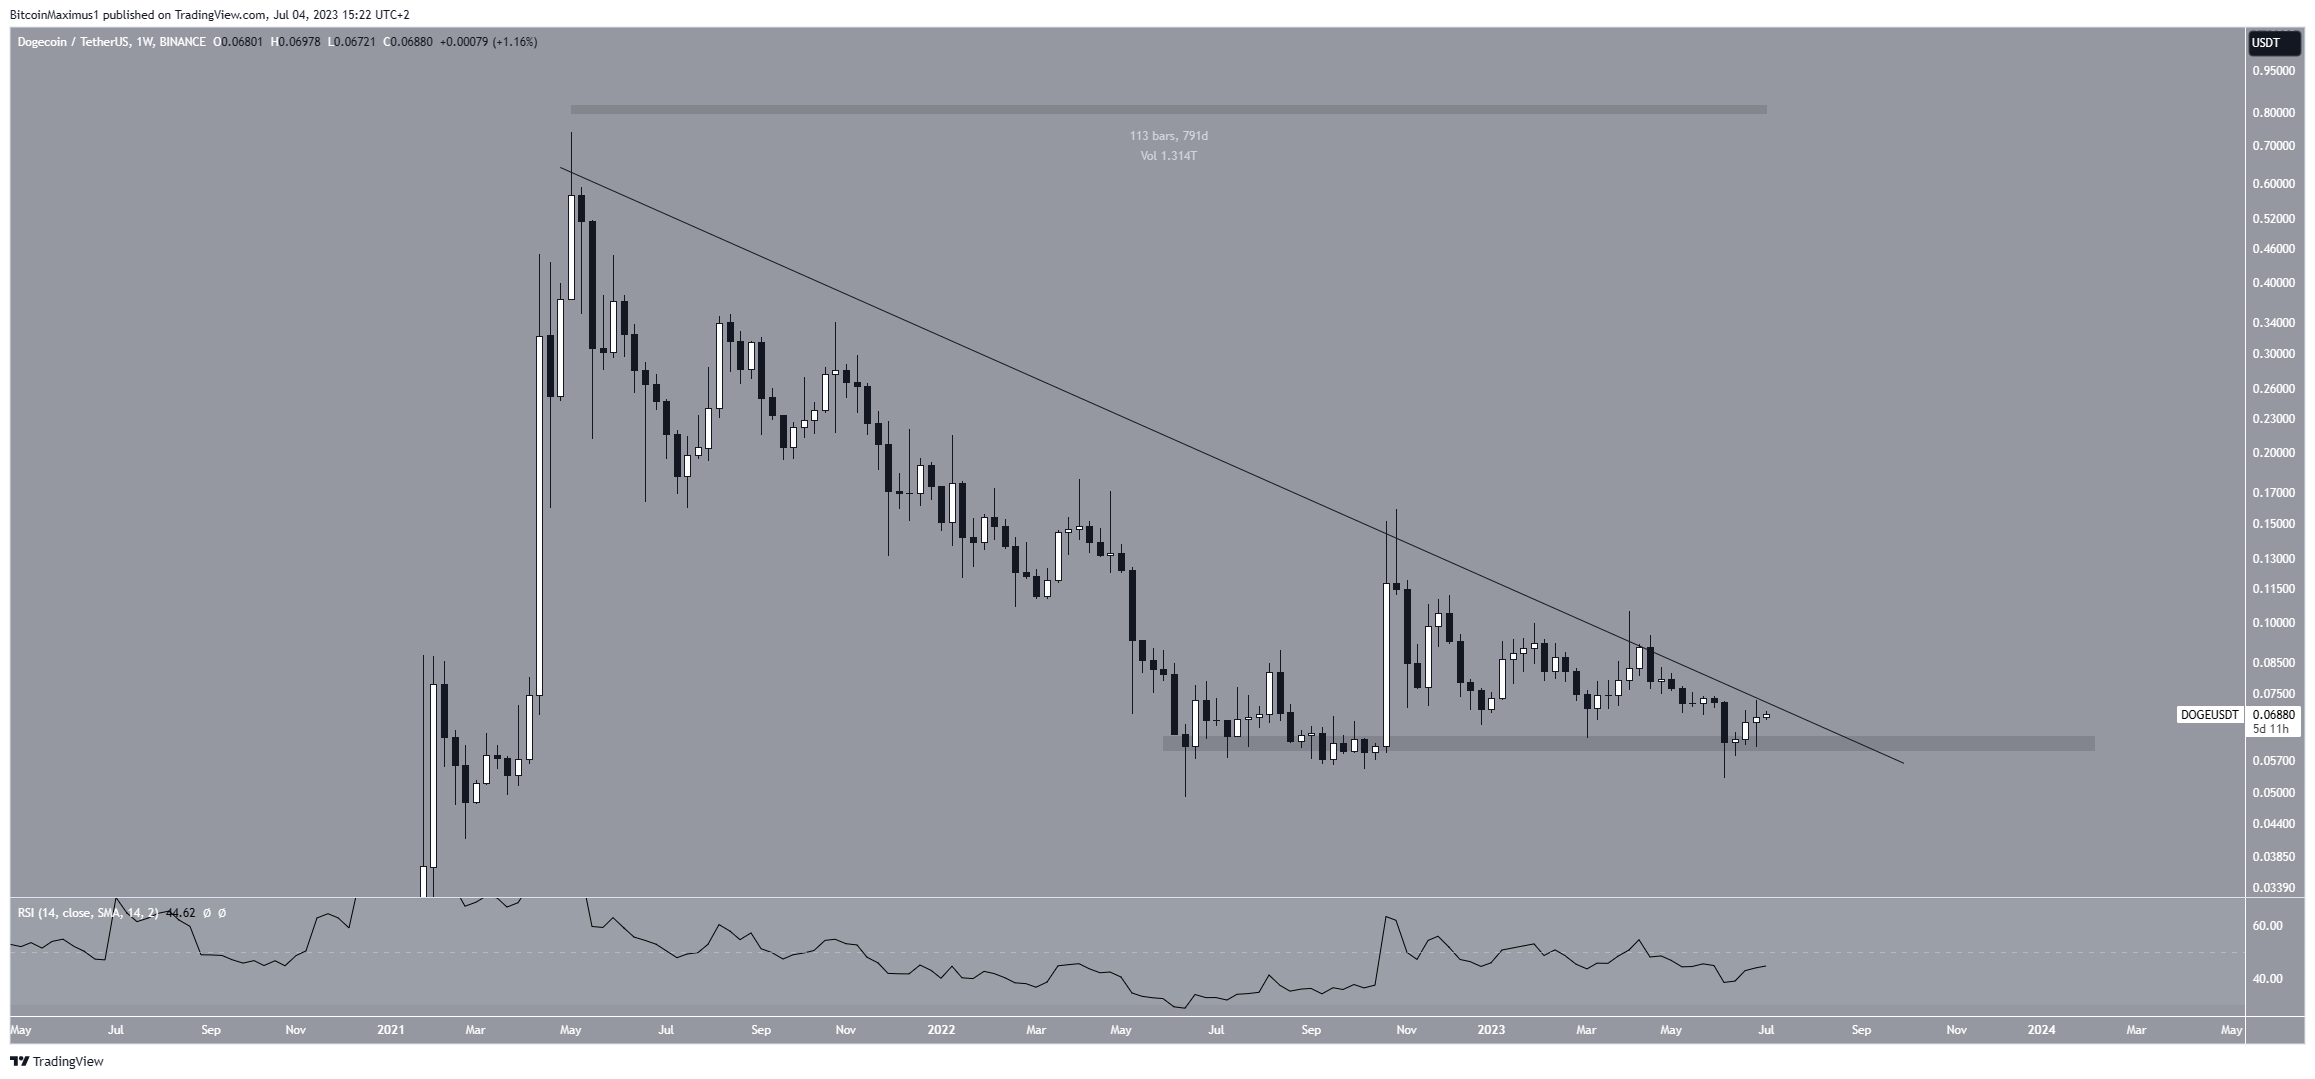
Readings above 50 and an upward trend suggest that bulls still have an advantage. On the other hand, readings below 50 indicate the opposite.
The RSI is increasing but is still below 50, a sign of an undetermined trend. An RSI movement above 50 combined with a DOGE breakout from the descending resistance line is required to confirm the trend as bullish.
Read More: Best Upcoming Airdrops in 2023
DOGE Price Reclaims Level After Failed Breakdown
The daily time frame technical analysis for the Dogecoin price provides a bullish outlook. The main reason for this is the deviation (green circle) below the $0.065 horizontal area and subsequent reclaim. Sharp increases often follow these movements since they indicate that buyers took over after a failed attempt by the sellers to cause a breakdown.
Afterward, the DOGE price broke out from a 79-day descending resistance line. This further supports the possibility that the price has begun a bullish reversal. The DOGE price is now trading just below the 0.382 Fib retracement resistance level at $0.073 since the first attempt at breaking out was unsuccessful (red icon).
Fibonacci retracement levels operate on the principle that after a significant price change in one direction, the price will retrace or revisit a previous price level before resuming in its original direction. So, a movement above the 0.382 Fib will go a long way in suggesting that the trend is now bullish.
If the meme coin successfully breaks out, the next resistance will be at $0.086, created by the 0.618 Fib retracement resistance level.
The daily RSI supports the validity of the breakout and ongoing upward movement. The indicator broke out from a descending resistance line (green line) and is now above 50. Both these are considered signs of a bullish trend.
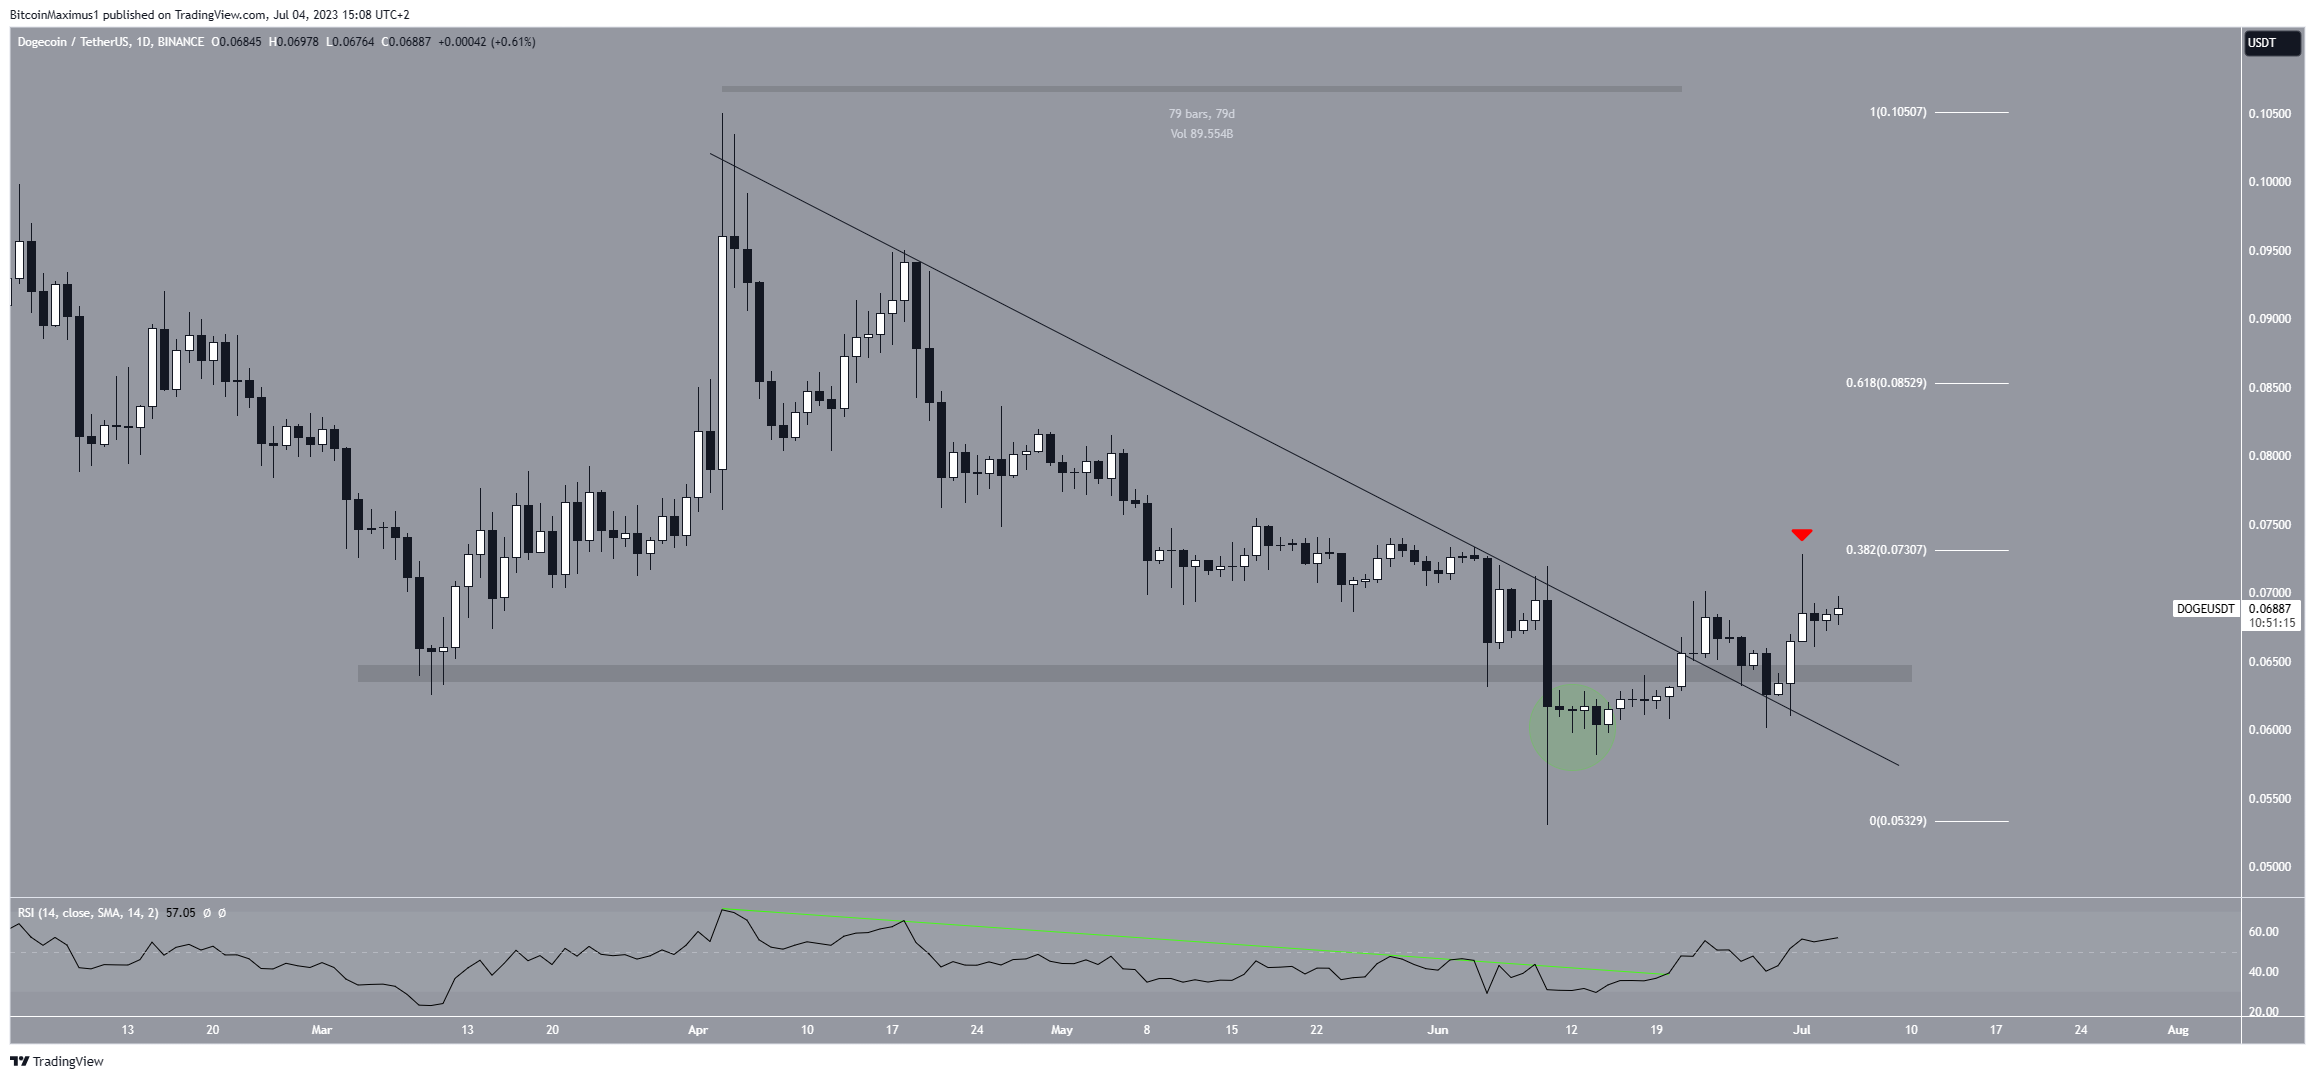
Despite this bullish DOGE price prediction, failure to break out from the $0.073 region could lead to another retest of the $0.065 horizontal support area and potentially the long-term $0.060 one.
However, the long-term trend remains bullish if the DOGE price does not break below the latter.
More From BeInCrypto: 9 Best AI Crypto Trading Bots to Maximize Your Profits
For BeInCrypto’s latest crypto market analysis, click here.


