
The Bitcoin (BTC) price movement in February has been bullish and is approaching an all-time high.
These four crypto traders successfully predicted the BTC price movement in February, achieving significant gains.
Bitcoin Price Increases After Deviation
On February 7, InmortalCrypto tweeted a Bitcoin chart that shows a deviation below a key horizontal support area. Comparing it to the previous times this had occurred, he predicted the BTC price would increase significantly afterward.
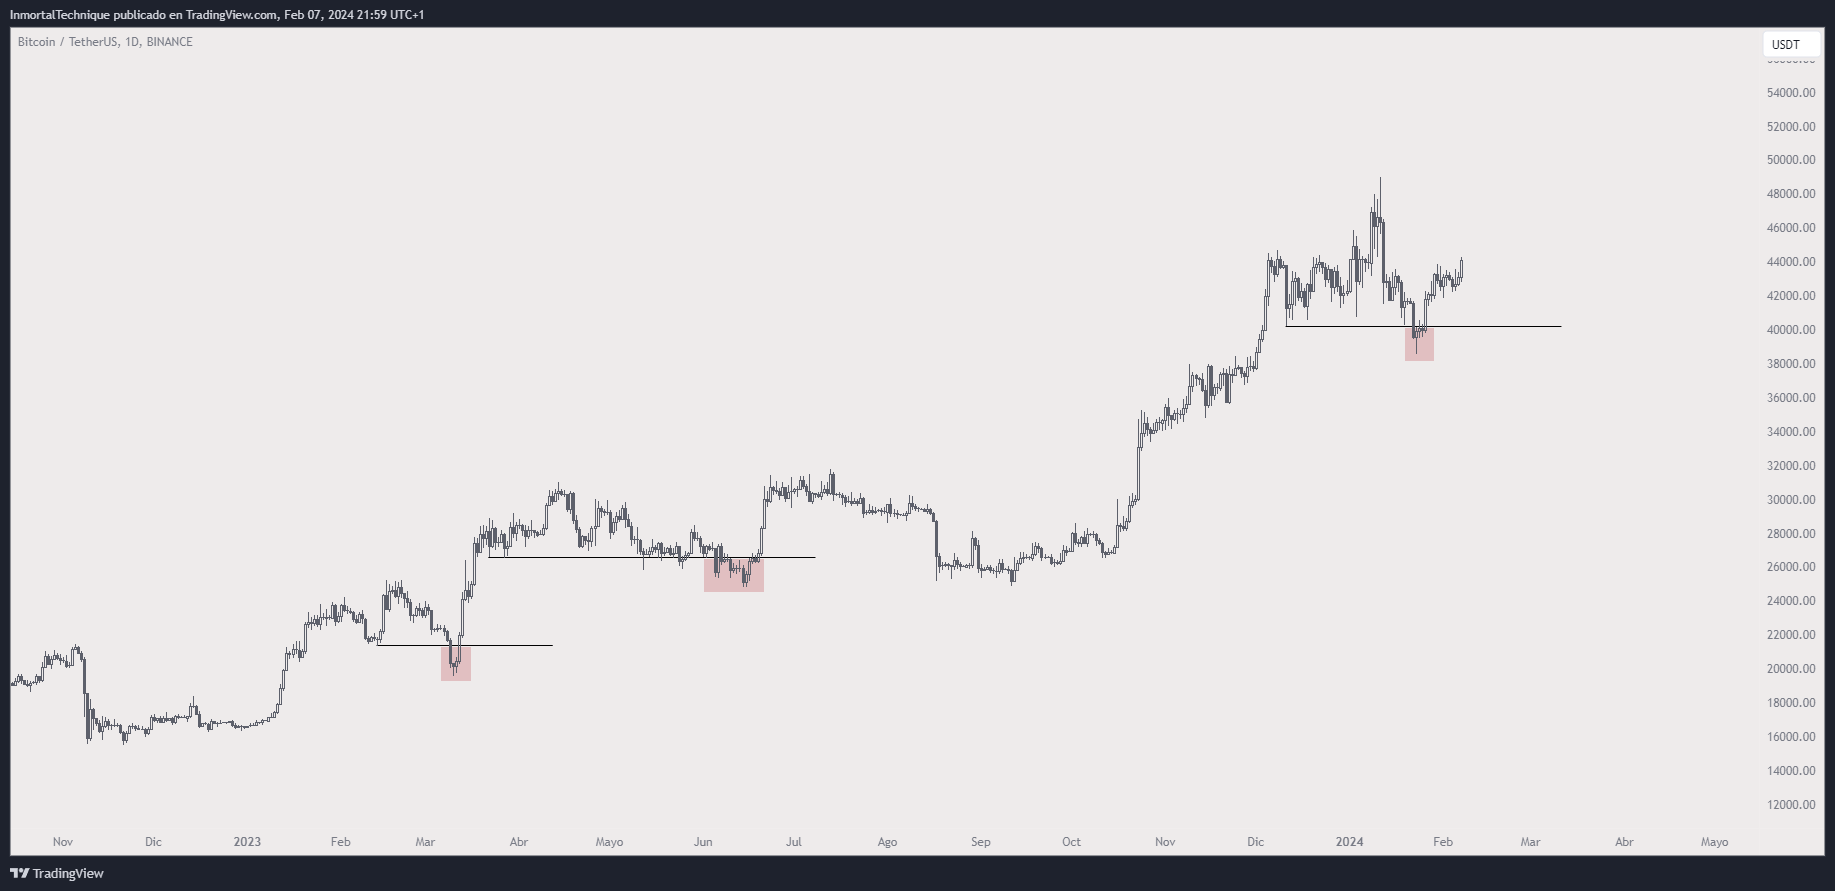
A similar outlook was given by Dentoshi, who instead used a shorter-term chart. Both predictions proved to be correct. Will Clemente also predicted the increase, though he suggested that higher-than-expected Coinbase earnings can be the catalyst.
The BTC price has increased since January 23, when it deviated below the $40,000 horizontal support area (green). Instead of causing a breakdown, the BTC price reclaimed the area three days later and has accelerated since. The upward movement may have been a five-wave increase. If so, BTC is in this upward movement’s fifth and final wave.
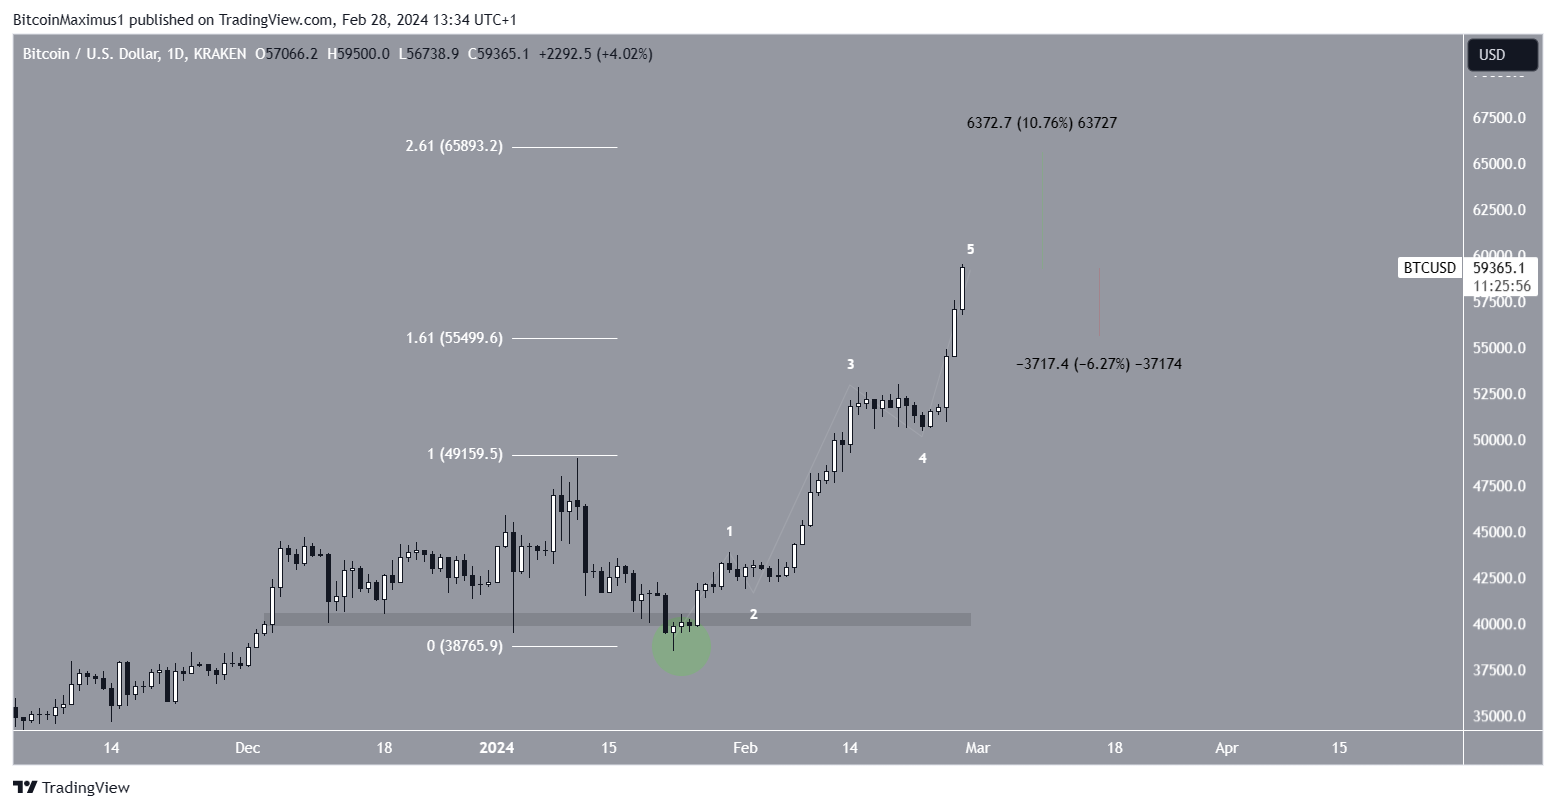
Using Fib levels of the previous decrease, the next resistance area is at $65,900, 10% above the current price. On the other hand, the closest support area is at $55,500, 6% below the current price.
Read More: Where To Trade Bitcoin Futures
Range Movement Nearly Leads to New All-Time High
The final crypto trader who predicted the BTC price movement is DamskoTrades. He tweeted a February 7 chart showing the BTC price as a fractal compared to the prices of tech companies such as Google and Meta. The fractal predicts that BTC will move above the middle of its range and toward its high range.
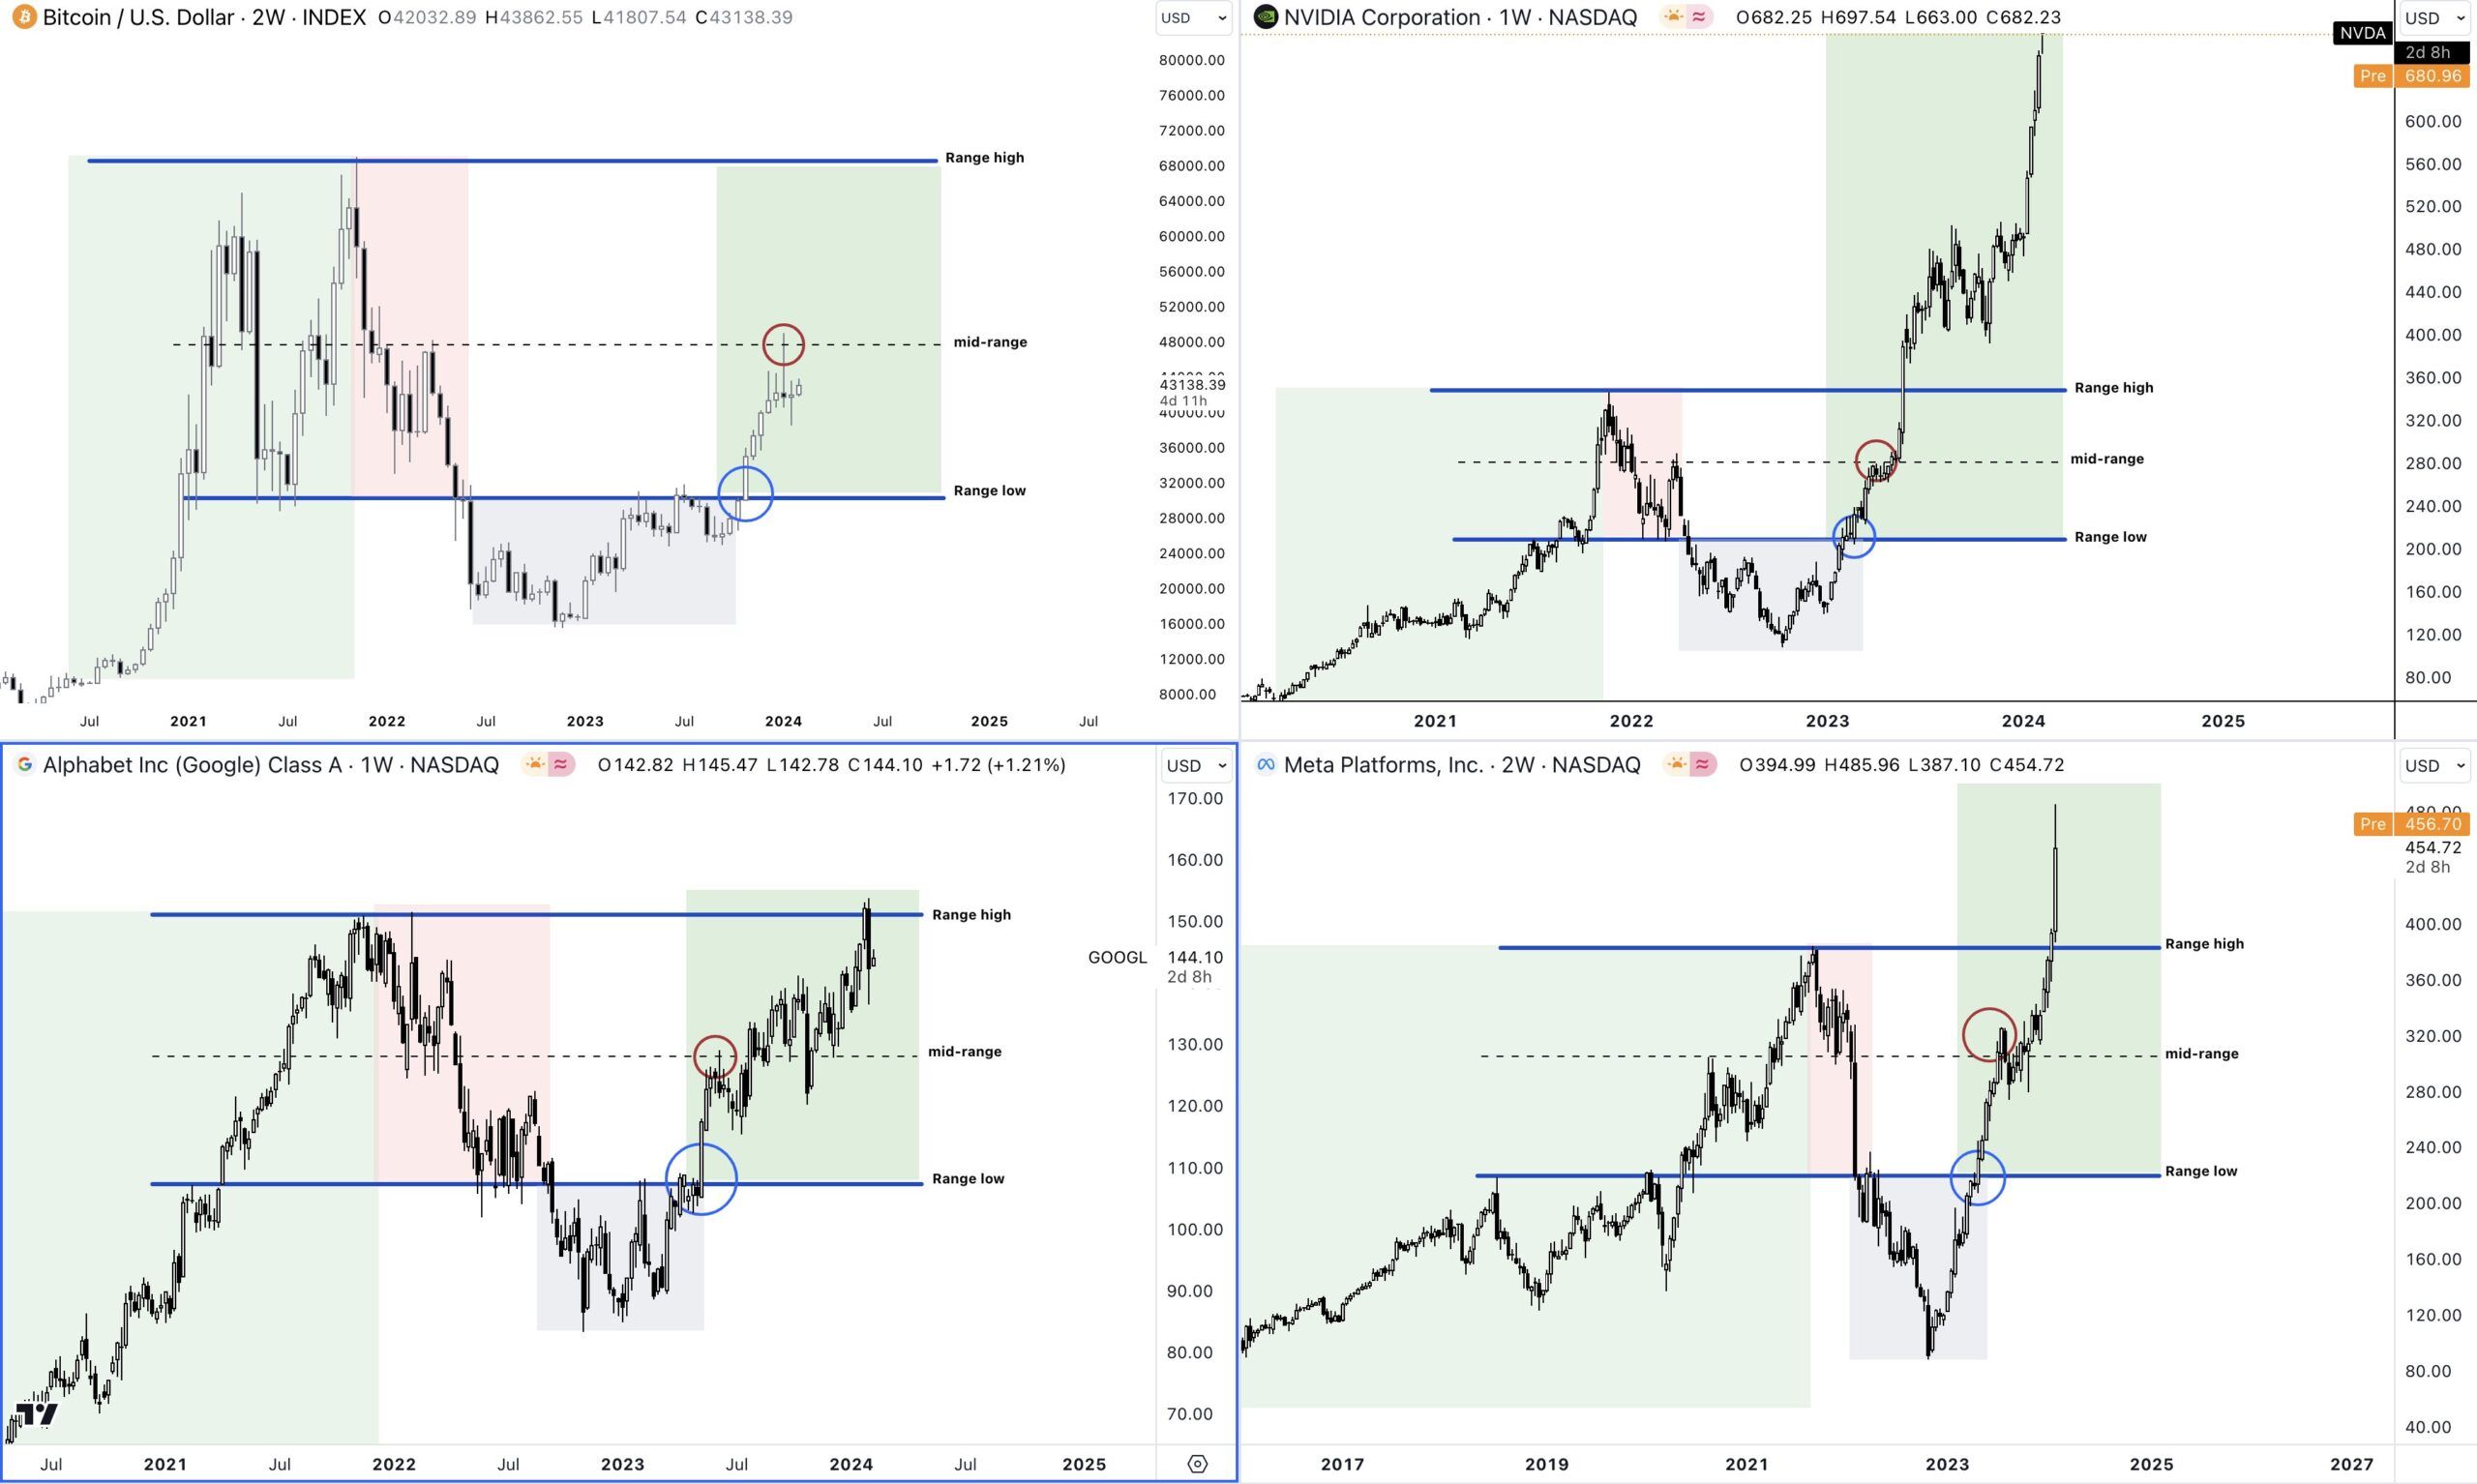
Since breaking out from the mid-range, the BTC price has increased significantly. Today, it nearly reached the final resistance area before an all-time high at $60,000.
A breakout from this area can lead to a 16% increase to its all-time high of $69,000.
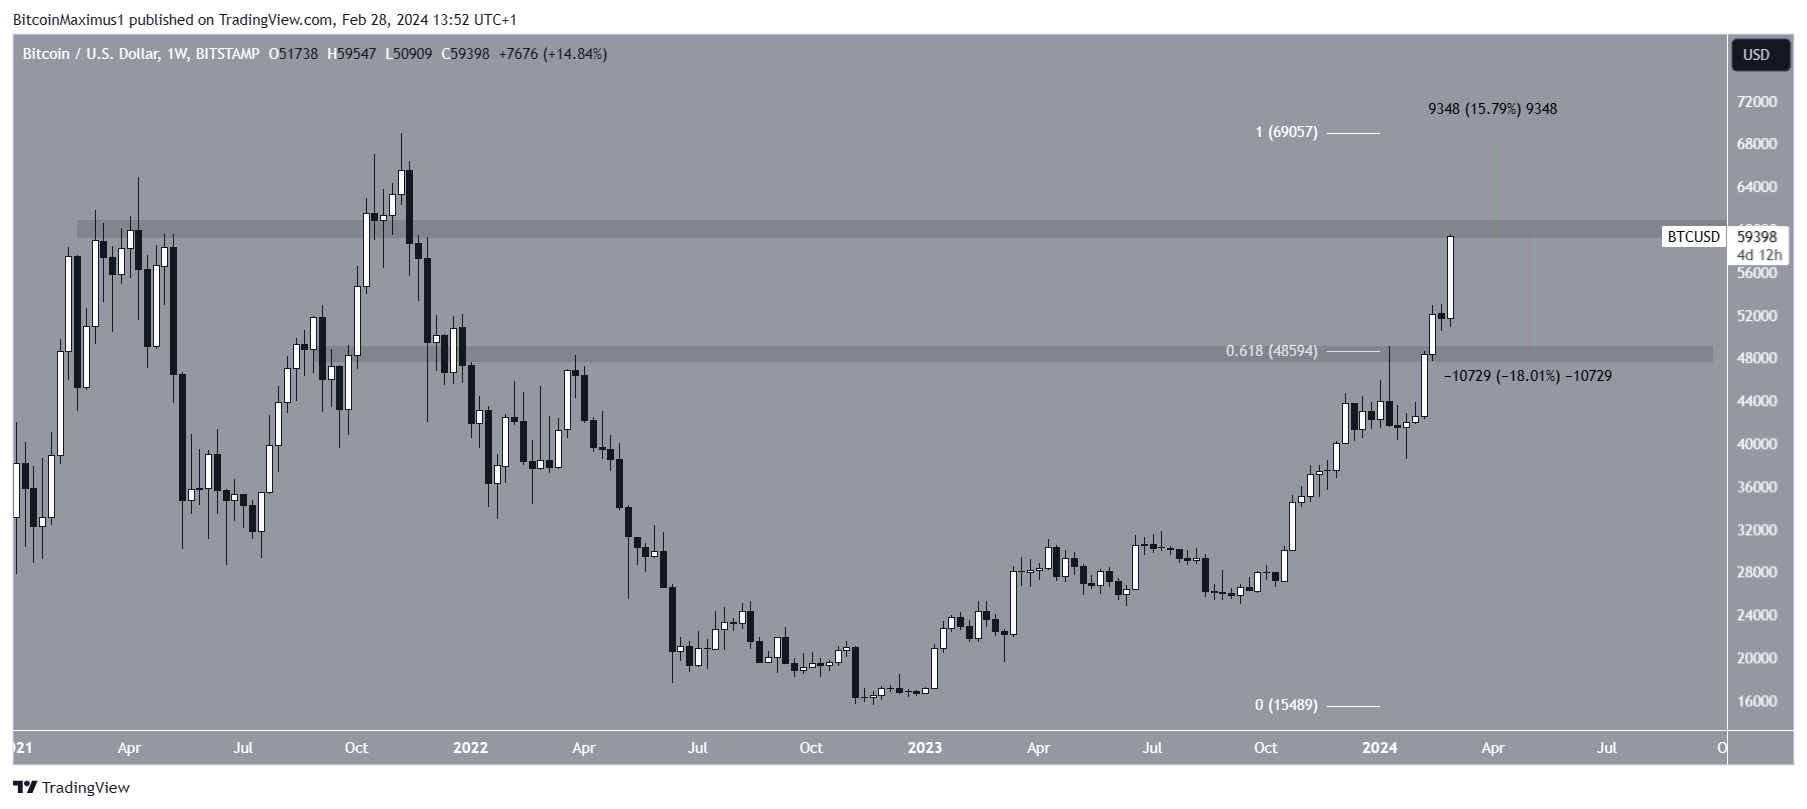
Conversely, a rejection from this area can trigger an 18% drop to the closest support at $48,600.
Read More: Who Owns the Most Bitcoin in 2024?
Afterward, at least a 12% decrease and possibly a 19% drop to the 0.5 or 0.618 Fib retracement support levels will be expected to occur.
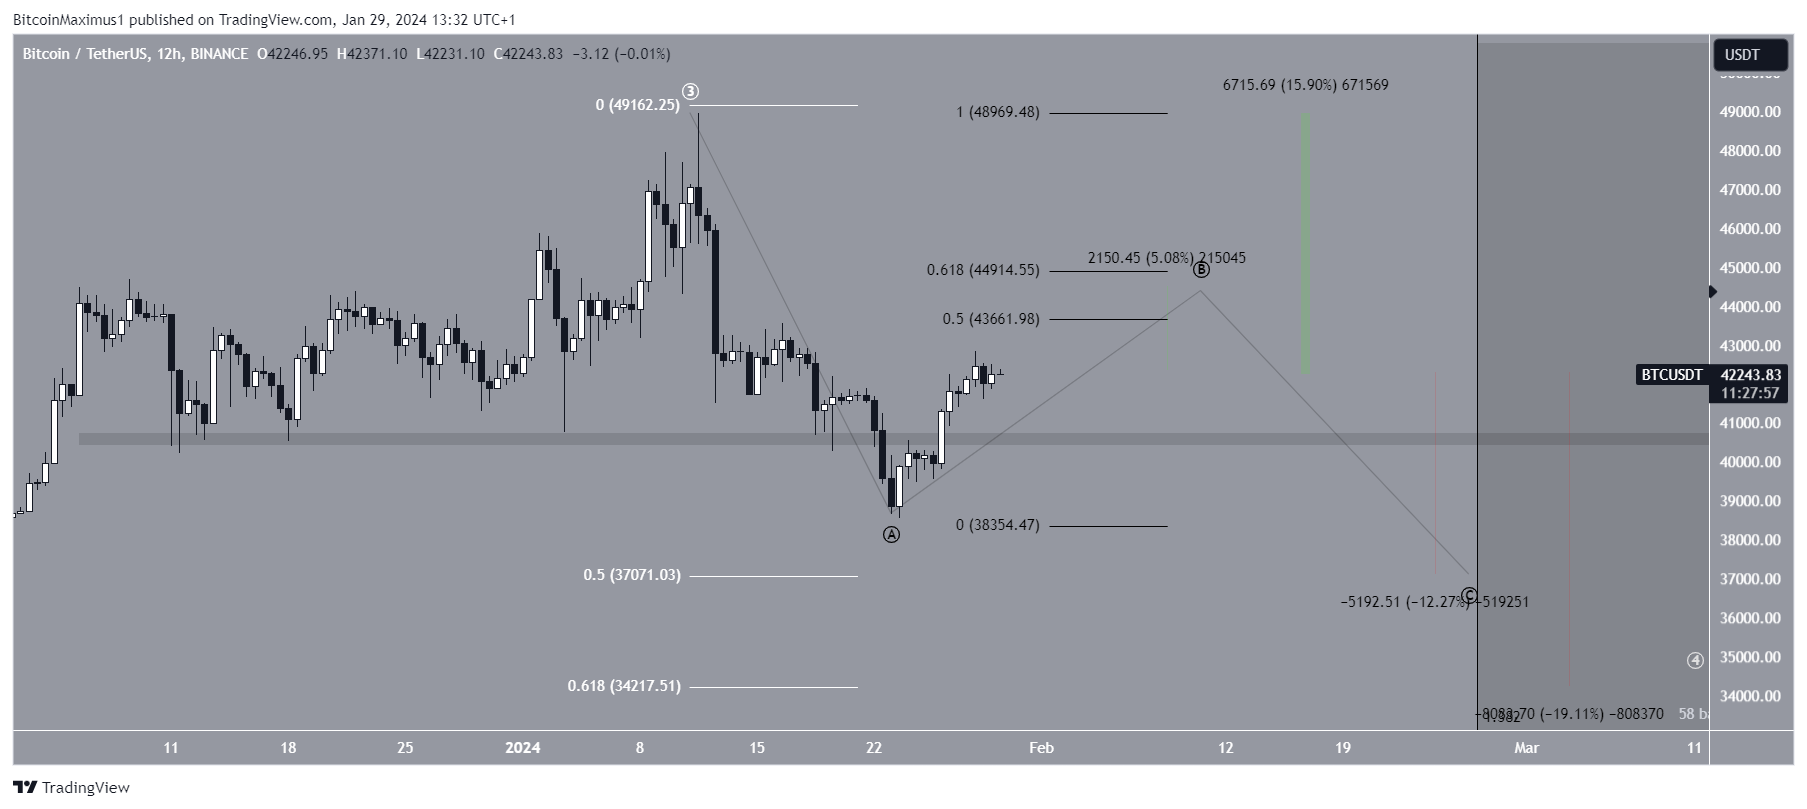
Despite this bearish BTC price prediction, a decisive close above the 0.618 Fib retracement resistance at $44,900 will complete the correction. Then, Bitcoin can increase by 16% to its previous high of $49,000.
Read More: What is a Bitcoin ETF?
For BeInCrypto‘s latest crypto market analysis, click here.
