


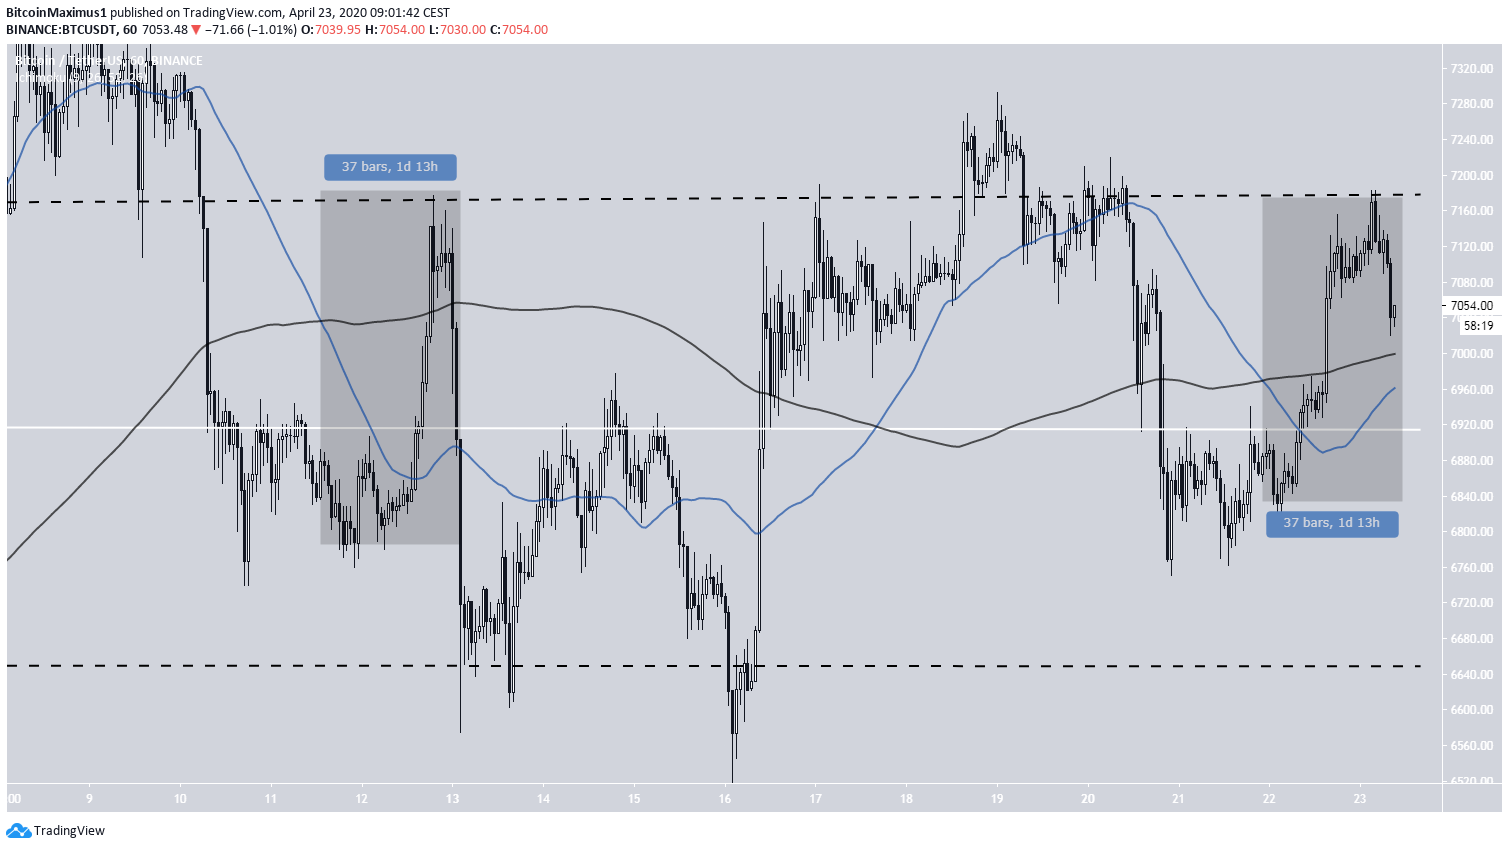
On April 22, the Bitcoin price increased considerably, creating a bullish engulfing candlestick in the process. However, it has yet to break out above a crucial resistance level. Until it does so, yesterday’s high is still considered a lower high.
With the upcoming halvening in May, Bitcoin is at a very interesting time. The effect of this event on the price of BTC is still unclear.
In this article, we will analyze 10 coins individually and determine their expected future movements.
Bitcoin (BTC)
On April 22, the Bitcoin price was rejected by the resistance line of its $6,650-$7,150 trading range. Interestingly, the price has moved above both the 50- and 200-hour moving averages (MAs), even though they have made a bearish cross.
The same bearish cross transpired previously on April 11. During the time, the price similarly increased above these MAs in order to touch the resistance line of the range. Afterward, a sharp drop followed that took the price all the way down to the support line of the range.
If the price acts in a similar manner this time around, it will break down today, initiating a rapid downward move towards the support line of this range, found at $6,650.
Ethereum (ETH)
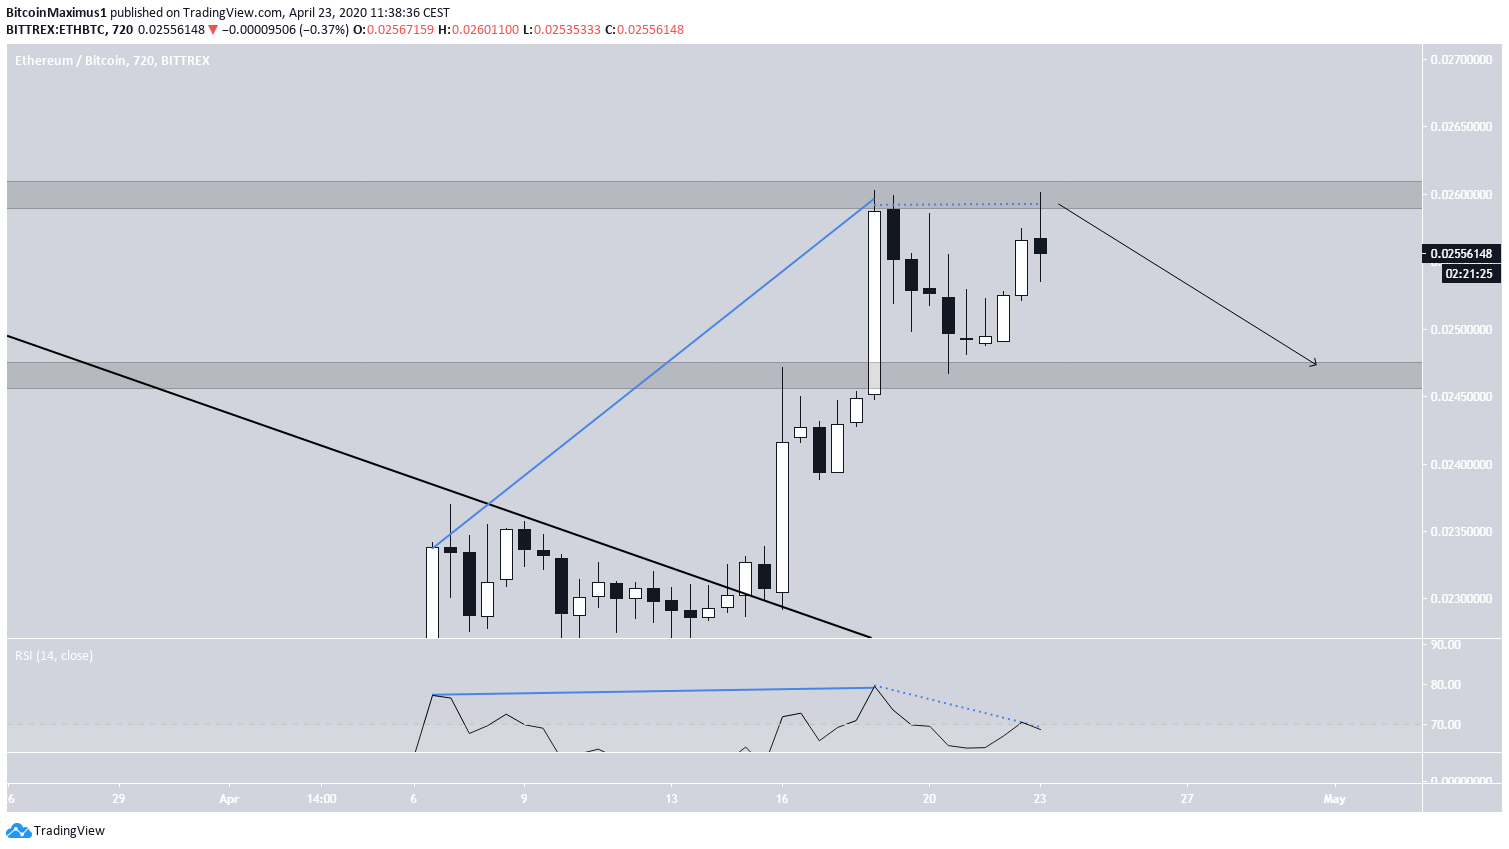
The Ethereum price has been increasing since breaking out from its descending resistance line on April 16. The increase continued for the next two days, when the price reached a high of ₿0.026 on April 18. ETH has been decreasing since.
On April 23, the price reached this resistance area once more but created a long upper wick and has slightly decreased since. The price movement between these two dates resembles a double top, which is considered a bearish reversal pattern.
The price outlook is bearish, at least in the short-term. There are two instances of bearish divergence in the RSI, one between the highs on April 7 and 18 (solid) and the other in the double top of April 18 and 23 (dashed).
These signs suggest that the price is likely to move downwards, possibly towards the support area of ₿0.0245.
XRP (XRP)
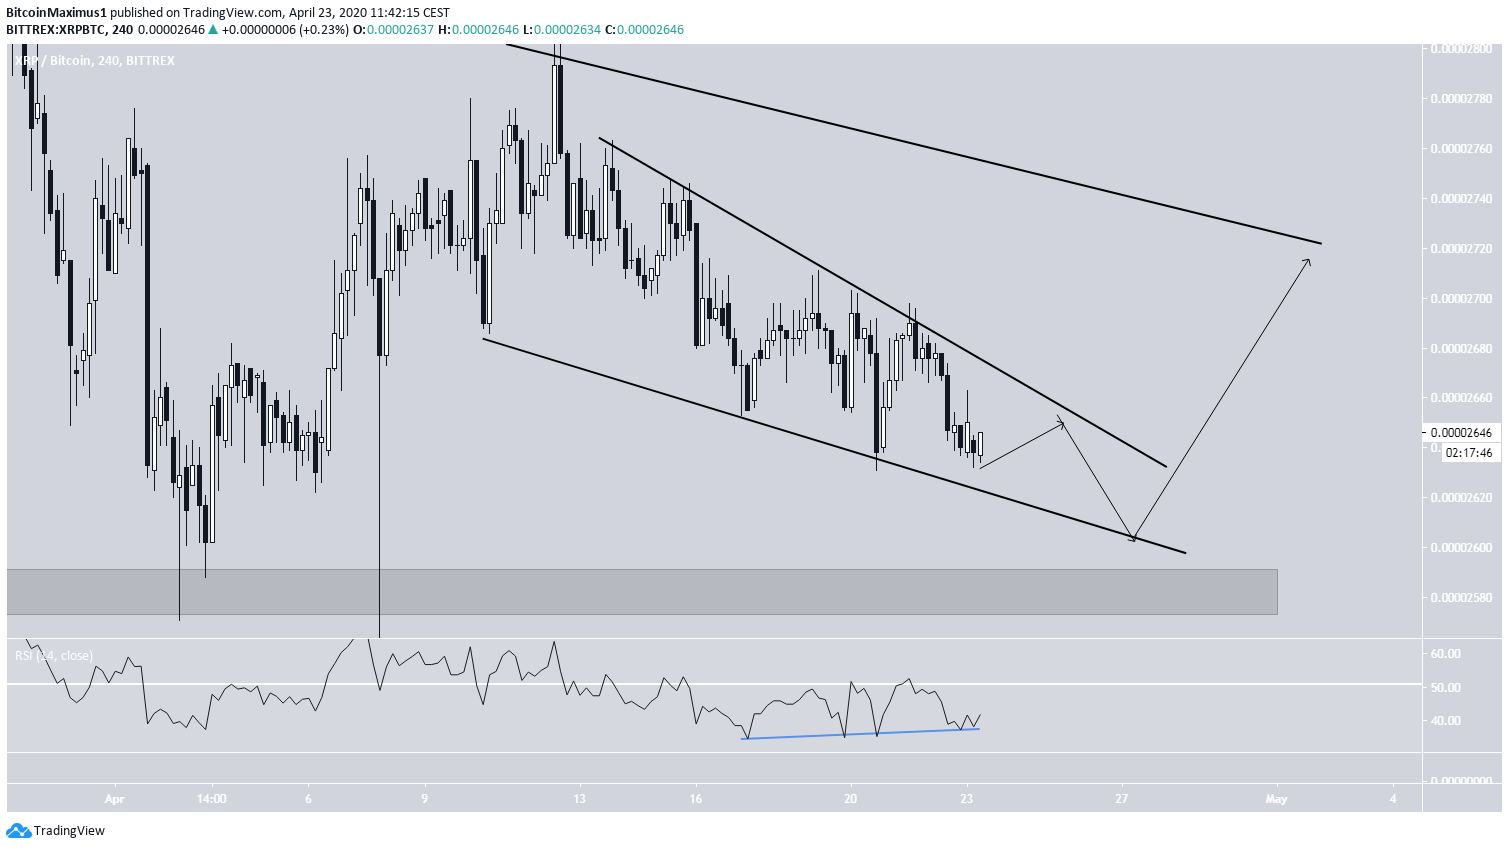
The XRP price has been decreasing gradually since April 12, when the price reached its long-term descending resistance line. Since then, the decrease has taken the shape of a descending wedge, which is considered a bullish reversal pattern.
To further strengthen the possibility of a breakout, there is a growing bullish divergence developing in the RSI. This suggests that the price will move upwards, possibly tagging the long-term descending resistance line once more.
In addition, there is a strong support area at 2,500 satoshis, which will eventually coincide with the support line of the descending wedge. Therefore, the price is expected to continue decreasing inside the wedge, at most until it reaches 2,500 satoshis before breaking out towards the resistance line.
Bitcoin Cash (BCH)
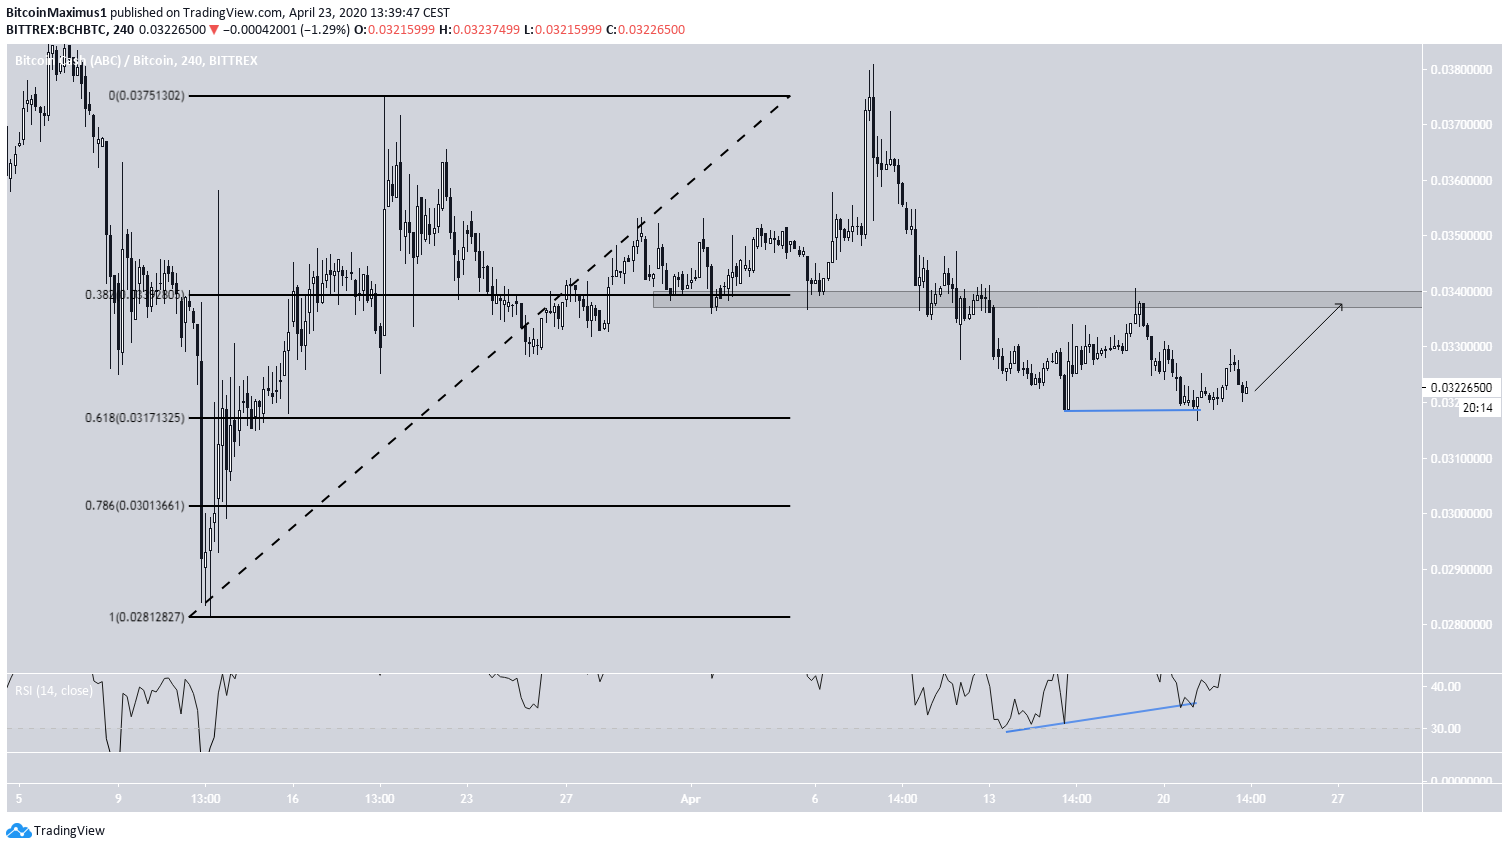
The BCH price has been decreasing since April 8, when it reached a high of ₿0.038. The decrease continued until the price reached a low of ₿0.0318 on April 16. After a brief increase, which validated the ₿0.034 level as resistance, the price dropped once more, creating a double bottom at the April 16 level.
The double bottom is considered a bullish reversal pattern. In addition, it is combined with bullish divergence in the RSI. Therefore, the price is expected to increase once more and touch the resistance area at ₿0.034.
However, until the price reclaims this area as support, its outlook is still considered bearish.
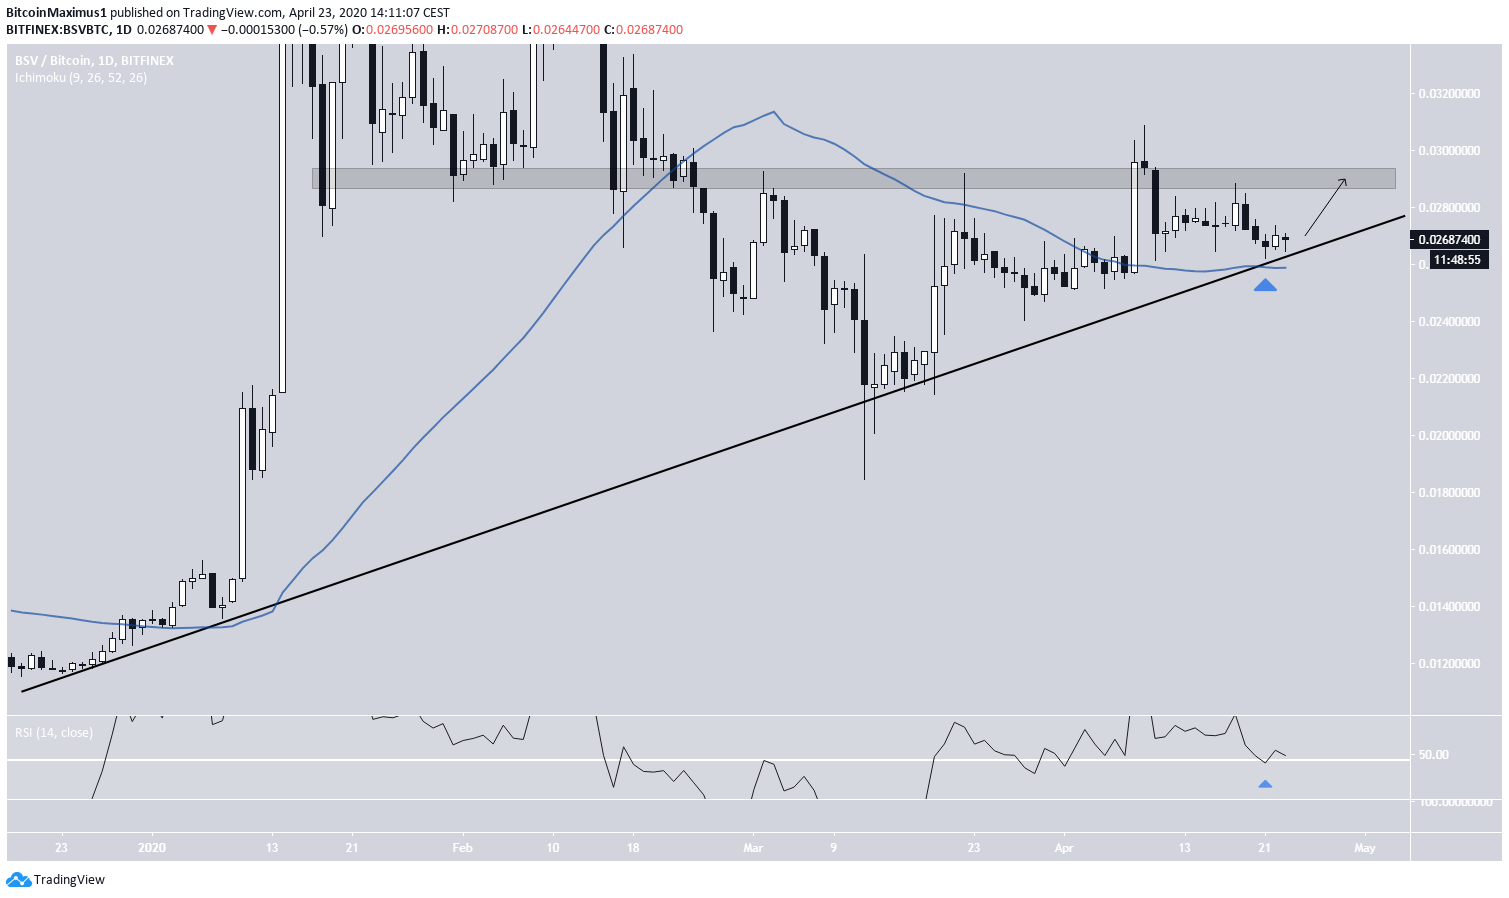
Bitcoin SV (BSV)
The BSV price has been following an ascending support line since December 2019. The line has been validated numerous times. At the time of writing, the price was trading slightly above this support line.
The relation of the price to technical indicators is bullish. BSV has validated the 50-day moving average (MA) as support, strengthening the significance of the ascending support line. In addition, the daily RSI has touched the 50 line from above, validating it as support.
Therefore, the price is expected to increase and reach the resistance area at ₿0.029. A breakout above this level could greatly accelerate the rate of increase. However, at the time of writing, it is still unclear whether this breakout will actually occur.
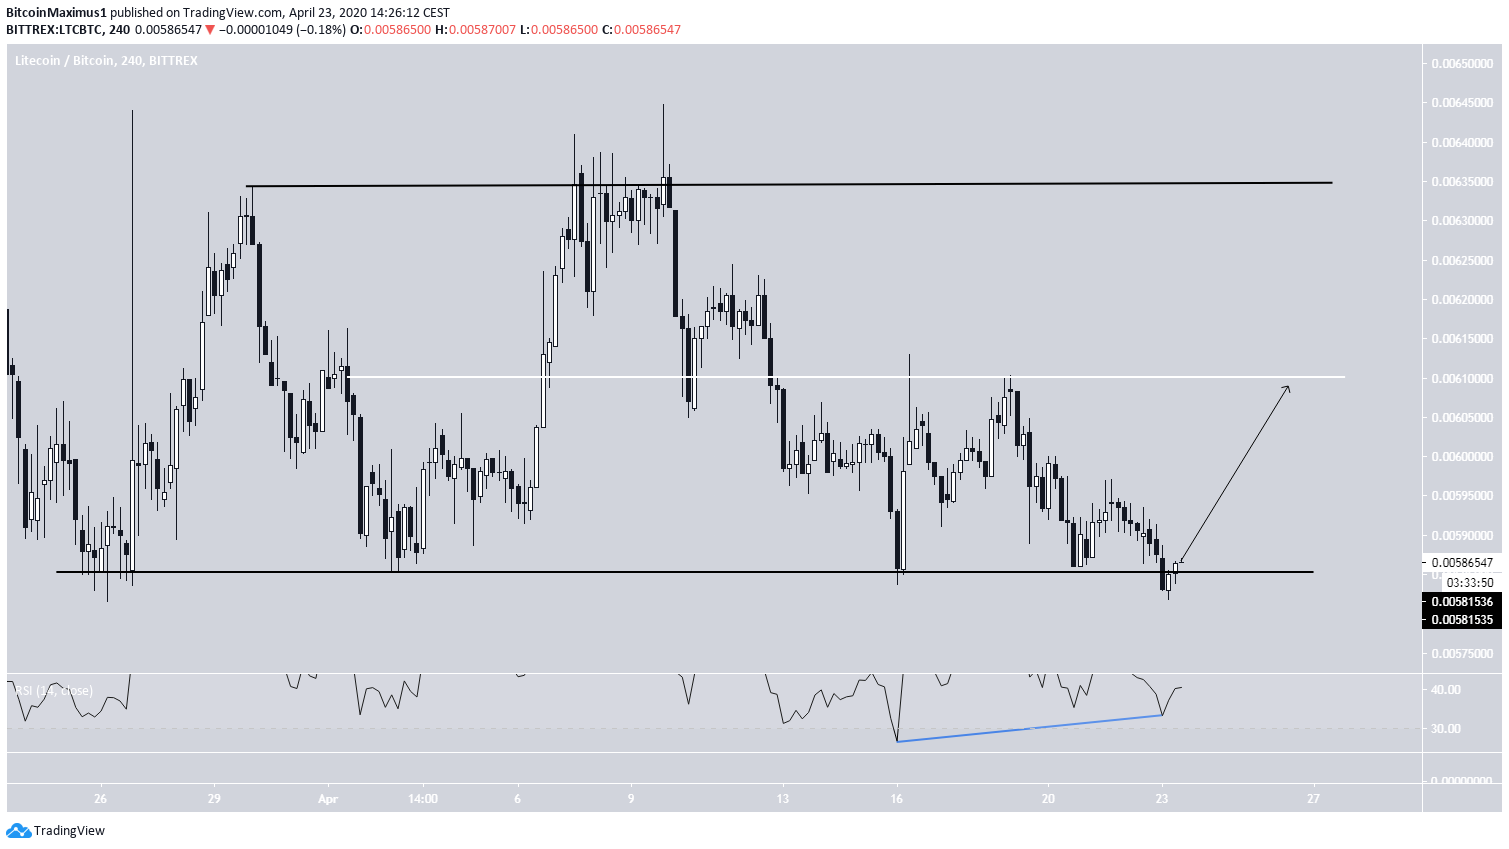
Litecoin (LTC)
The Litecoin price is trading in a range with a lower and upper limit of ₿0.00585 and ₿0.00635, respectively. It has been doing so since March 25. Yesterday, the price briefly broke down below the support of this trading range but has reclaimed it since. Furthermore, the price has been generating bullish divergence for at least the past week.
The reclaim of a previous support level after it has been broken down often has bullish implications for the price, suggesting that it will move upwards towards the resistance line of the range. However, the price is likely to face initial resistance at the EQ of the range at ₿0.0061.
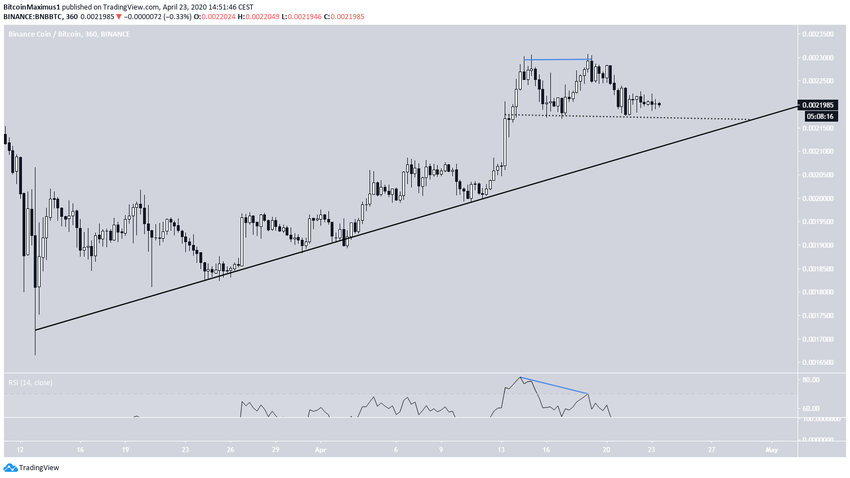
Binance Coin (BNB)
The Binance Coin price has been following an ascending support line since March 13, increasing gradually at the rate predicted by it. On April 13, the price accelerated its rate of increase, reaching a high of ₿0.0023 the next day.
BNB created a double-top pattern shortly after and has been decreasing ever since. The double top was also combined with bearish divergence in the RSI, strengthening the validity of the bearish pattern and suggesting that the price will go down and touch the ascending support line once more.
If the decrease is as gradual as the possible descending resistance line (dashed) suggests, the price will get there by April 29.
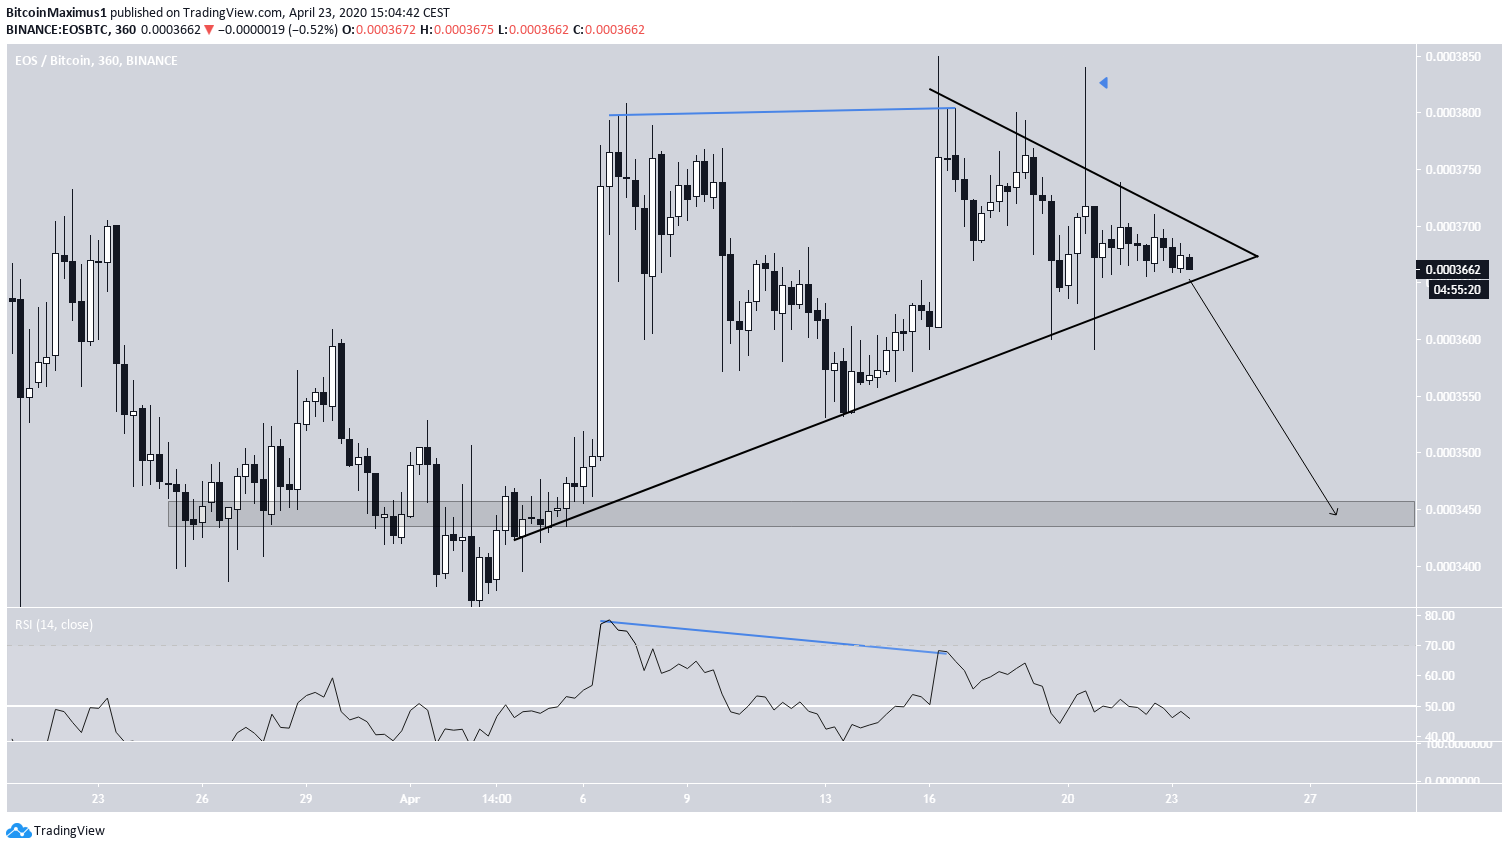
EOS (EOS)
The EOS price has been following an ascending support line since April 6, at the time of writing trading slightly above it.
On April 7, the price reached a high of 3,808 satoshis. After a brief decrease that validated the ascending support line once more, the price reached the same level on April 16, creating a double top. This bearish reversal pattern was also combined with bearish divergence in the RSI.
Since then, the price has been following a descending resistance line, which when combined with the support line creates a symmetrical triangle.
Since the symmetrical triangle is considered a neutral pattern, both a breakout and a breakdown remain likely. However, due to the bearish divergence and numerous long upper wicks, we believe a breakdown is more likely.
If the price breaks down, the closest support area is found at 3,450 satoshis.
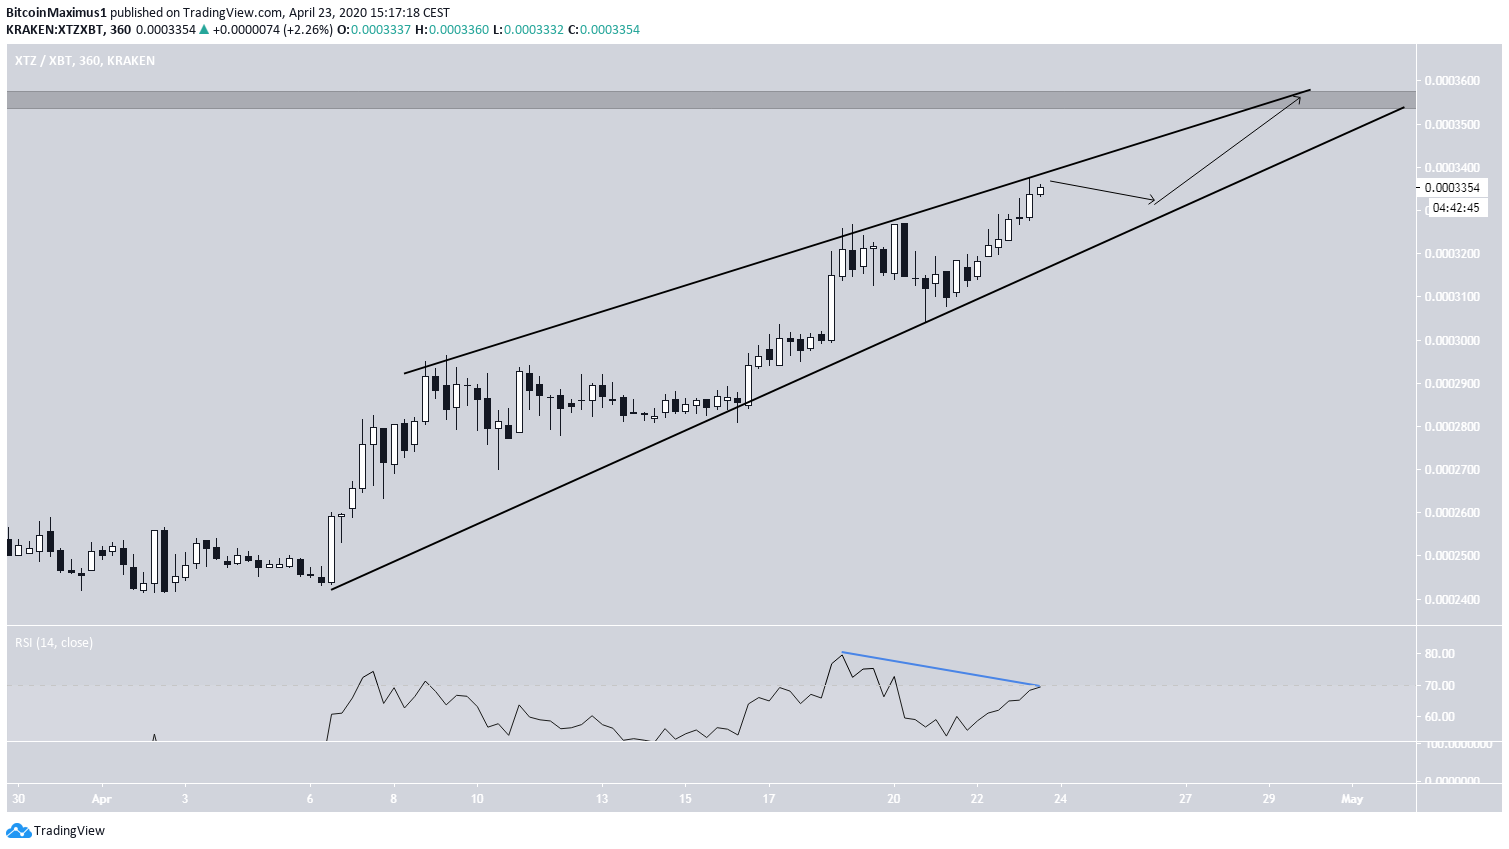
Tezos (XTZ)
The XTZ price has been increasing rapidly since April 6. The increase has taken the shape of an ascending wedge, with both the support and resistance lines having been validated thrice. The ascending wedge is considered a bearish pattern, meaning a breakdown is likely.
In addition, the RSI has already begun to generate bearish divergence. Therefore, the price is expected to continue trading inside this wedge until it eventually breaks down. The closest resistance level is is found at 350,000 satoshis, making it a likely level for the trend to reverse.
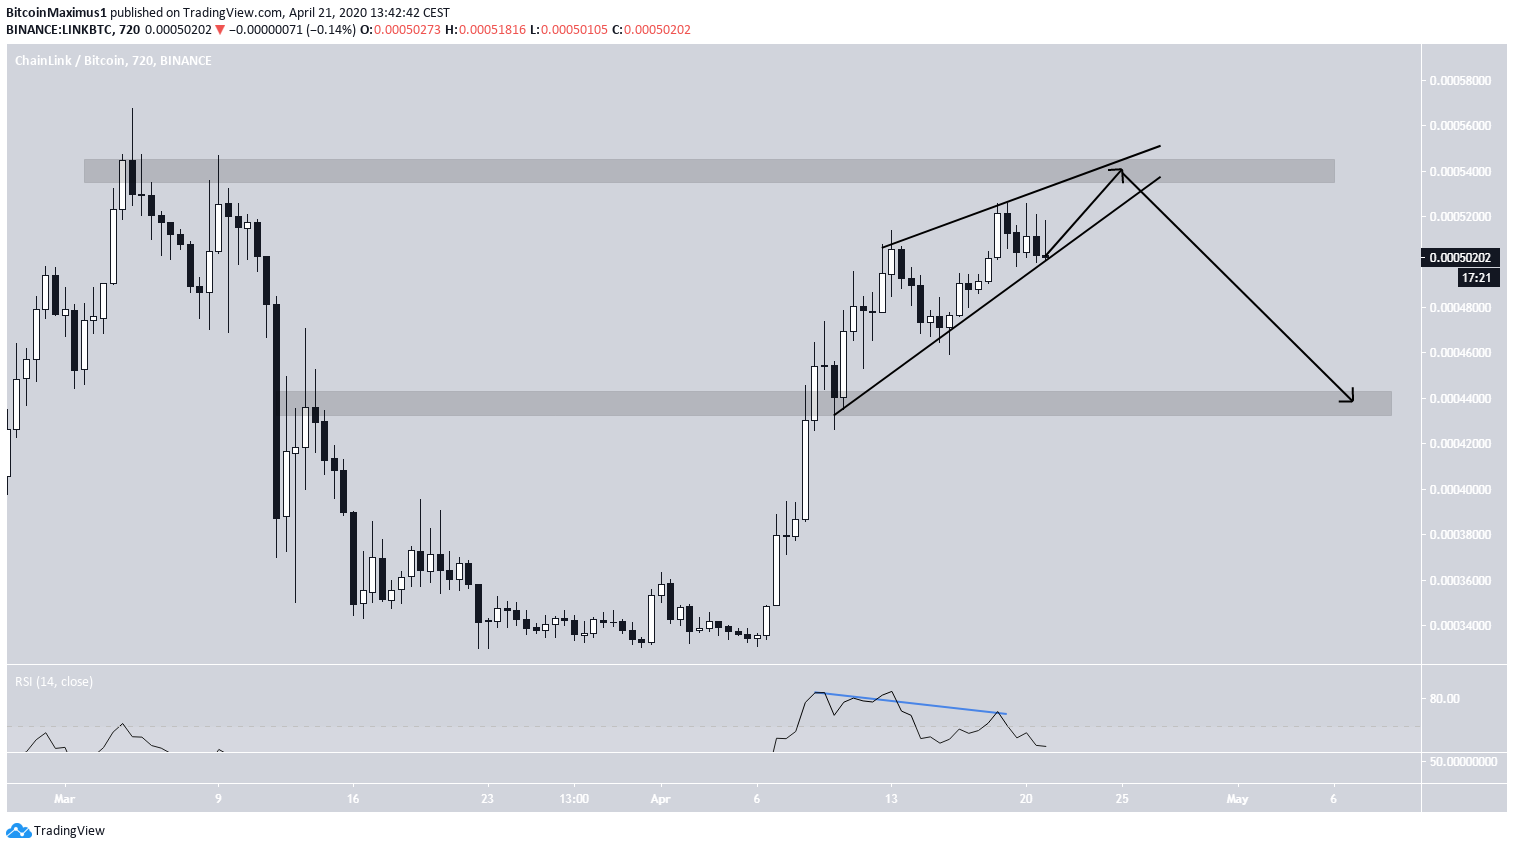
Chainlink (LINK)
The LINK price has been increasing rapidly since April 7. Beginning on April 13, the price created an ascending wedge, which is considered a bearish reversal pattern. The price has been trading inside this wedge ever since.
On April 18, the price reached the 52,000 satoshi resistance area and has created a triple top inside it, which is also considered a bearish pattern. Furthermore, this pattern is combined with bearish divergence in the RSI.
Therefore, there are three signs that suggest that LINK will break down:
- The creation of an ascending wedge.
- The creation of a triple top.
- Bearish divergence in the RSI.
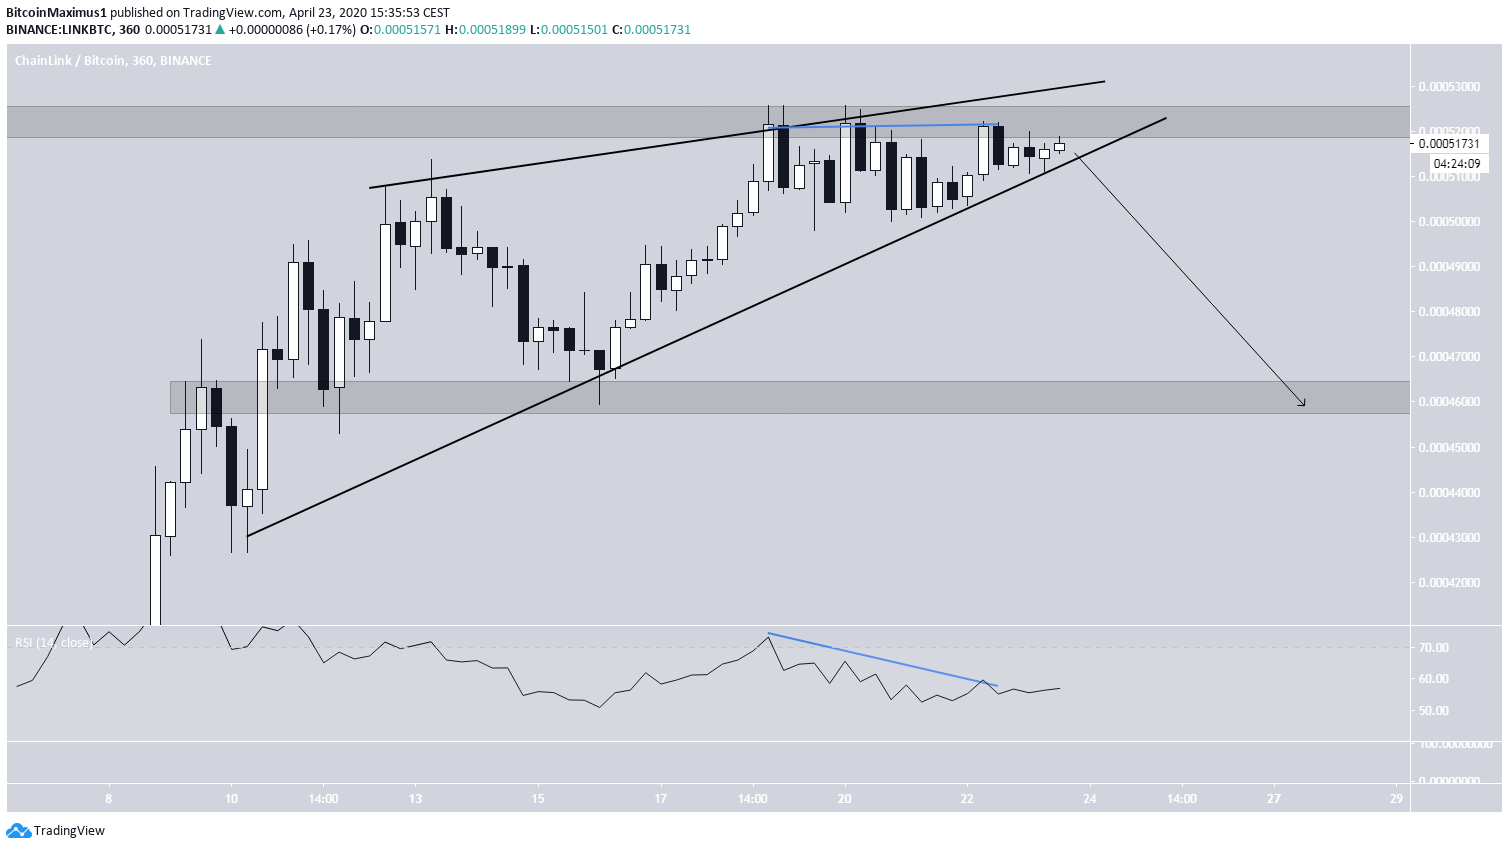
If the price breaks down, which is looking likely, the closest support area is found at 46,000 satoshis.


