


The Cardano (ADA) price has made numerous unsuccessful breakout attempts above a long-term horizontal resistance area.
Cardano follows a short-term descending resistance trend lien and is at risk of a drop below a short-term support level.
Cardano Falls After Rejection
The technical analysis of the weekly time frame shows that ADA has made six unsuccessful breakout attempts above a long-term horizontal resistance area since November 2023. These all created long upper wicks (red icons), considered signs of selling pressure.
This week, the ADA price made an unsuccessful bounce attempt. This led to another long upper wick and bearish candlestick (red circle).
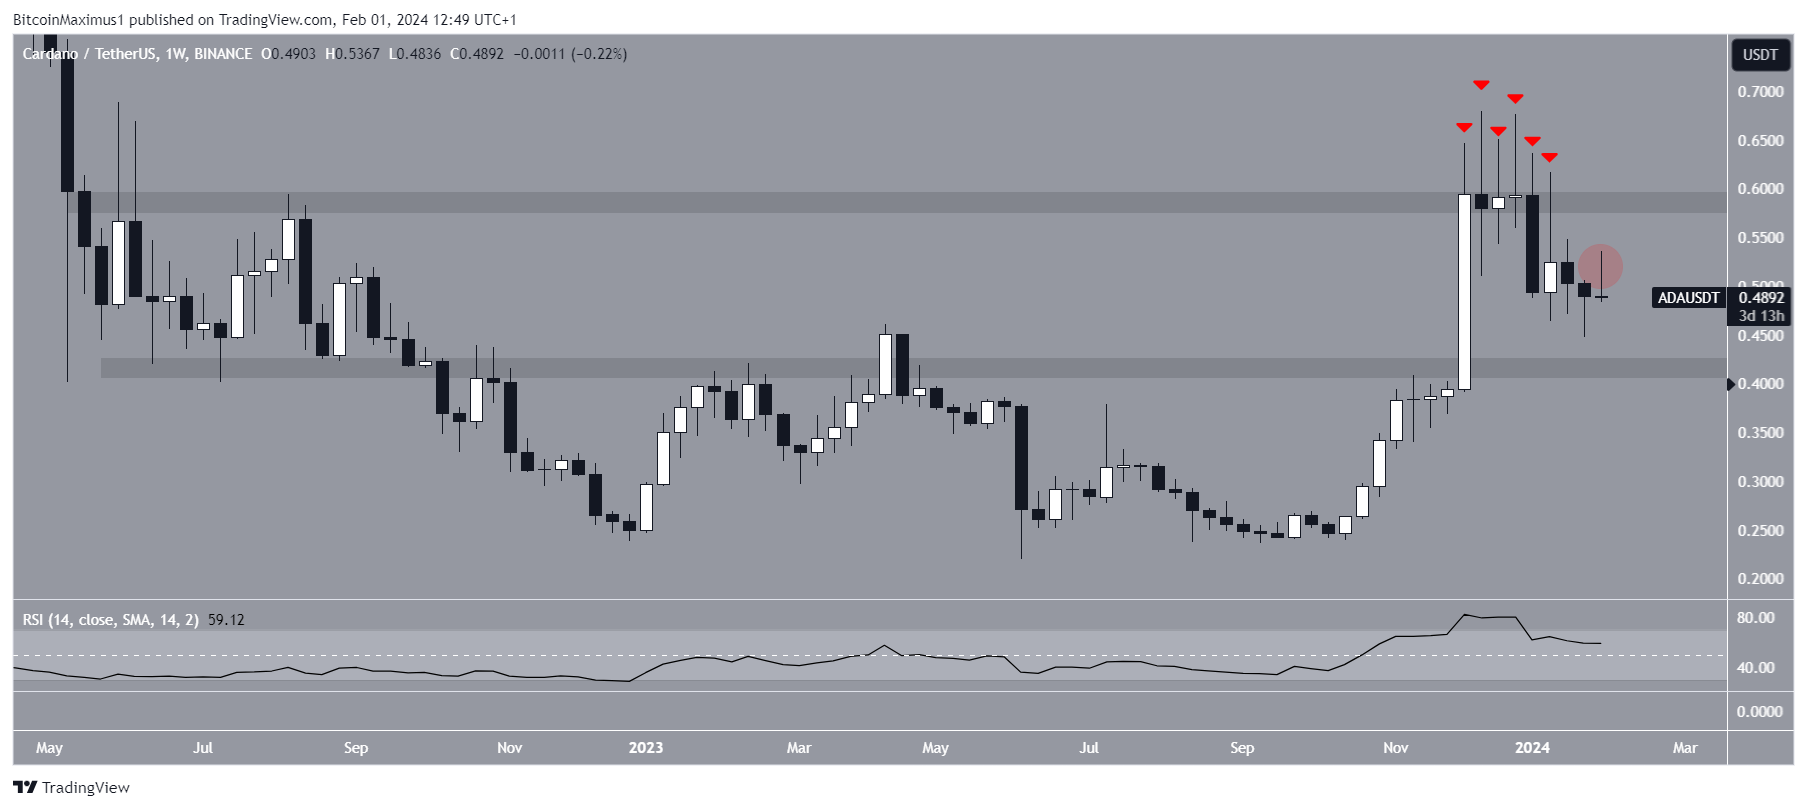
The weekly Relative Strength Index (RSI) leans bearish. Traders utilize the RSI as a momentum indicator to assess whether a market is overbought or oversold and whether to accumulate or sell an asset.
If the RSI reading is above 50 and the trend is upward, bulls still have an advantage, but if the reading is below 50, the opposite is true. Even though it is above 50, the indicator is in a downward trend.
Read More: How To Stake Cardano (ADA)
ADA Price Prediction: Is $0.40 on the Cards?
The technical analysis of the daily time frame gives a similarly bearish outlook because of the price action and RSI.
The price action shows that ADA has decreased under a descending resistance trend line since December 14, 2023. More recently, the trend line rejected the price on January 30 (red icon).
Currently, ADA is breaking down from the $0.48 horizontal support area. If Cardano falls below it, it can drop 23% to the next closest support at $0.38.
The RSI supports this possibility since it was also rejected by 50 (red circle).
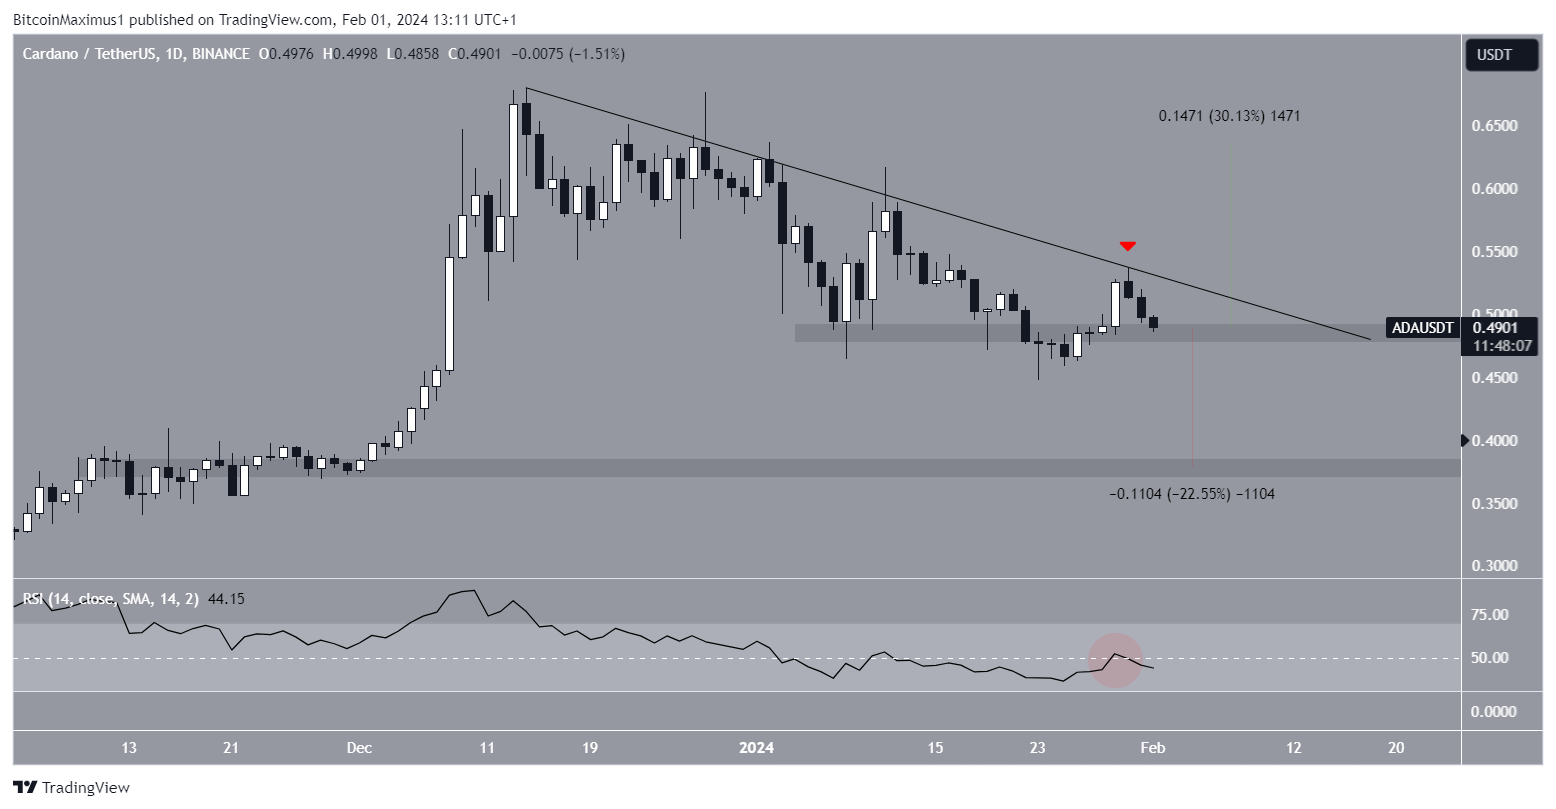
Despite the bearish ADA price prediction, a breakout from the resistance trend line can trigger a 30% ADA increase to the next resistance at $0.63.
For BeInCrypto‘s latest crypto market analysis, click here.


