


The Cardano (ADA) price created a lower high on January 11 and has fallen at an accelerated pace since.
Cardano is approaching a long-term horizontal support area, which previously provided resistance.
Cardano Sellers Take Over
The weekly time frame technical analysis shows that the ADA price has increased swiftly since September 2023. The increase culminated with a new yearly high of $0.68 in December.
While this supposedly caused a breakout above a long-term horizontal resistance area, the price could not sustain its increase. Rather, it created several long upper wicks (red icons), considered signs of selling pressure. The ADA price fell sharply at the start of 2024.
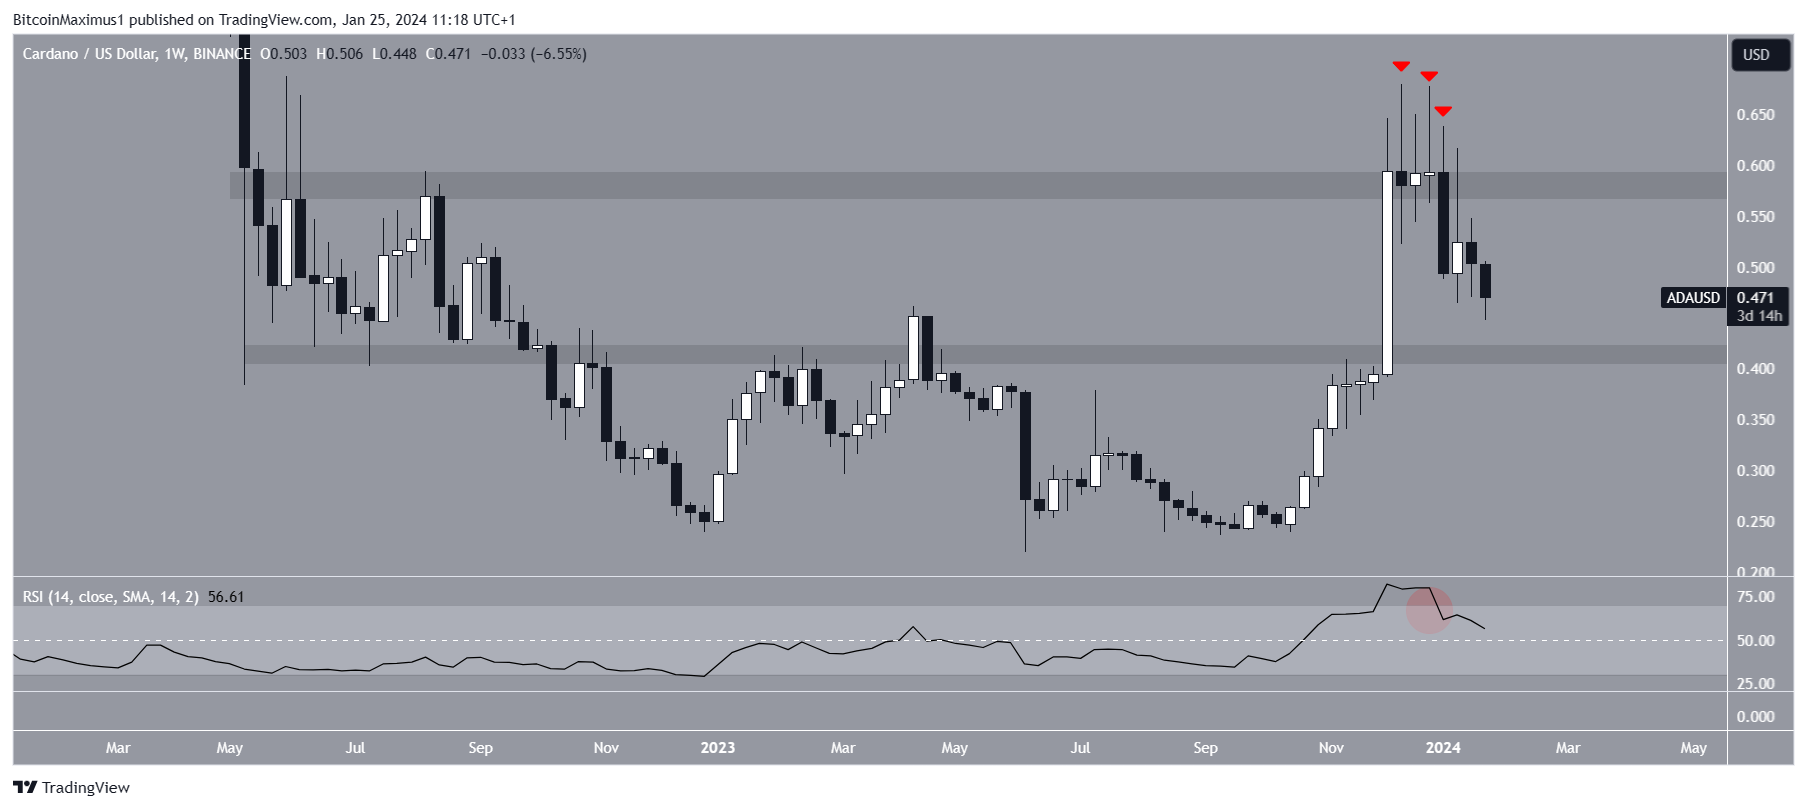
The weekly Relative Strength Index (RSI) gives a bearish reading. Traders utilize the RSI as a momentum indicator to assess whether a market is overbought or oversold and whether to accumulate or sell an asset.
If the RSI reading is above 50 and the trend is upward, bulls still have an advantage, but if the reading is below 50, the opposite is true. The indicator fell below 70, is in a downward trend, and is approaching 50.
Read More: How To Stake Cardano (ADA)
ADA Price Prediction: When Will Price Bottom?
A closer look at the price action and wave count from the daily time frame suggests that the ADA price trend is bearish.
Technical analysts use the Elliott Wave theory to determine the direction of a trend, which involves studying recurring long-term price patterns and investor psychology. Analyst Chris O suggests that ADA is in the first sell-off phase of this bull cycle.
Read More: Best Cardano Wallets for Secure ADA Storage
This aligns with the wave count, which suggests ADA is in wave C of an A-B-C corrective structure (black).
Giving waves A:C a 1:1 ratio leads to a low of $0.41, lining up with the 0.618 Fib retracement support level (white). An ADA decrease of 13% from the current price is required to reach it. The decreasing daily RSI also supports the sentiment.
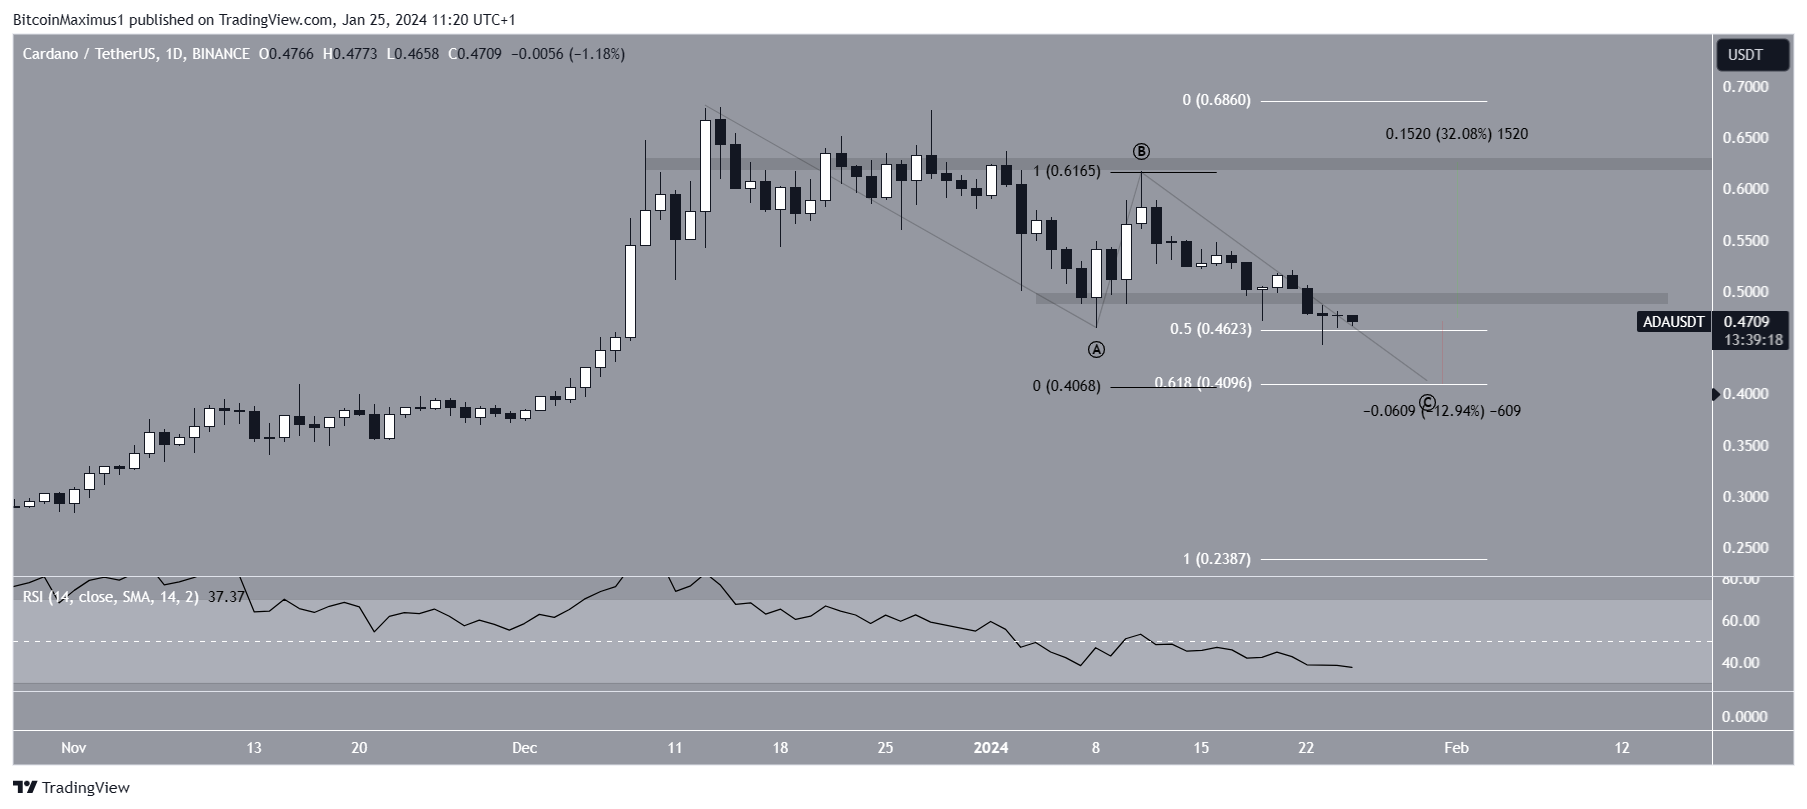
Despite this bearish ADA price prediction, a strong bounce at the 0.5 Fib retracement support level that reclaims the $0.50 area can trigger a 32% increase to the closest resistance at $0.62.
For BeInCrypto‘s latest crypto market analysis, click here.


