


The Cardano (ADA) price has traded inside a corrective pattern since reaching its 2023 high on December 14.
ADA failed to break out from it on January 11, 2024, and has fallen since. Will the price break out or go down instead?
Cardano Retraces After Breakout
The technical analysis of the daily time frame shows that ADA has traded inside an ascending parallel channel since June 2023. After several failed breakout attempts, the ADA price finally cleared the channel’s resistance trend line in December, increasing parabolically afterward.
The breakout led to a new yearly high of $0.68 on December 14. Since then, ADA has fallen significantly, creating two long upper wicks (red icons), considered signs of selling pressure.
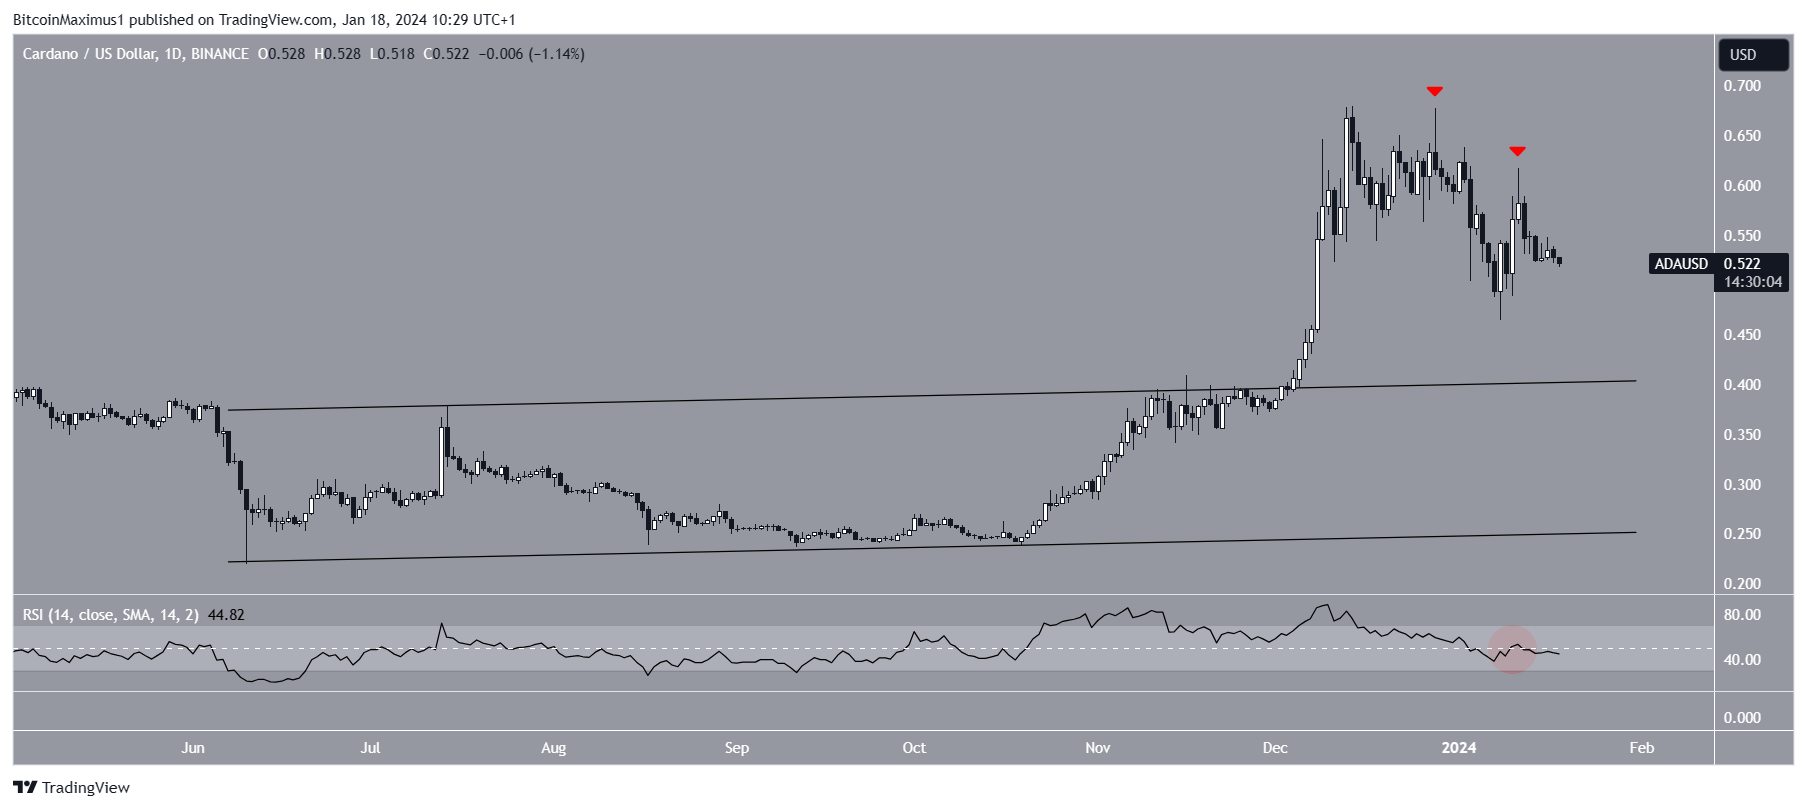
The daily RSI also gives a bearish reading. The RSI is a momentum indicator traders use to evaluate whether a market is overbought or oversold and whether to accumulate or sell an asset.
Readings above 50 and an upward trend suggest that bulls still have an advantage, while readings below 50 indicate the opposite. The RSI is below 50 and falling (red circle), both signs of a bearish trend.
Read More: How To Stake Cardano (ADA)
ADA Price Prediction: Will There Be More Downside?
Similarly to the daily time frame, the six-hour one does not provide a clear direction for the trend. This is because of the price action and RSI readings.
The price action shows that ADA has traded inside a descending parallel channel since December 14. Such channels usually contain corrective movements. On January 8 (green icon), ADA bounced at the channel’s support trend line, validating the 0.5 Fib retracement support level at $0.46.
Read More: How To Stake Cardano (ADA)
However, it failed to break out from the channel. Rather, it was rejected on January 11 (red icon) and has fallen since. Currently, it trades below the channel’s midline. Also, the six-hour RSI is below 50.
As a result, the resolution of the channel pattern will determine the future trend for ADA.
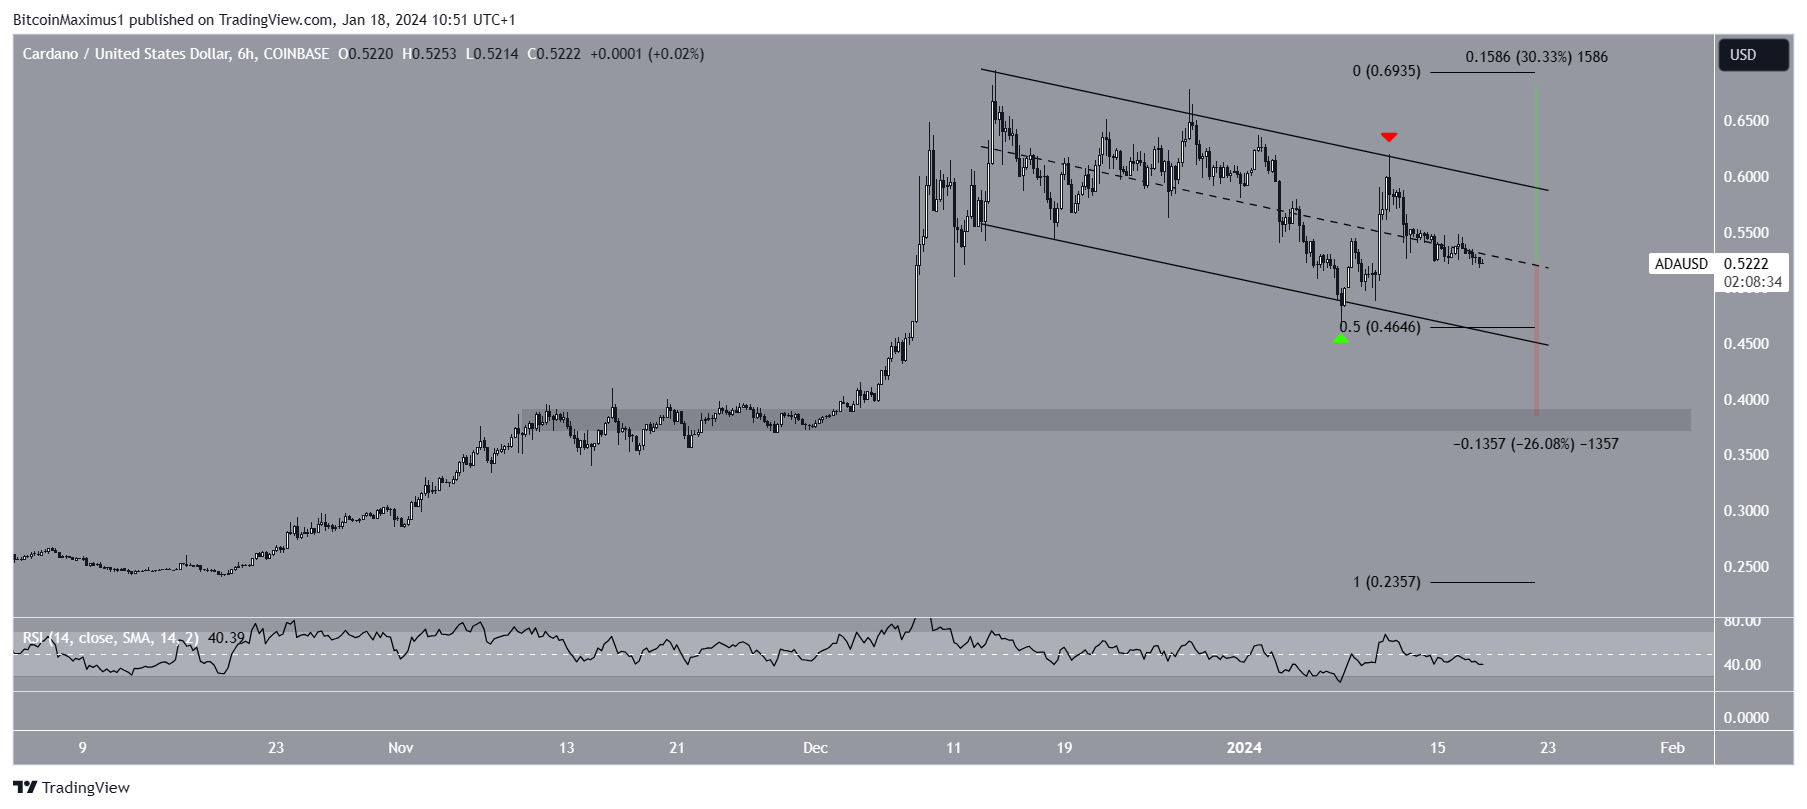
An ADA breakout can lead to a 30% increase to the 2023 high near $0.70. Conversely, a breakdown from the channel can trigger a 25% drop to the closest support at $0.37.
For BeInCrypto’s latest crypto market analysis, click here.
Read More: Best Cardano Wallets for Secure ADA Storage


