


The Bitcoin SV (BSV) price broke out from a descending resistance trendline and increased by 20% on October 2.
Despite the breakout, the price still trades well below the long-term horizontal resistance at $50.
Bitcoin SV Increases by 20%
The BSV price has fallen under a descending resistance trendline since July 1.
The decrease led to a low of $25 on August 17. BSV bounced afterwards, creating a long lower wick (green icon). The price has been increasing since.
On September 13, the price broke out from the descending resistance trendline. After a period of consolidation, it accelerated its rate of increase on October 2, increasing by 20%.
Read More: 9 Best Crypto Demo Accounts For Trading
The next day, BSV reached a high of $43.34 before falling (red icon). The rejection validated the $40 area as resistance.
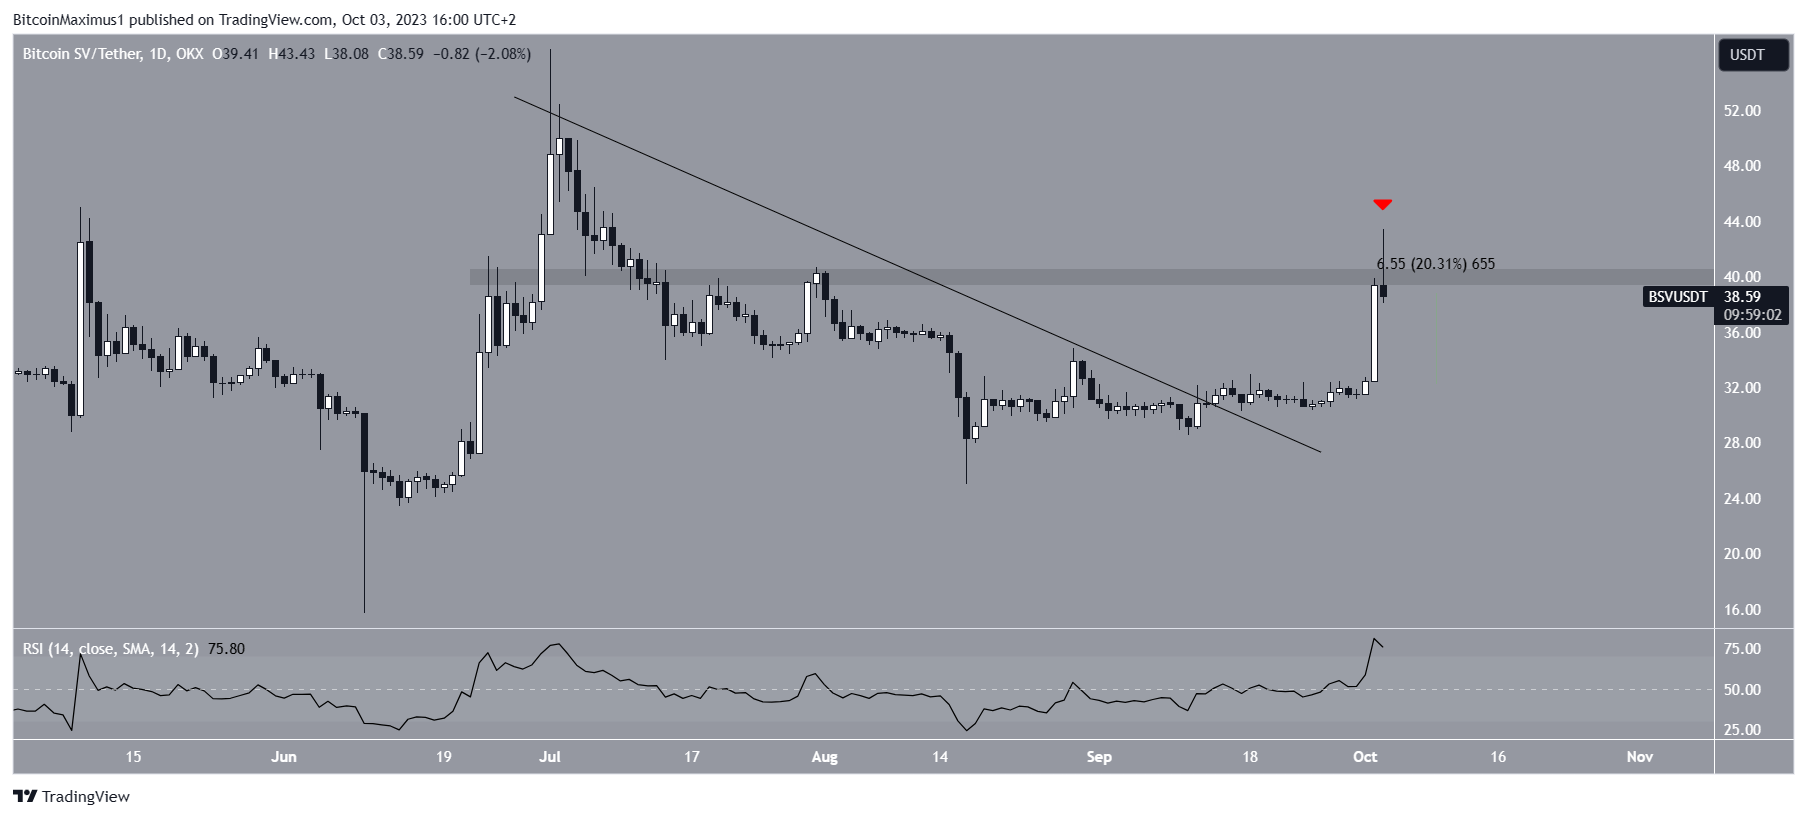
Despite the rejection, the daily RSI is still bullish. The Relative Strength Index (RSI) is a favorite among traders for assessing momentum to guide their asset acquisition or disposal decisions.
If the RSI reading is above 50 and the trend is upward, bulls still have an advantage, but if the reading is below 50, the opposite is true. The indicator is above 50 and increasing, both signs of a bullish trend.
BSV Price Prediction: Is Increase a Sign of Things to Come?
The daily timeframe for BSV shows a significant increase. This bullishness is not validated by the longer-term weekly timeframe. The main reason for this is that the cryptocurrency still trades well below the $50 horizontal resistance area.
The $50 area is the most important one for BSV, since it acted as the all-time low support since 2018 before the price finally broke down in November 2022. Now, the area provides resistance, and was confirmed as such in June 2023.
Also, the RSI is right at the 50 (red circle), an area that could cause a rejection.
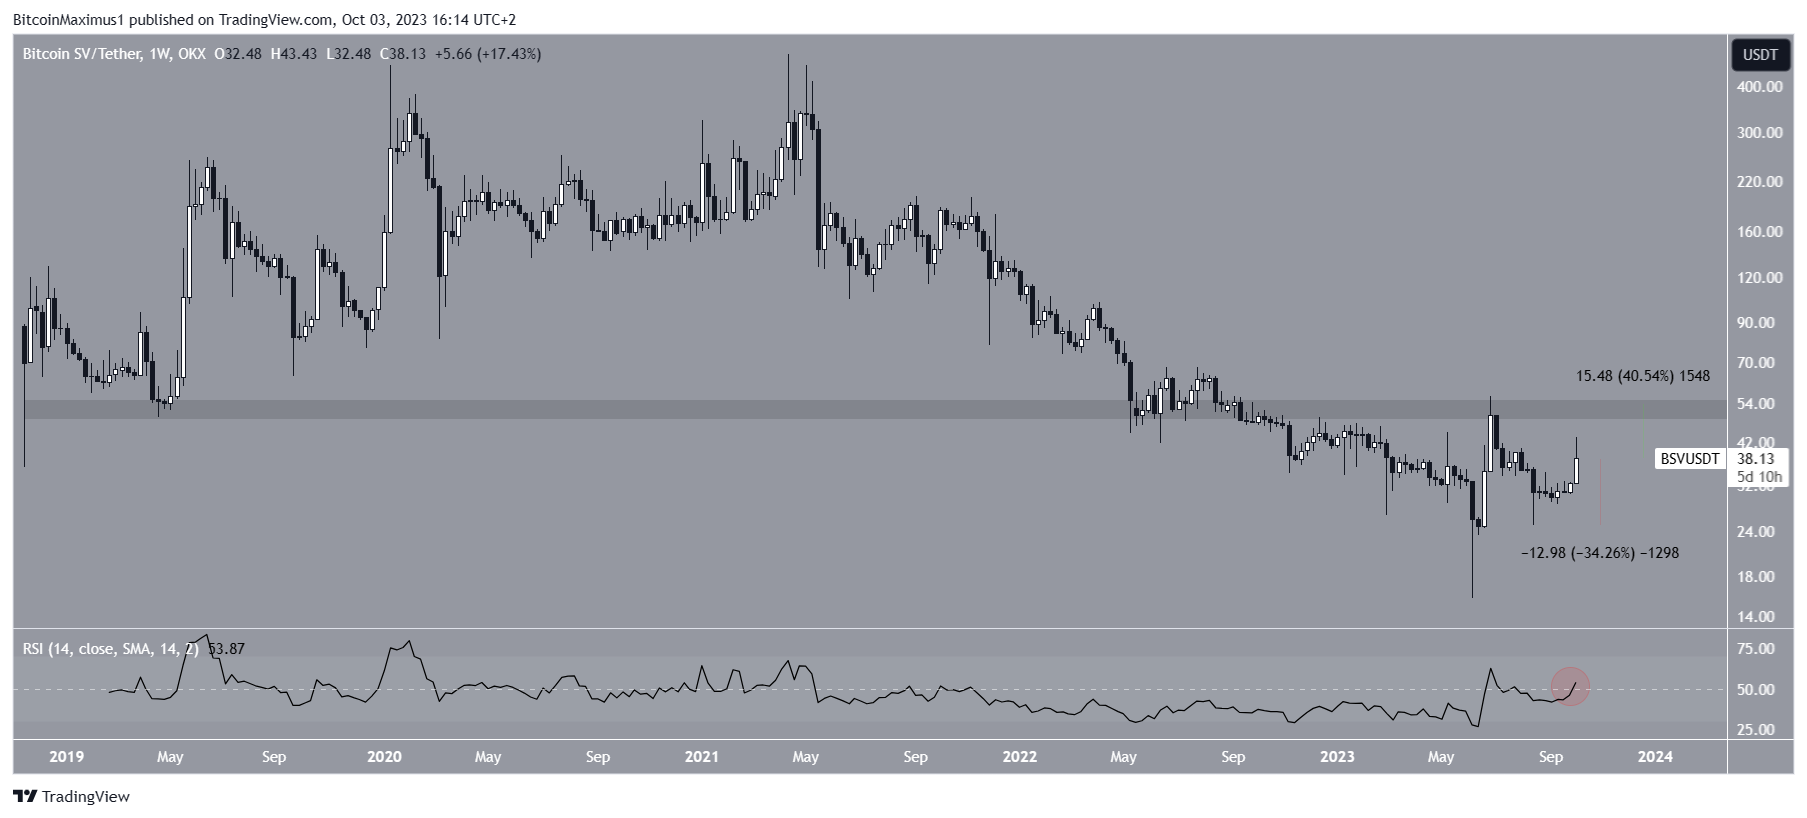
Therefore, the BSV price prediction is considered bearish unless the price closes above the $50 horizontal resistance area.
This is 40% above the current price. On the other hand, the closest support is at $25, this is 35% below the current price.


