


After a massively bullish week, the Bitcoin (BTC) price has cleared a crucial resistance level that could trigger another increase.
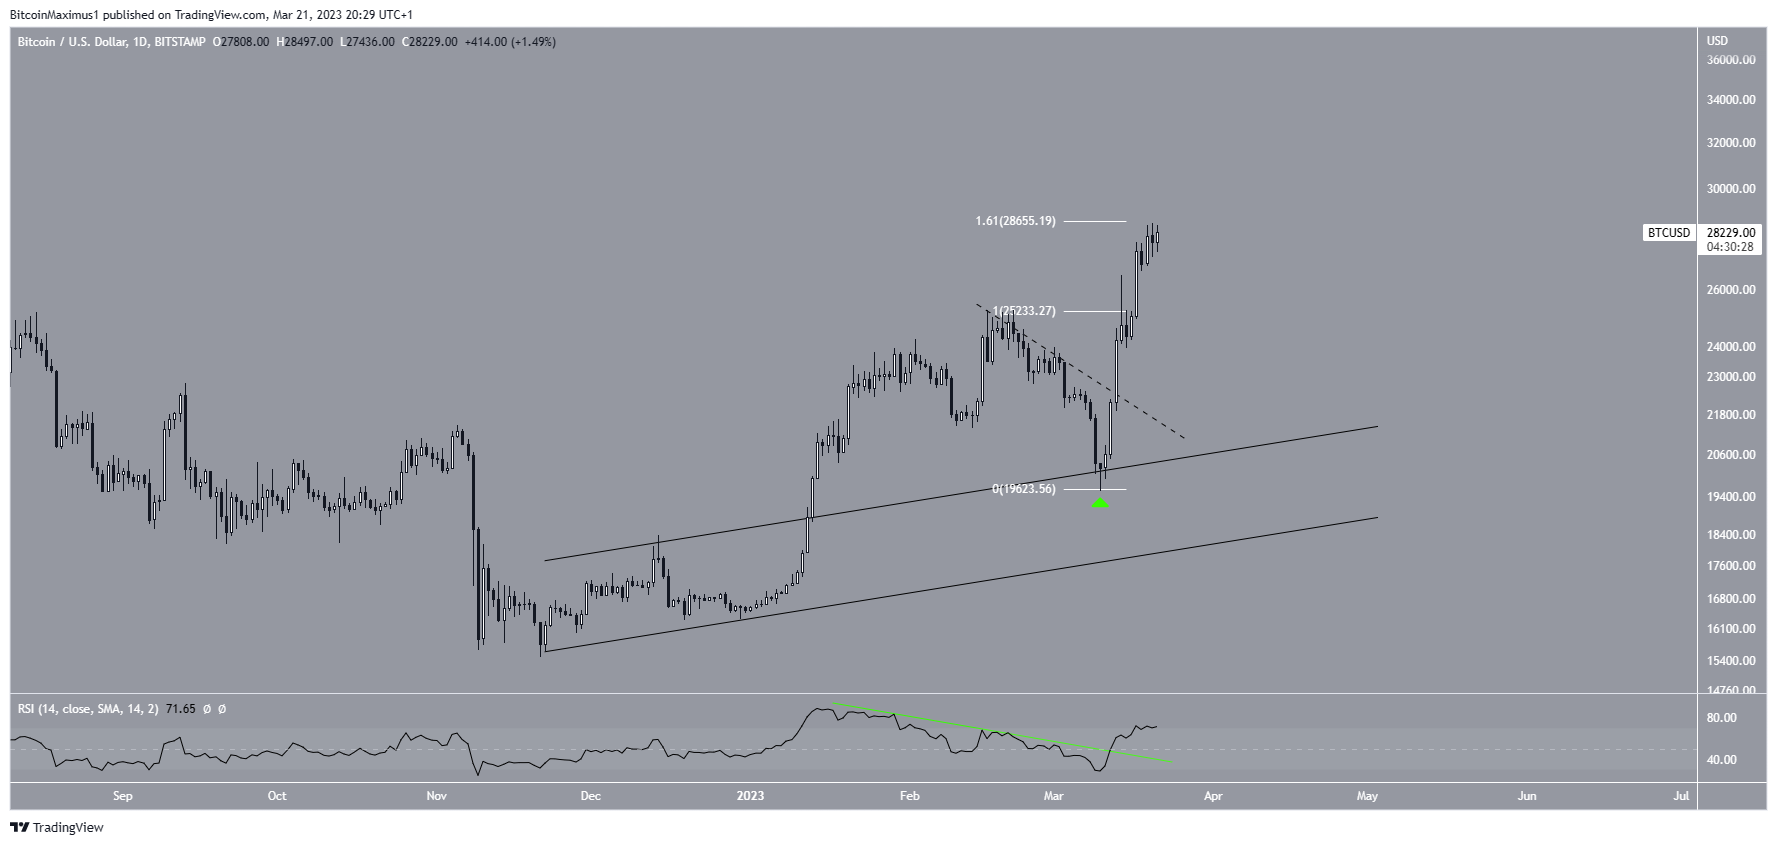
The daily chart for BTC shows that the price has increased since March 10, when it reached a low of $19,569 (green icon). The increase since has been parabolic, leading to a new yearly high of $28,567. The high was made exactly at the 1.61 external Fib of the most recent drop, which is a suitable level for a top.
However, the daily RSI is still bullish, showing no signs of weakness. The indicator broke out from its bearish divergence trend line and is still increasing.
Top of the Movement or Beginning of Massive Rally?
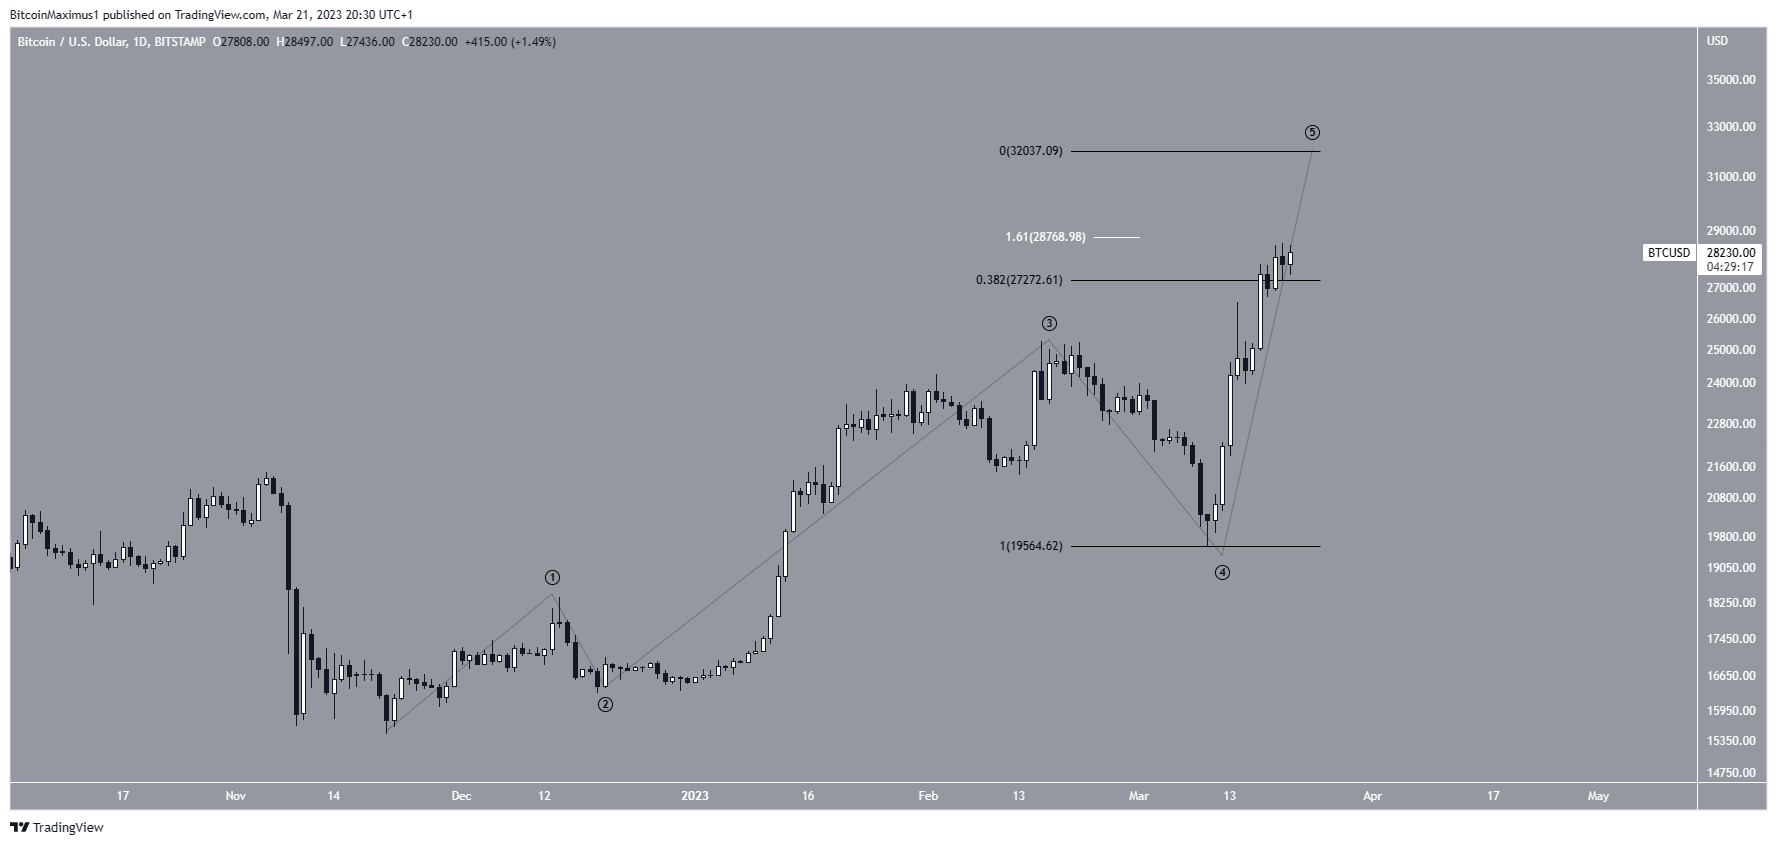
There are two potential wave counts for the future Bitcoin trend. The first one suggests that the price is in the fifth and final wave of an increase. Besides the previously outlined 1.61 external Fib level (white), the next important resistance is at $32,000, giving wave five the same length as waves one and three combined. If this is the correct count, a significant drop would occur afterward.
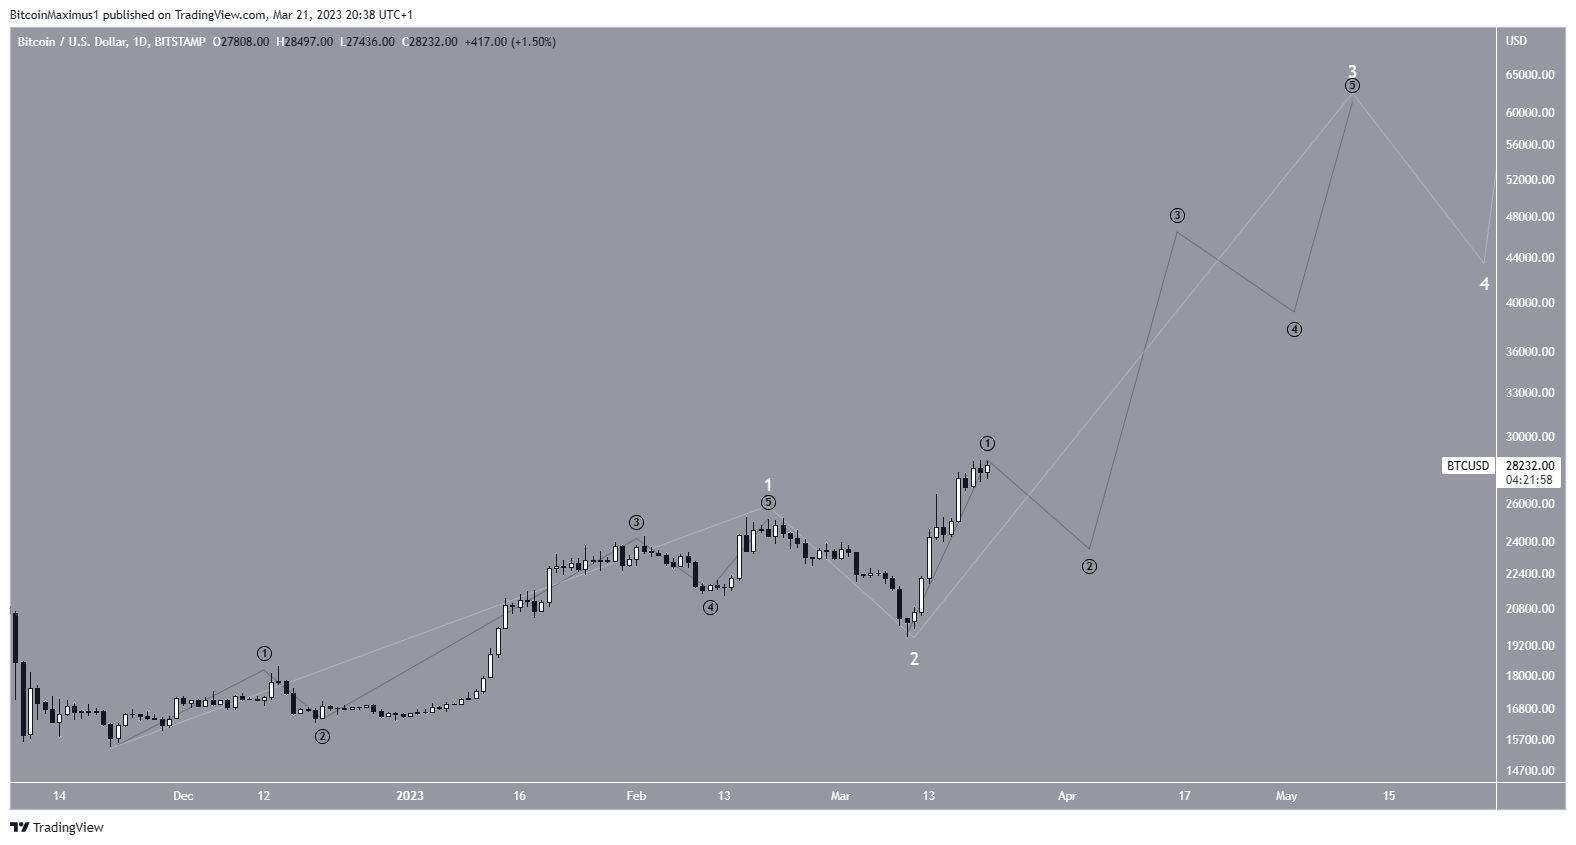
The second count is much more bullish. It indicates that the price has just begun a long-term wave three (white), which could take BTC toward a new all-time high. The sub-wave count is given in black and suggests that the price is approaching the top of sub-wave one.
Since the BTC price is likely to reach a top soon, the shape of the decrease will be crucial in determining the future trend.
Bitcoin (BTC) Weekly Outlook is Decisively Positive
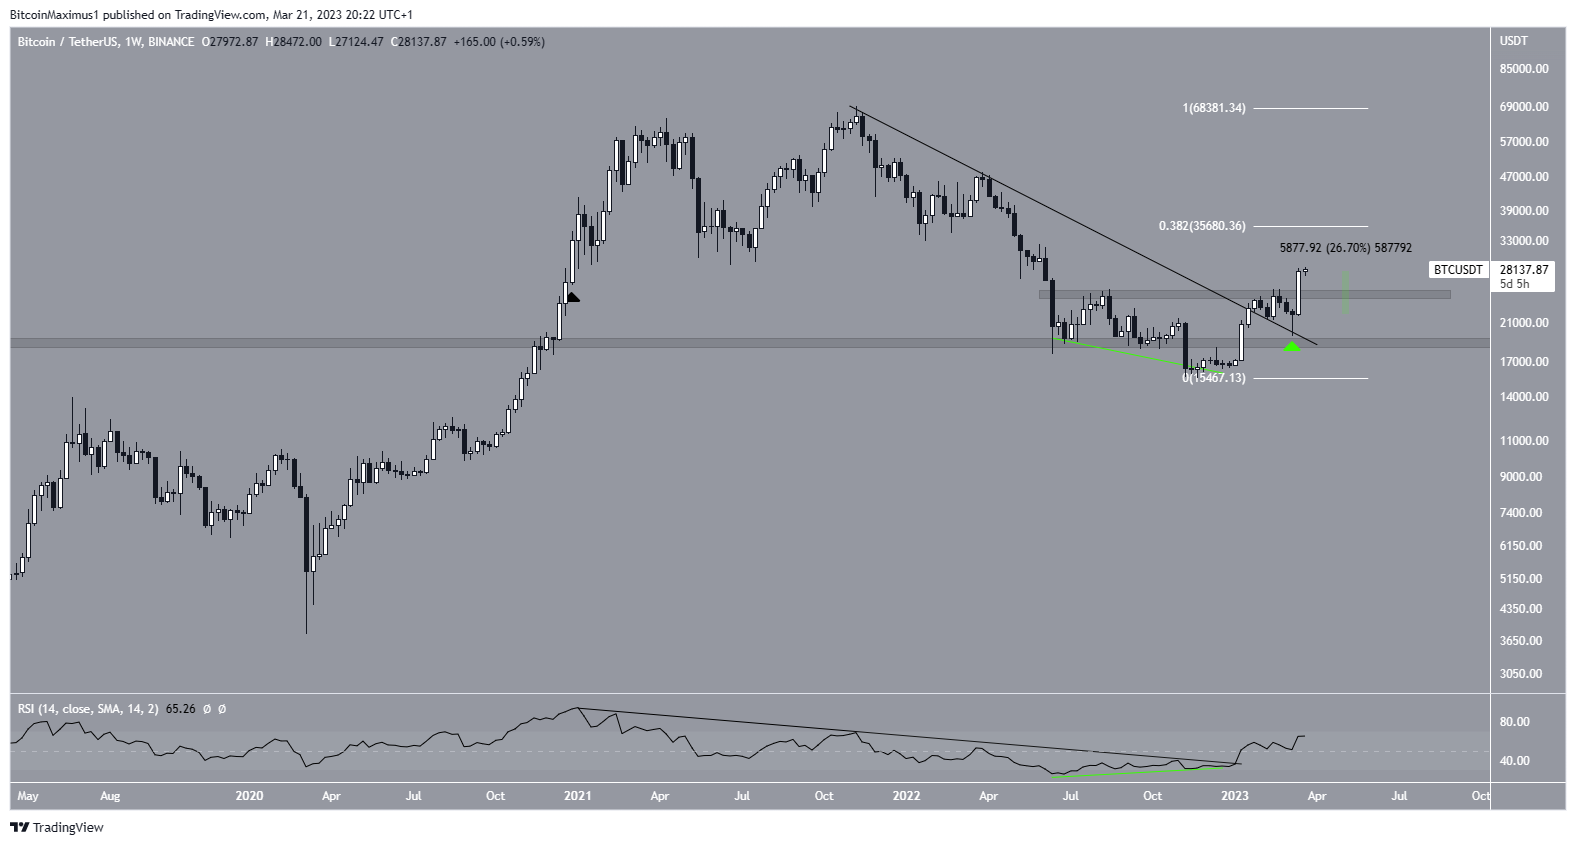
The weekly time frame Bitcoin price chart shows that the price had fallen under a descending resistance line since reaching an all-time high price of $69,000 in November 2021. The downward movement culminated with a low of $15,476 in November of the next year.
The price action since then has been decisively bullish, boding well for the future outlook of the peer-to-peer blockchain technology.
Firstly, the BTC price reclaimed the $18,700 support area, and then it broke out from the descending resistance line.
During the week of March 6-13, the BTC price created a very long lower wick, validating the line as support (green icon). It followed that up with a bullish engulfing candlestick that caused a breakout above the $24,700 resistance area. The candlestick amounted to a 26% weekly increase, the highest increase since December 2020 (red icon). The area is now expected to provide support.
The weekly RSI readings are also bullish. The indicator broke out from its bearish divergence trend line (black line) and moved above 50. This came after a long period of bullish divergence.
As a result, the weekly readings from both the price action and technical indicators are decisively bullish.
If the increase continues, the next resistance area would be at $35,680, created by the 0.382 Fib retracement resistance level (white). On the other hand, a close below $24,700 could catalyze a drop to $18,700.
To conclude, the most likely Bitcoin price forecast is an increase toward at least $35,800 and possibly higher. A weekly close below $24,700 would invalidate this bearish outlook. If that occurs, it could catalyze a fall toward $18,700.


