


April was an interesting month for the cryptocurrency market, characterized by high volatility, new yearly highs, and a sharp drop. BeInCrypto looks at the crypto predictions for the upcoming month of June.
The month of May was the first bearish month of the year for the cryptocurrency market. It is possible that June will bring more of the same.
Below are the biggest crypto predictions for June, relating to Bitcoin, Ethereum, and other popular cryptocurrencies.
Bitcoin (BTC) Will Drop to $25,000
The Bitcoin price broke down (red icon) from a head and shoulders pattern on May 11. The head and shoulders is considered a bearish pattern. As a result, the breakdown was expected.
However, the movement since the breakout has been unusual. Instead of falling sharply, the BTC price increased twice and even moved above the patterns midline once more on May 30. But, it decreased again shortly afterward.
Therefore, it is possible that the head and shoulders pattern was not valid.
So, the next most likely pattern is a descending parallel channel. If correct, the price was rejected by its resistance line (red icon) on May 31, initiating the current downward movement.
The decrease could take the price to the channel’s support line at $25,000. This is also the 0.382 Fib retracement support level when measuring the entire previous upward movement. So, it is a very likely level for a bottom.
The RSI movement also supports this possibility. By using the Relative Strength Index (RSI) as a momentum indicator, traders can determine whether a market is overbought or oversold and decide whether to accumulate or sell an asset.
If the RSI reading is above 50 and the trend is upward, bulls have an advantage, but if the reading is below 50, the opposite is true. The indicator is below 50 and falling, a sign of a bearish trend.
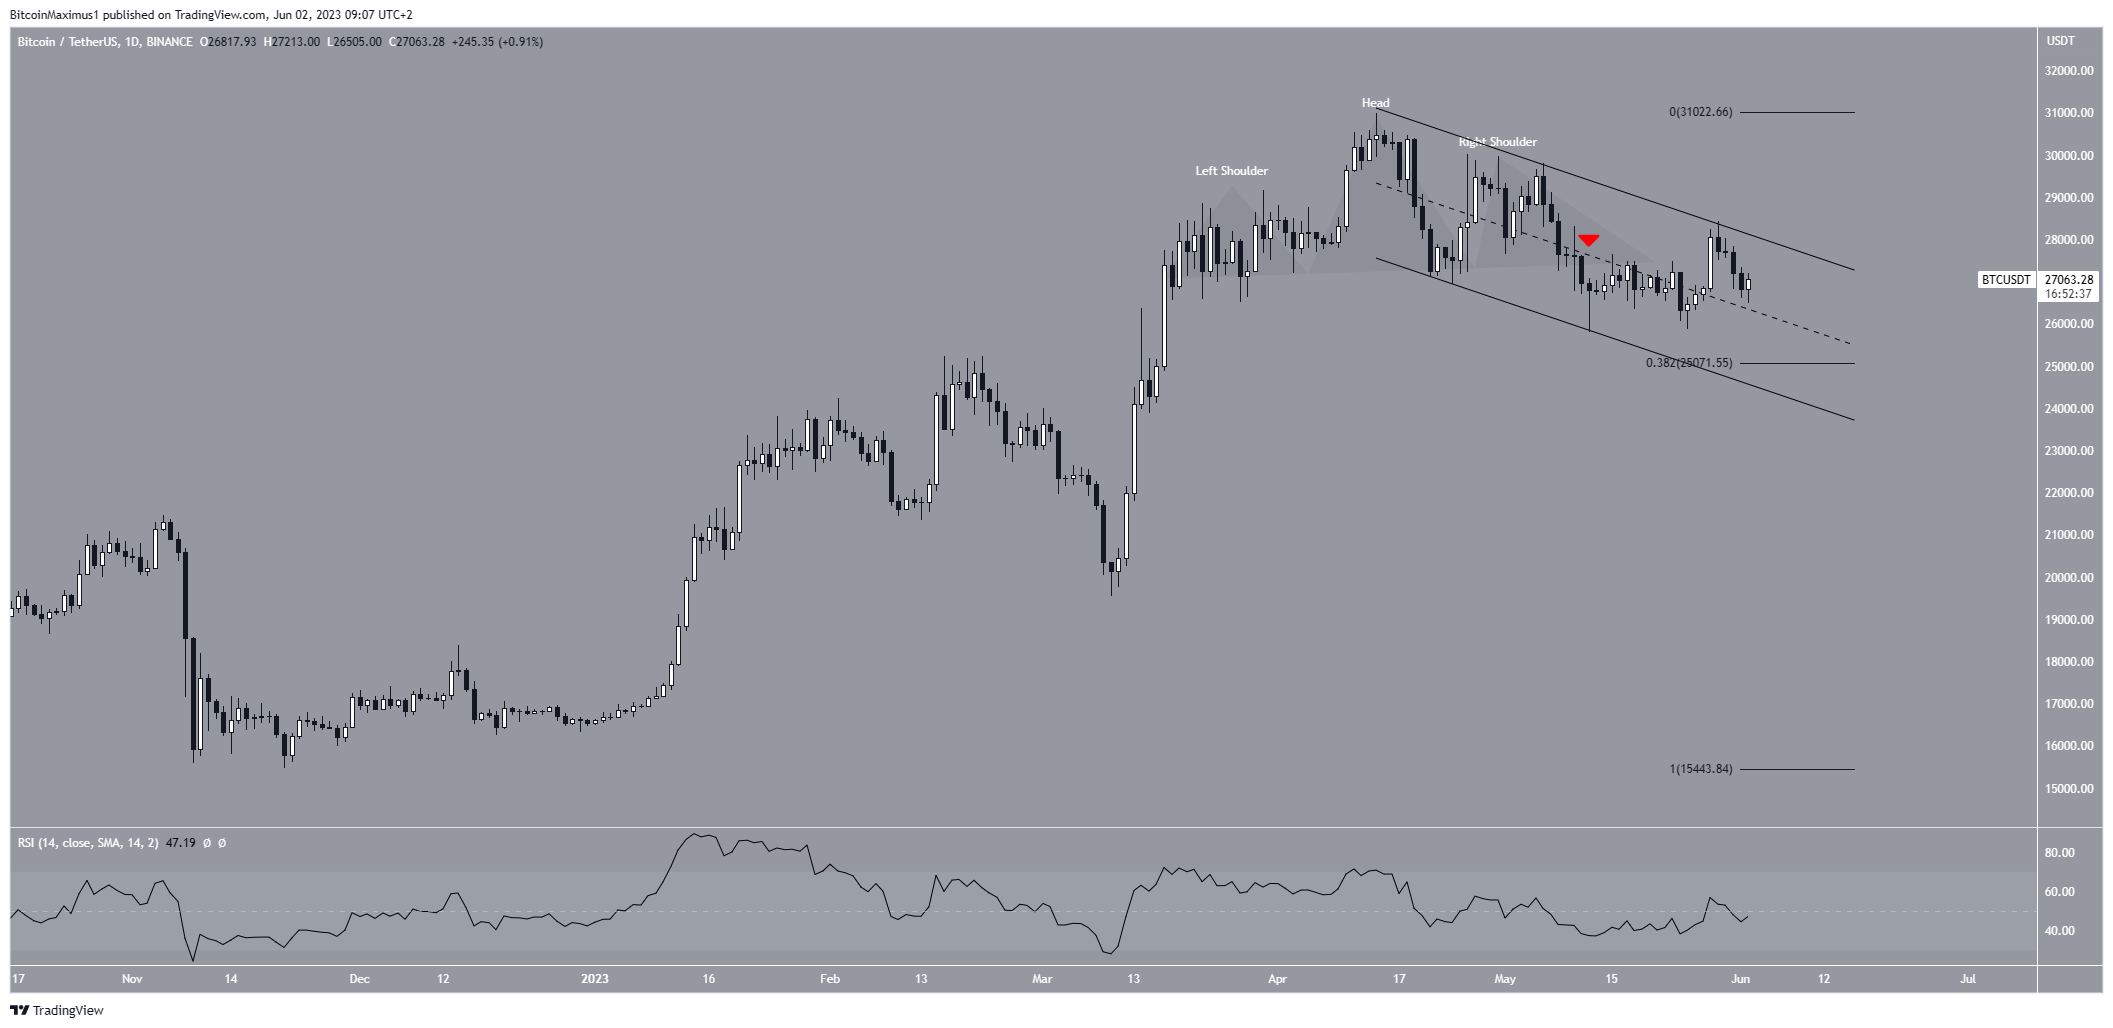
While the outlook from both the price action and the RSI is bearish, a daily close above the channel’s resistance line will invalidate this bearish BTC price prediction. In that case, the BTC price could move to the $31,000 resistance area.
Ethereum (ETH) Will Reach a New Yearly High Against Bitcoin
The Ethereum price outperformed Bitcoin throughout May. It is likely that it will do the same in June.
The ETH/BTC price has fallen inside a descending parallel channel since the beginning of 2022. In April 2023, it bounced at the channel’s midline. It was the second time it bounced at this line. Since the price is now trading in the channel’s upper portion, a breakout from it is the most likely scenario.
Additionally, the weekly RSI supports the continuing increase. The indicator broke out from a descending resistance line (black line) and moved above 50 afterward (green circle).
If the price breaks out from the channel’s resistance line, it is likely to clear the ₿0.078 resistance area and move to ₿0.01.
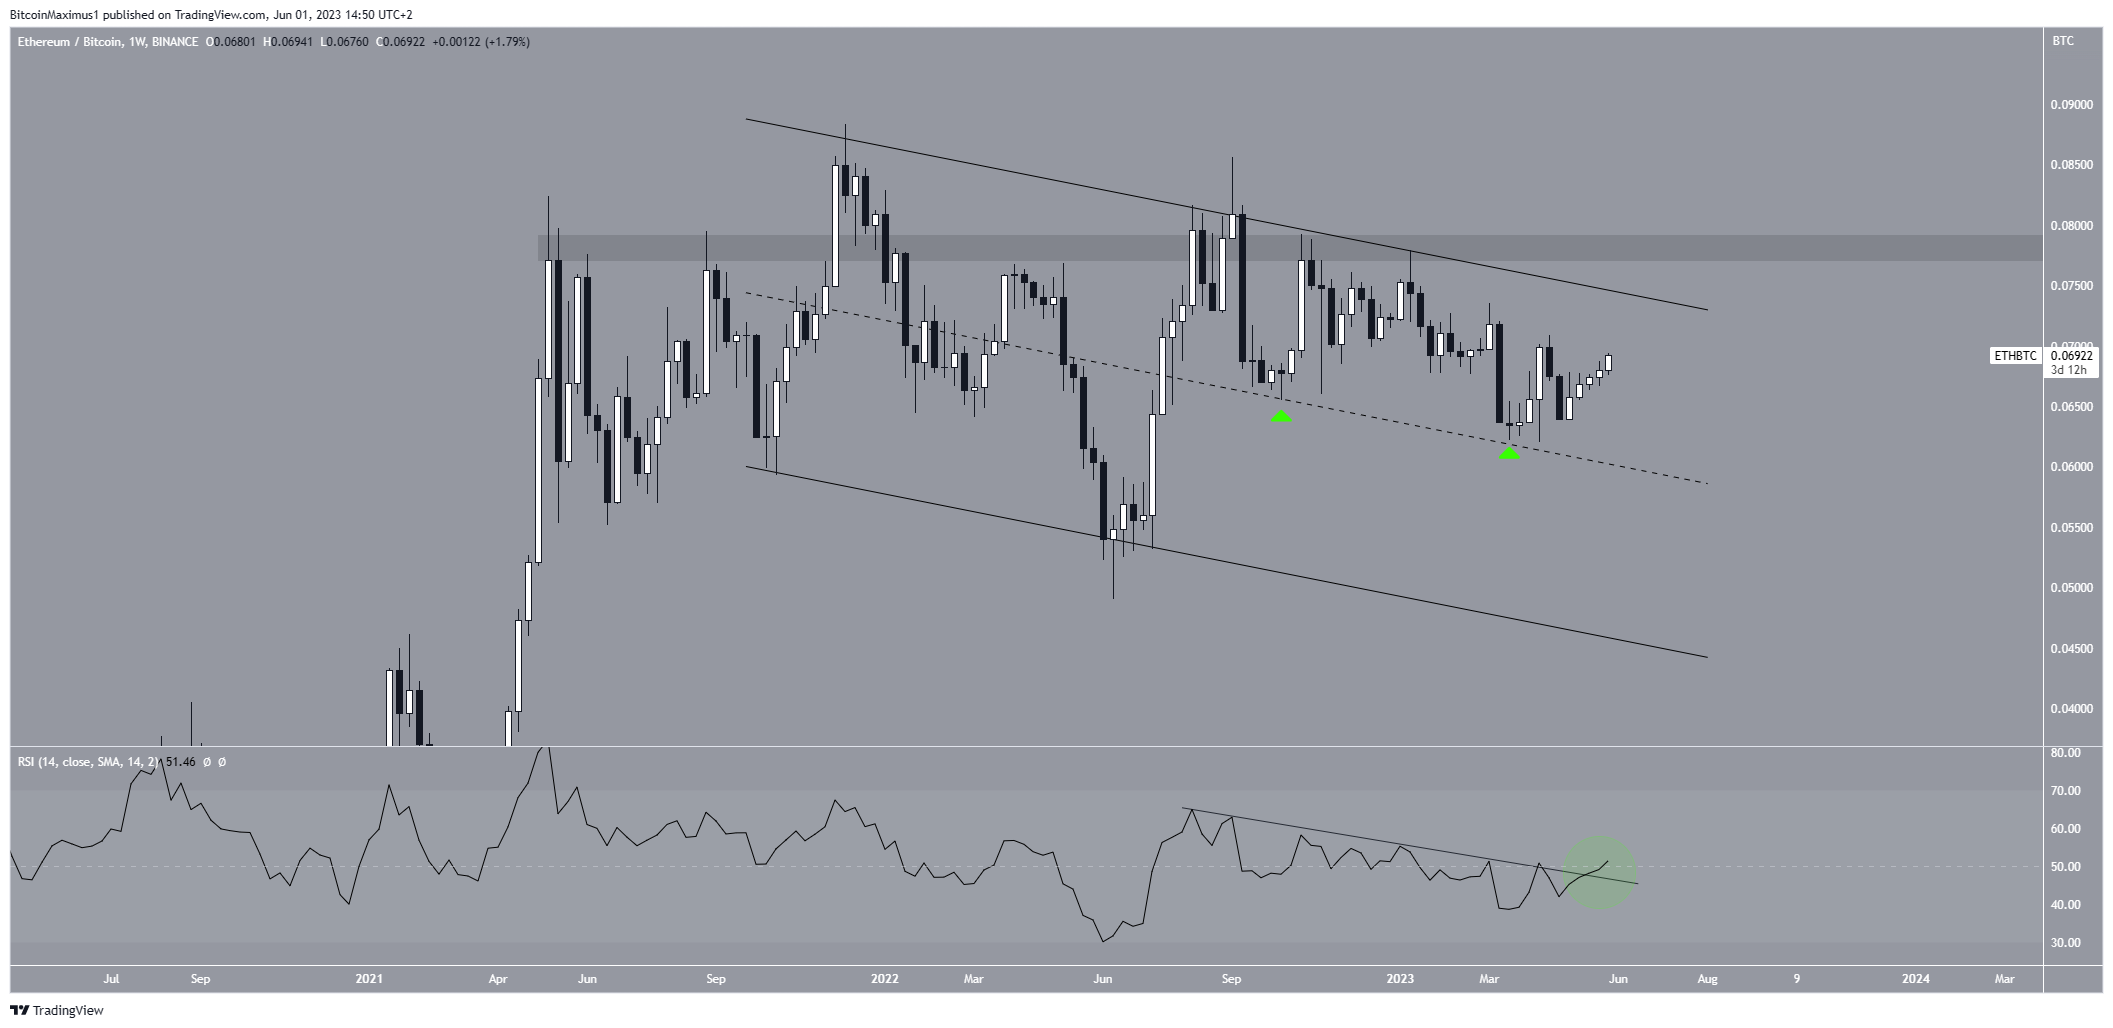
Despite this bullish ETH price prediction, closing below the channel’s midline will mean that the trend is still bearish. In that case, the ETH price could fall to the channel’s support line at ₿0.045.
Pepe (PEPE) Will Begin Its Recovery
PEPE was the main altcoin story in May, becoming one of the biggest altcoin gainers of all time. However, the price reached its all-time high on May 5 and has fallen sharply since.
Despite this drop, it seems likely that June will provide some recovery. There are several reasons for this. The drop since May 13 has been contained inside a descending parallel channel.
The channel is considered a corrective pattern, meaning that a breakout from it is the most likely scenario.
On May 31, the price bounced at the channel’s support line (green icon). The bounce was combined with the lowest-ever RSI reading (green circle). The indicator has increased since.
So, the most likely PEPE price prediction is an increase to the next resistance at $0.0000022.
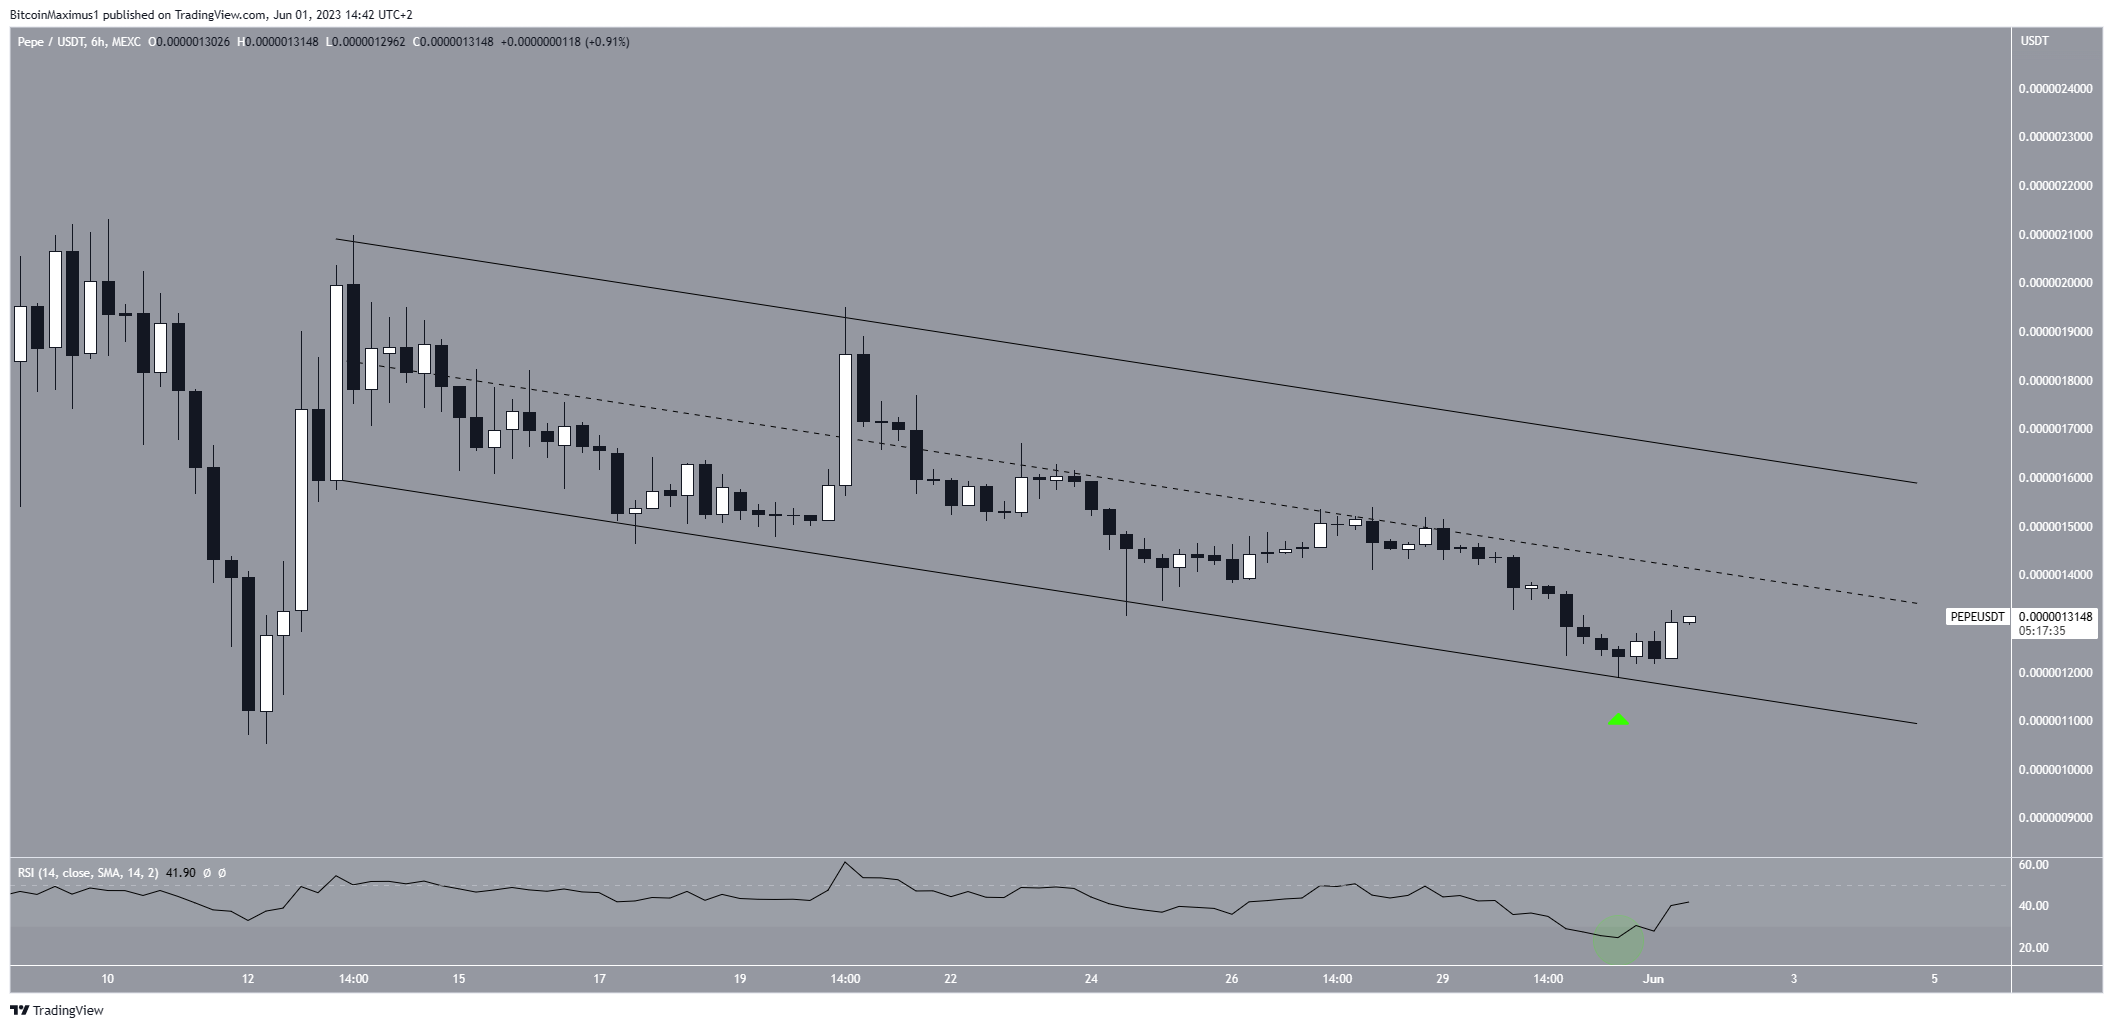
Despite this bullish forecast, a decrease below the channel’s support line will mean that the trend is bearish. In that case, PEPE could resume its long-term descent to $0.0000009.
For BeInCrypto’s latest crypto market analysis, click here


