


The Axie Infinity (AXS) price has broken down from the long-term $9.50 support area. This could be the catalyst for a decrease towards $3.40.
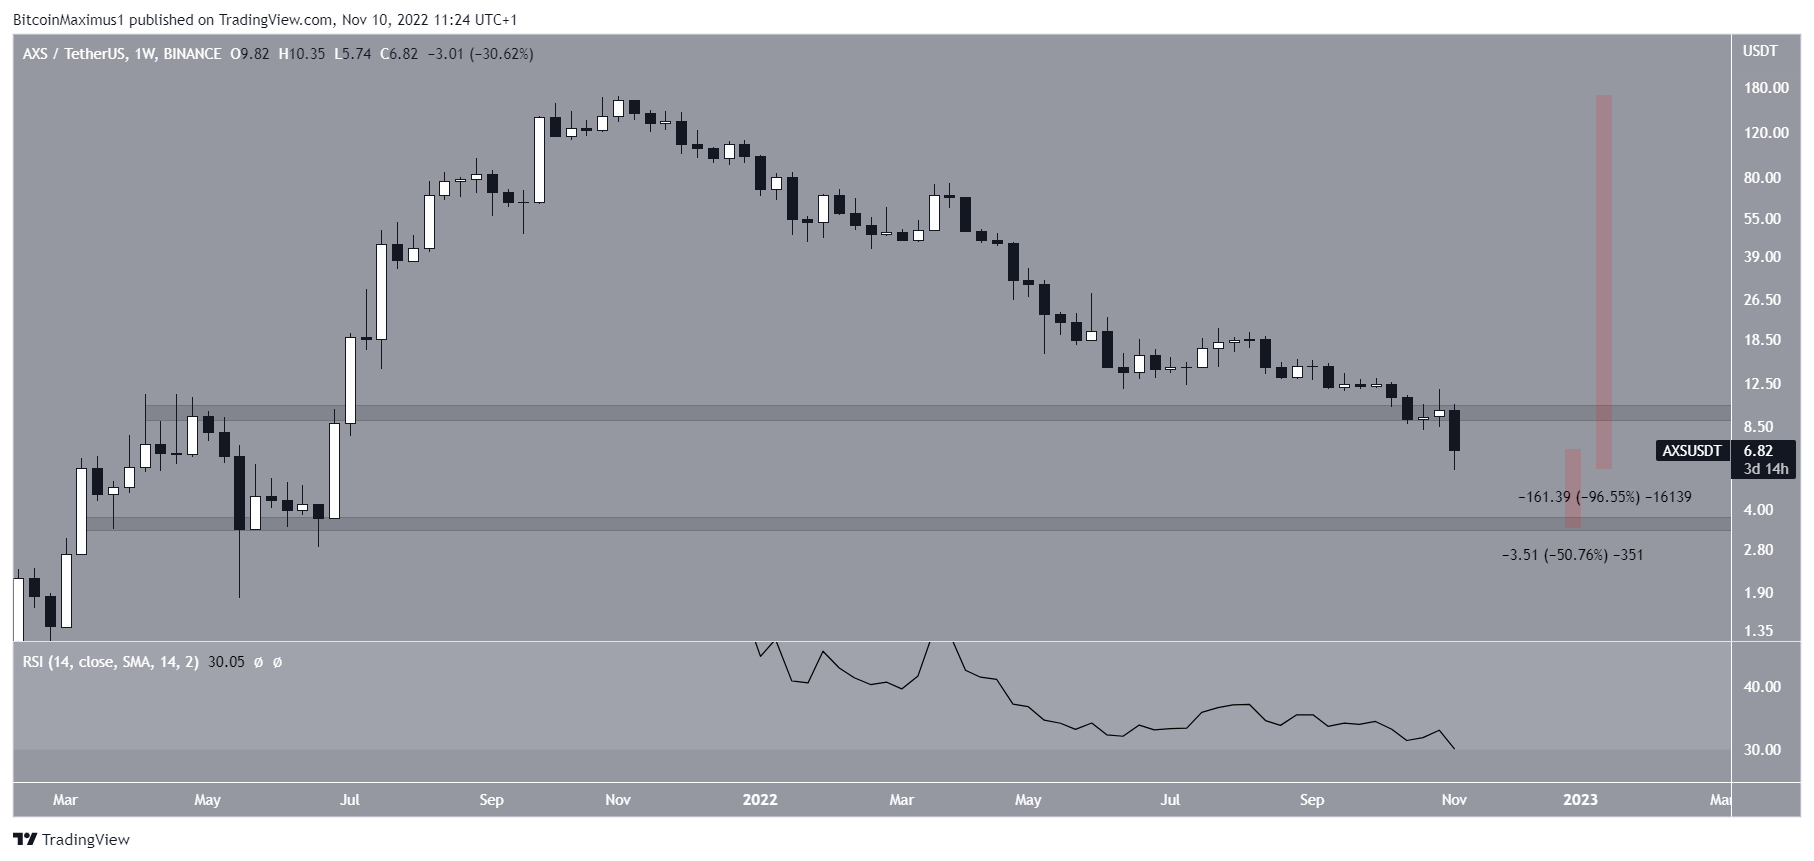
AXS is the native token of the blockchain-based play-to-earn game Axie Infinity, made by Sky Mavis. The price of AXS has decreased since reaching an all-time high of $166.09 in Nov. 2021. The decrease led to a low of $5.74 in Nov. 2022.
The decrease caused a breakdown from the long-term $9.50 horizontal support area. This is a bearish sign that could lead to the acceleration of the downward movement.
Technical analysis indicators are also bearish. The weekly RSI is decreasing, is below 50, and has not generated any bullish divergence. It seems that the RSI will soon decrease into oversold territory.
The next long-term support area is at $3.40. Unless the AXS coin reaches a weekly close above the $9.50 support area, a fall towards $3.40 is the most likely Axie Infinity price prediction. This would amount to another 50% decrease.
Axie Infinity Price: Short-Term Relief Before Fall
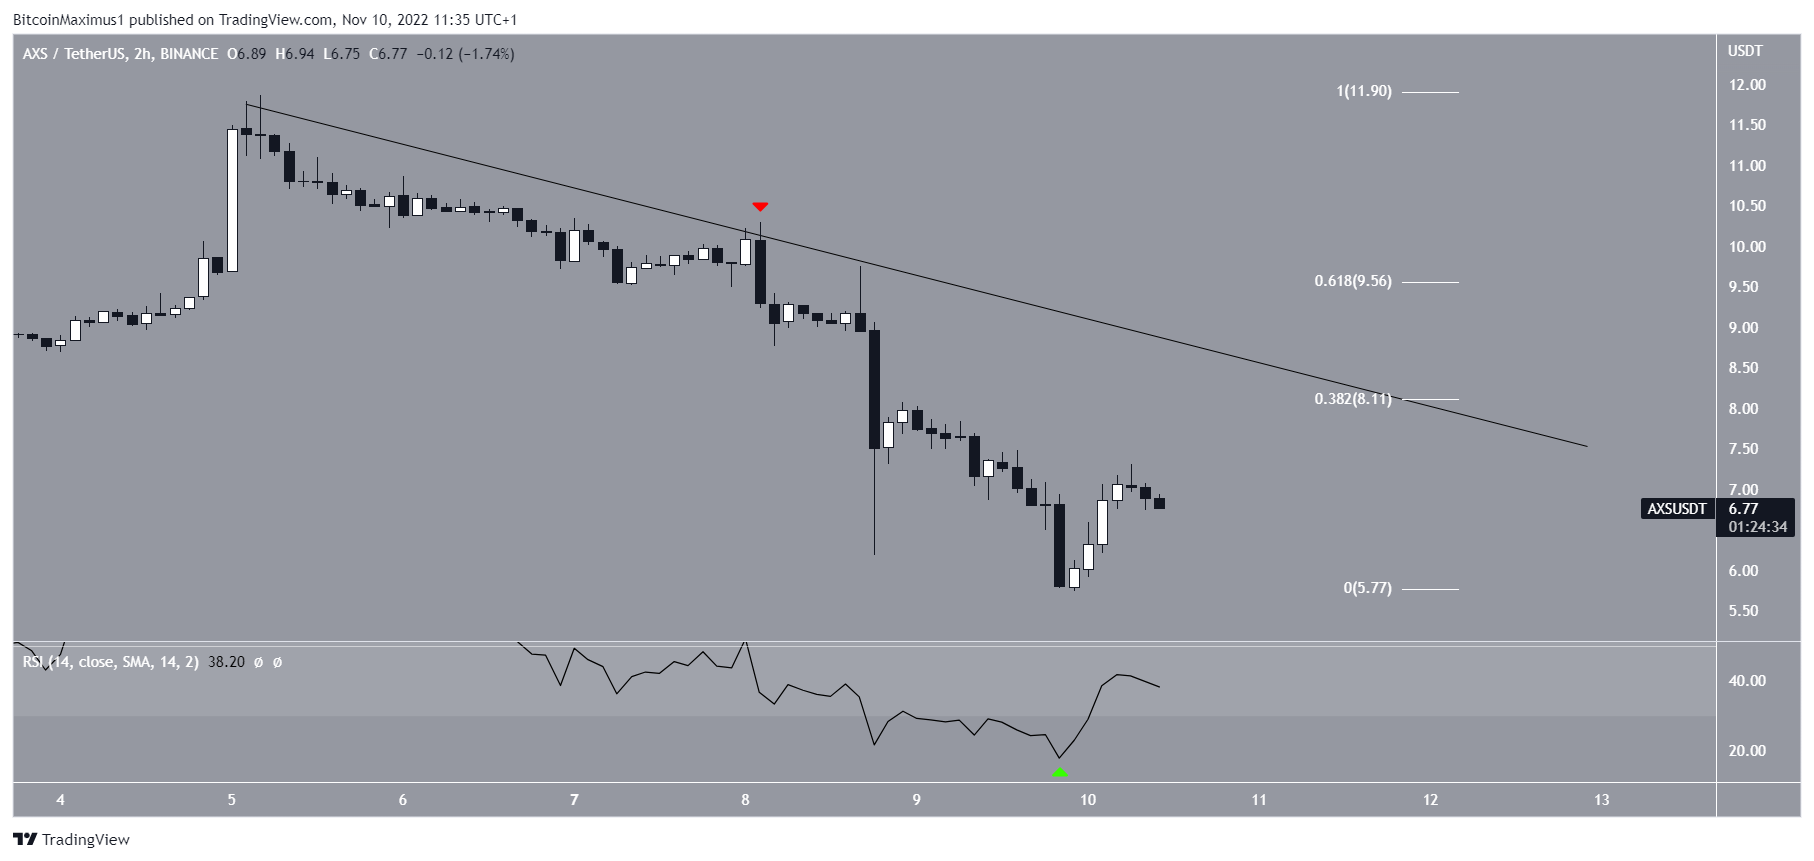
The short-term two-hour chart shows that the Axie Infinity price has decreased below a descending resistance line since Nov. 5. More recently, the line caused a rejection on Nov. 7. This led to the $5.74 low. However, the AXS price bounced in the next 24 hours.
The two-hour RSI fell to extreme oversold levels and has bounced outside of oversold territory (green icon). This could be a catalyst for a relief rally.
The relief rally may continue until $8.11, reaching the 0.382 Fib retracement resistance level (white) and the descending resistance line. In the more bullish scenario, it could increase until the $9.50 resistance area, which also coincides with the 0.618 Fib retracement resistance level.
However, unless it manages to reclaim this level, the trend cannot be considered bullish. Therefore, a fall toward $3.40 remains the most likely scenario.
For BeInCrypto’s latest Bitcoin (BTC) analysis, click here.
Disclaimer: BeInCrypto strives to provide accurate and up-to-date information, but it will not be responsible for any missing facts or inaccurate information. You comply and understand that you should use any of this information at your own risk. Cryptocurrencies are highly volatile financial assets, so research and make your own financial decisions.



