


The Avalanche (AVAX) price has created a bullish pattern at a long-term support level. It is possible that this will initiate an upward movement.
While the price movement from the daily time frame shows a sharp rejection, the short-term trend allows for the possibility that the AVAX token price will begin an upward movement soon.
Failure to Break out Leads to Avalanche Price Drop
The AVAX price has fallen since the $21.50 horizontal resistance area was rejected on April 18. This was the fourth unsuccessful attempt at moving above the area (red icons).
Even though areas get weaker each time they are touched, the digital asset failed to move above the area on the fourth attempt. Rather, a very sharp fall ensued, taking the AVAX price to a long-term ascending support line.
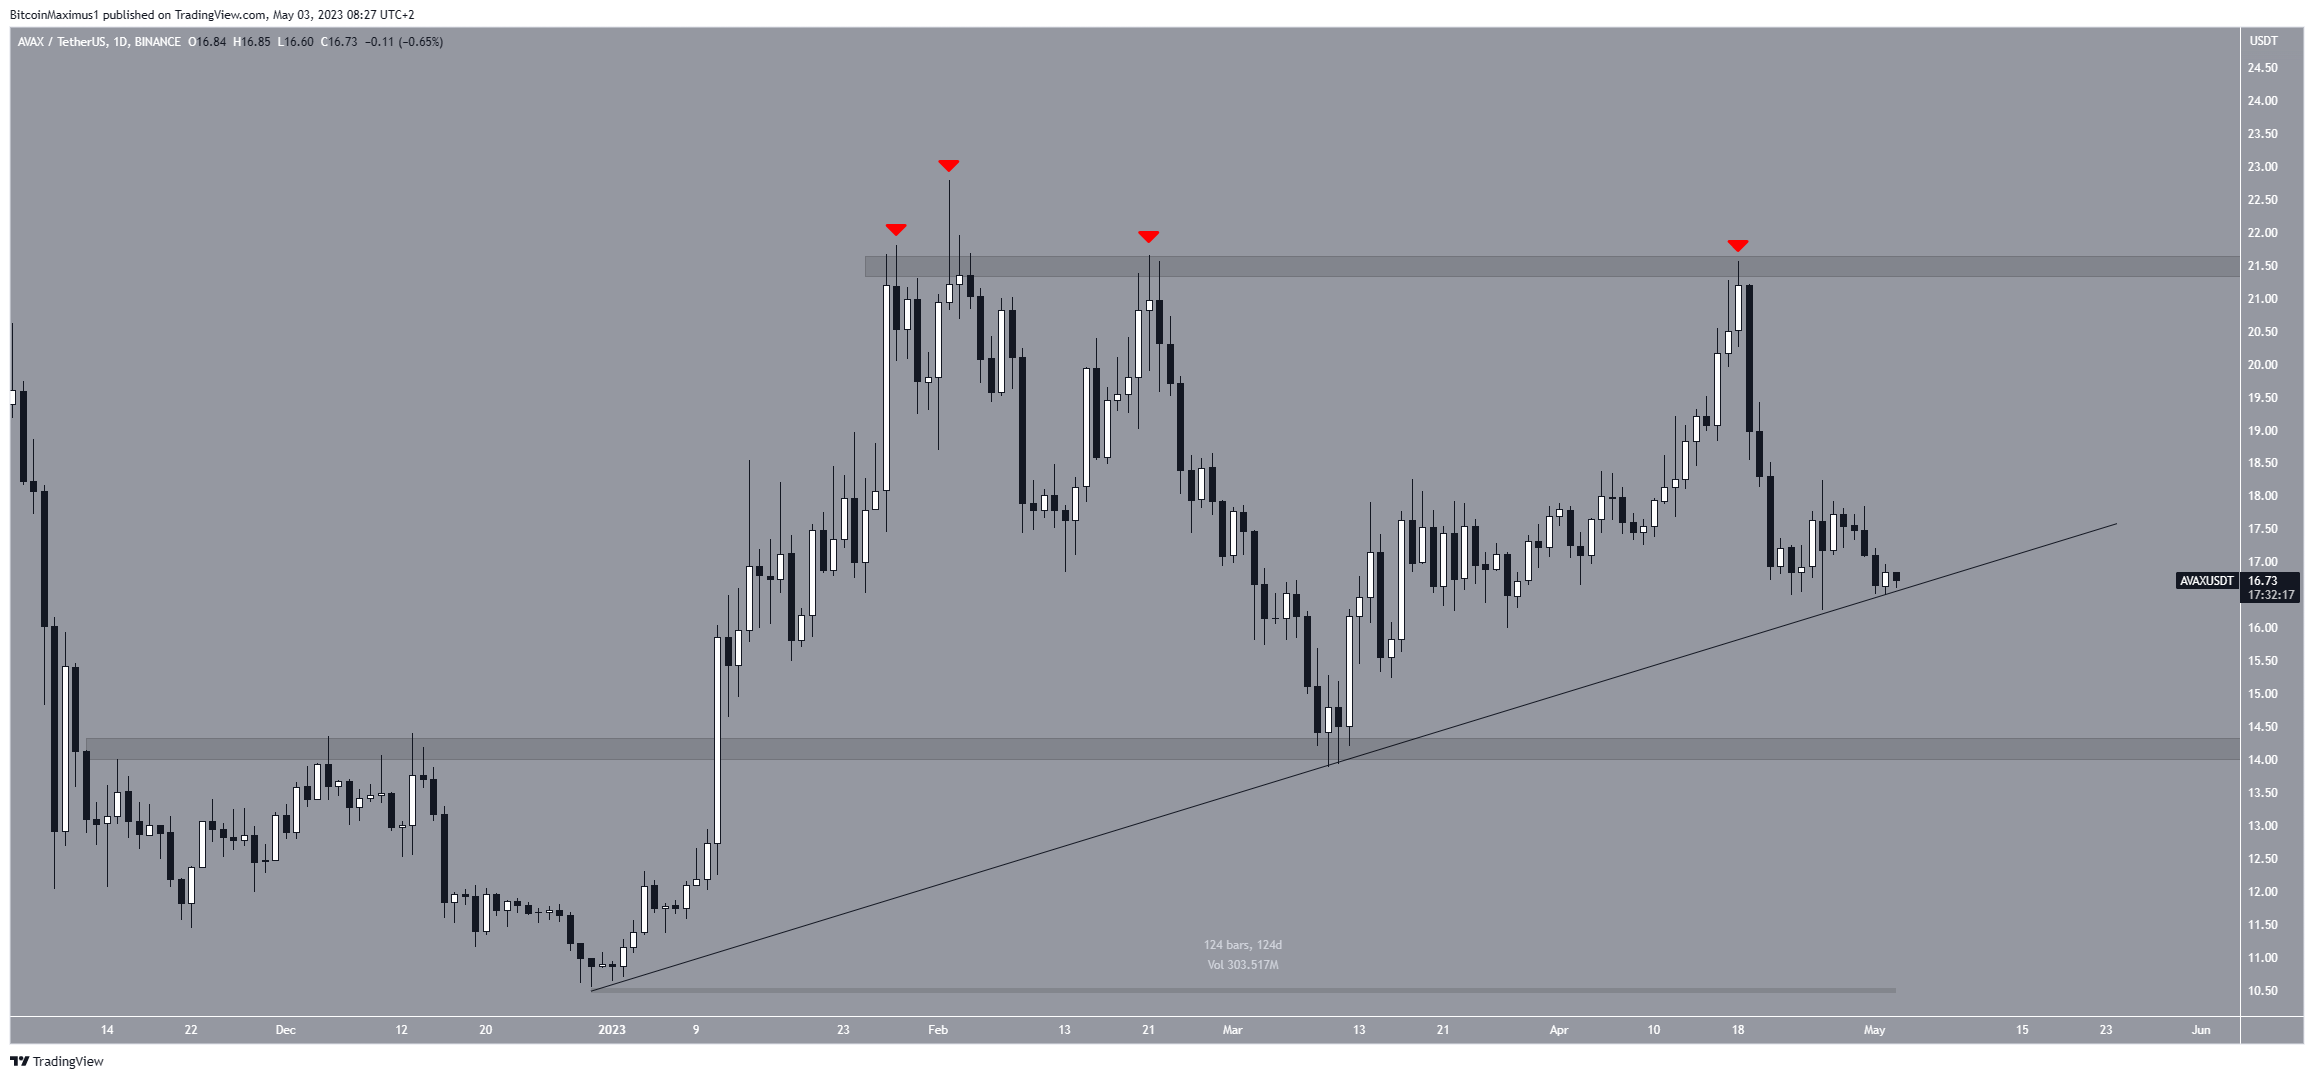
The line has been in place since the beginning of the year, creating the slope of the upward movement. So, whether the price breaks out or down will determine the future trend. The closest support area is at an average price of $14.20.
AVAX Price Prediction: Will Bullish Pattern Cause Reversal?
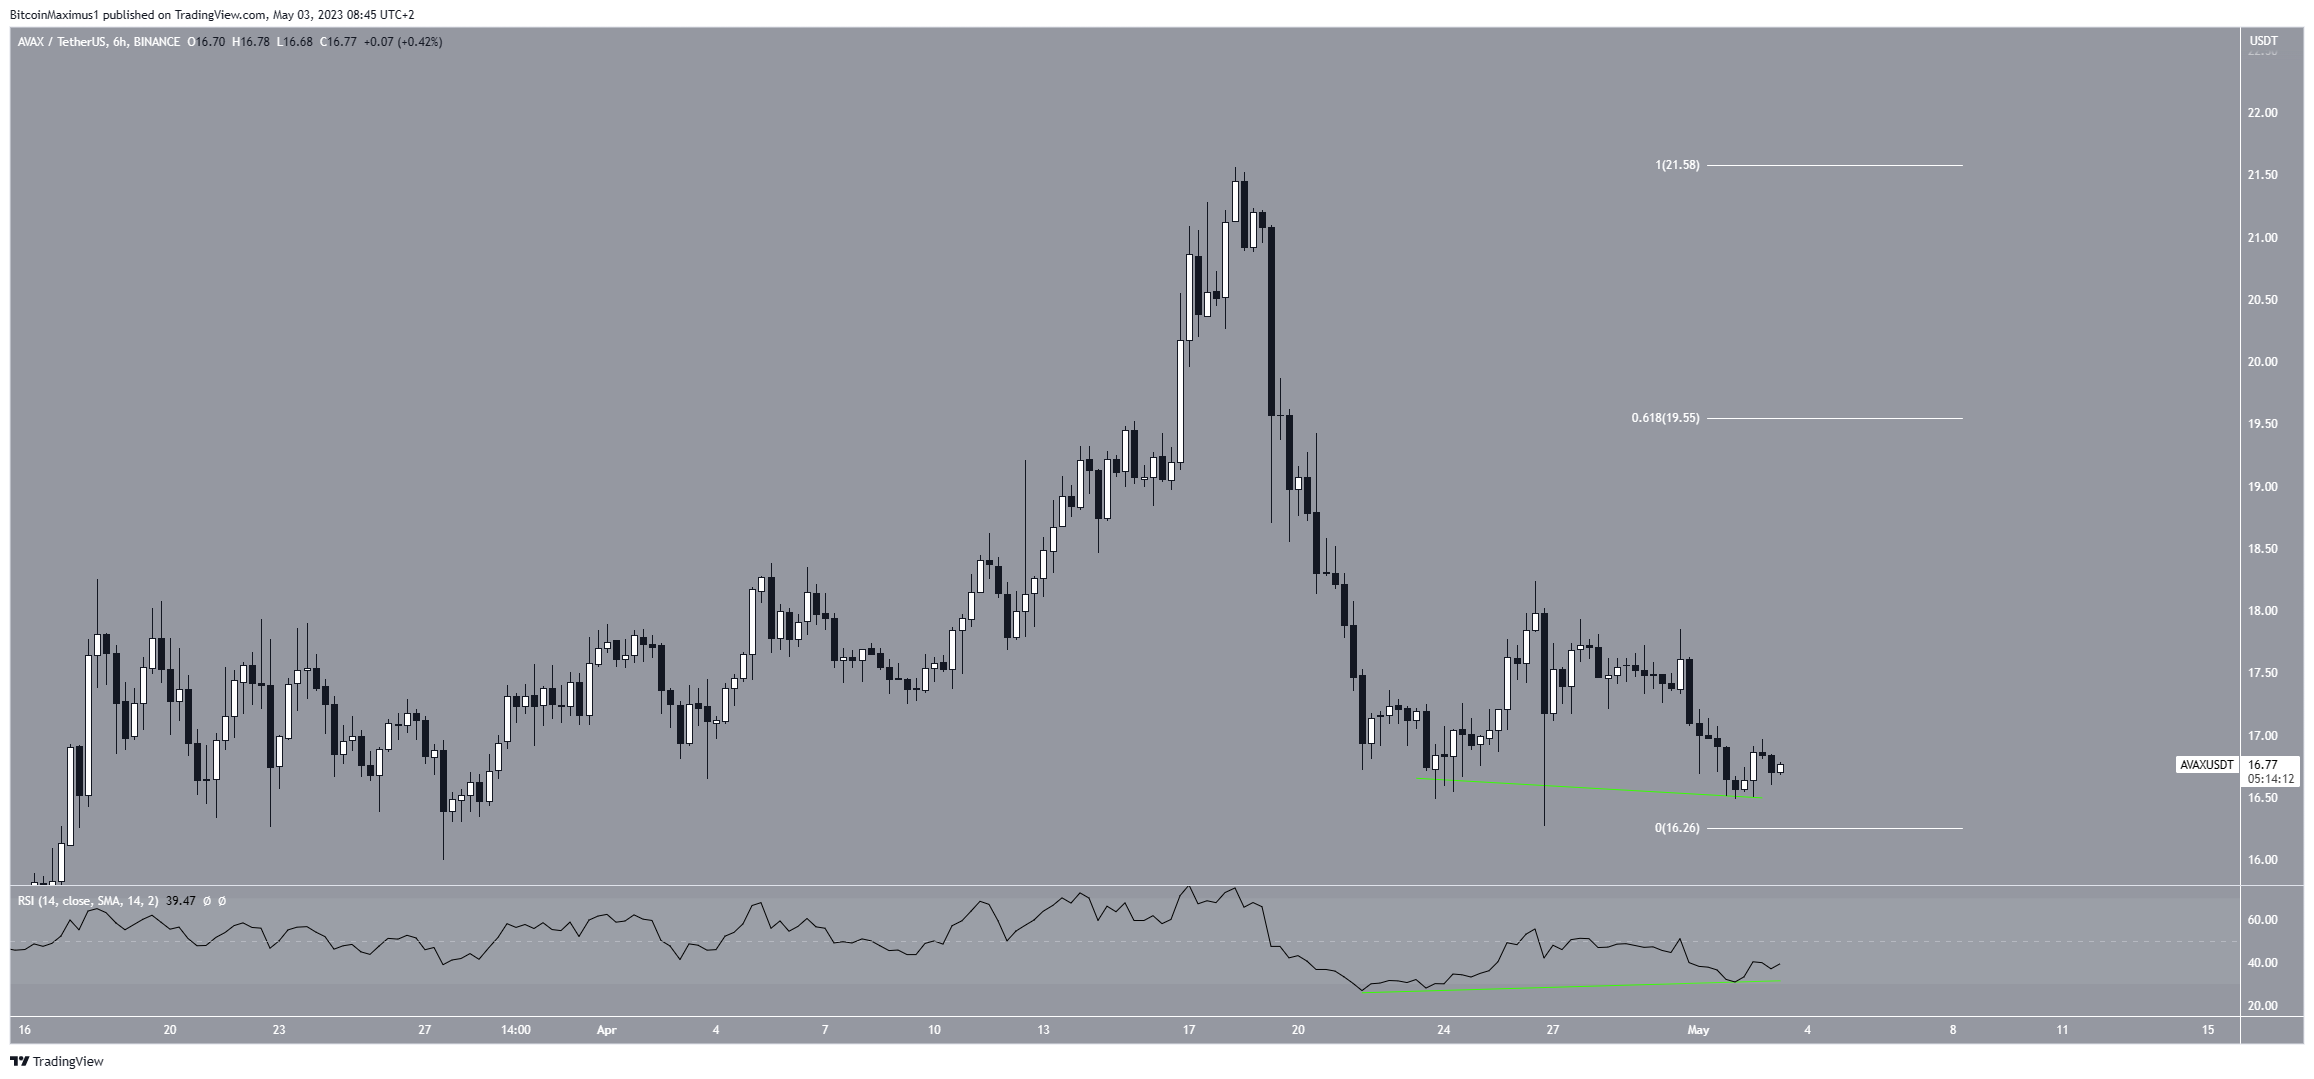
The technical analysis from the short-term six-hour time frame provides a more bullish AVAX price prediction. AVAX has created a double bottom, which is considered a bullish pattern. Therefore, it leads to upward movements in the future price most of the time.
Additionally, the double bottom has been combined with a bullish divergence in the Relative Strength Index (RSI) (green line). This is a type of bullish development in which a momentum decrease does not support a price drop This increases the validity of the double bottom.
So, if the double bottom materializes, the AVAX price can increase to the 0.618 Fib retracement resistance level at $19.55.
The principle behind Fibonacci retracement levels suggests that after a considerable price movement in one direction. The price will retrace partially to a previous price level before continuing in its original direction.
However, if the AVAX price decreases below the second bottom and the ascending support line, a sharp fall to the $14.20 area will likely transpire.


