
The Arbitrum (ARB) price failed to sustain its upward movement despite breaking out from a descending resistance line.
The price is now at risk of breaking down from its long-term structure, which could catalyze a sharp fall to $1.0.
Arbitrum Price Fails to Sustain Breakout
The ARB price has increased since April 24, when it reached a low of $1.30. The same day, it broke out from a descending resistance line and reached a high of $1.50 two days later.
Since the descending resistance line had been in place for a week, a breakout from it was expected to lead to a significant upward movement, confirming that the correction had ended.
However, the ARB price did not exceed the $1.50 horizontal resistance area (red icon).
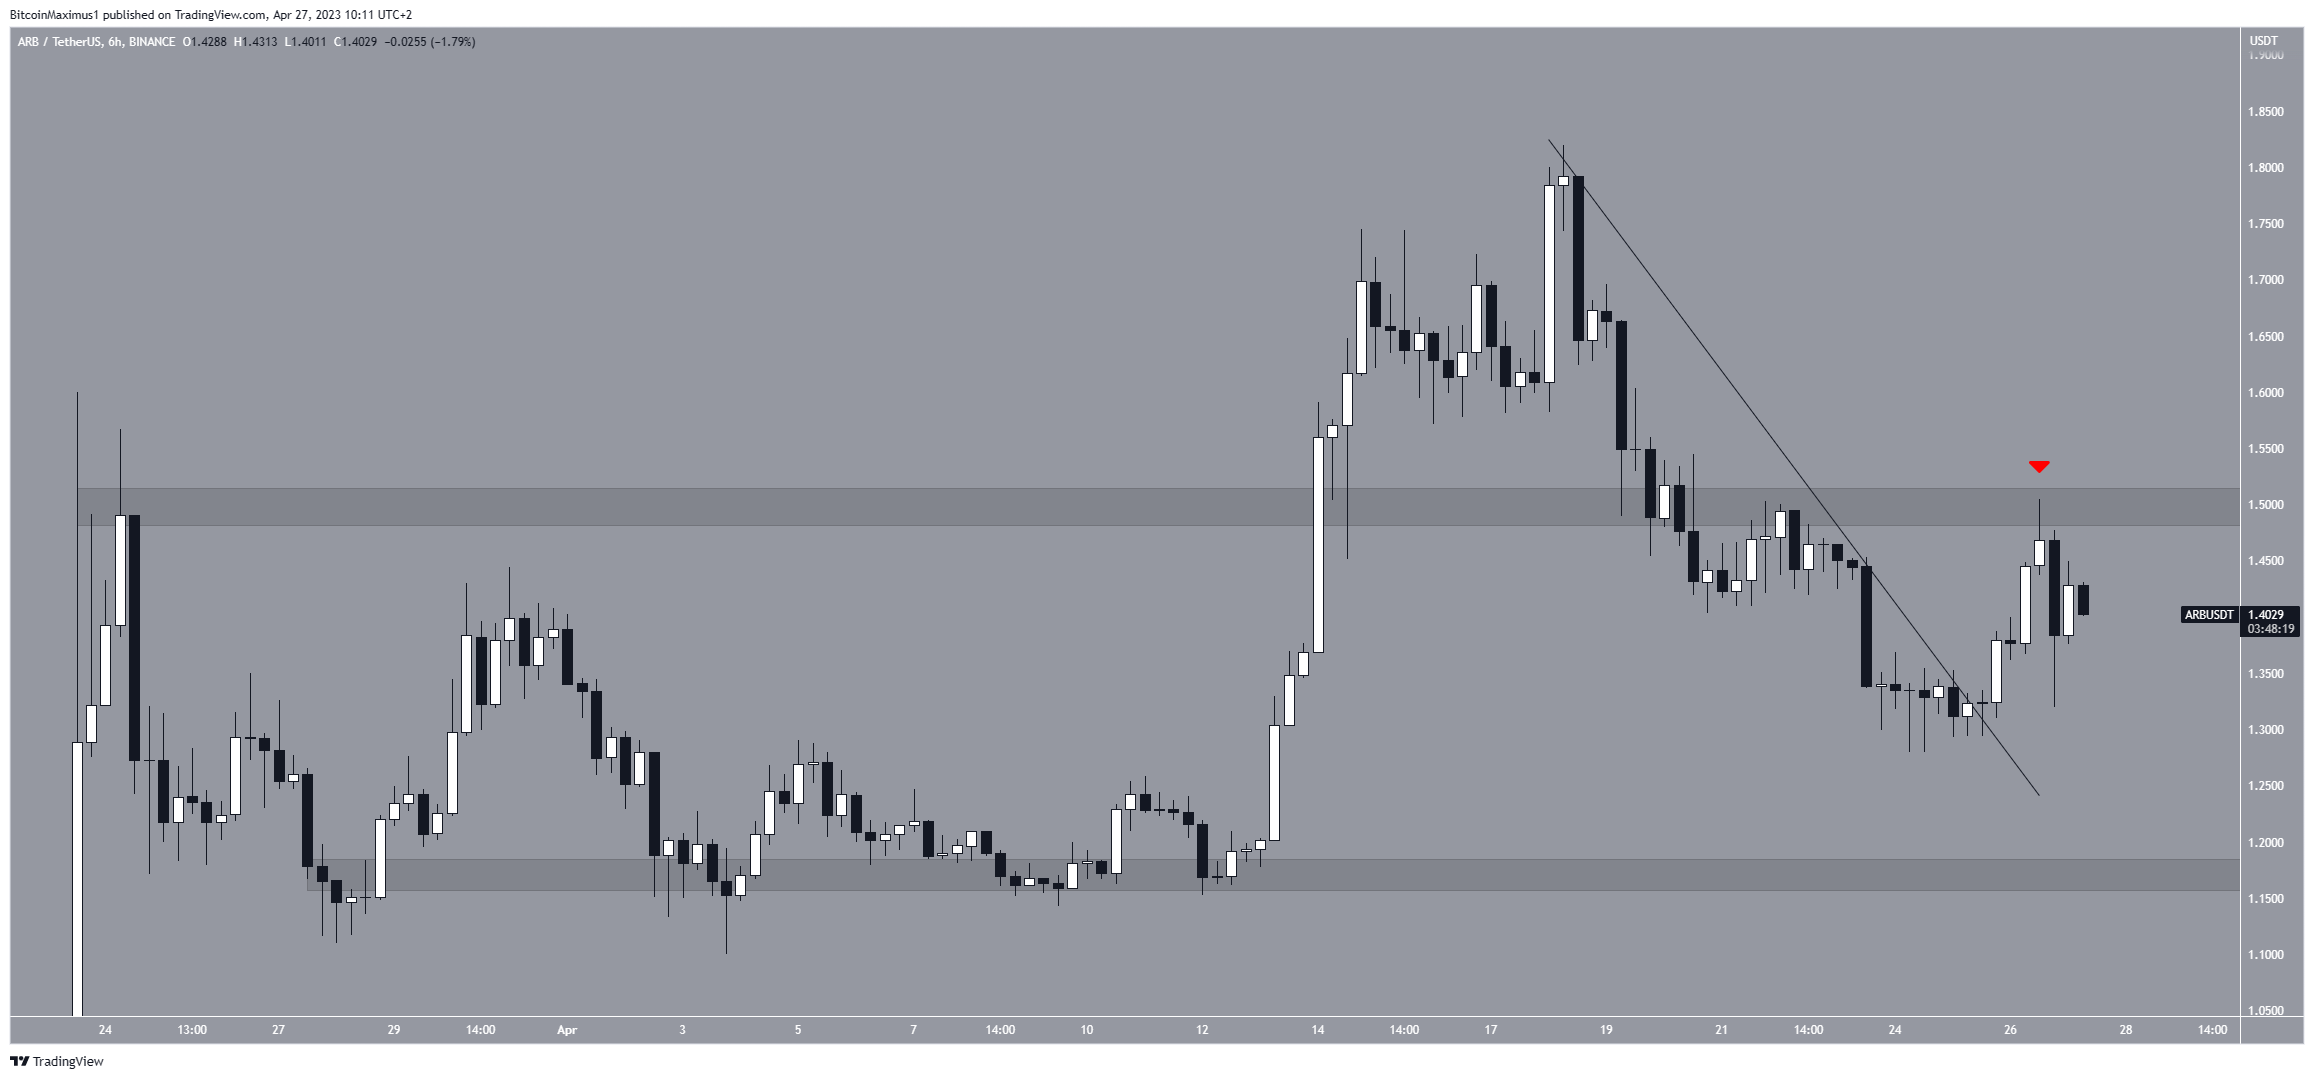
If the decrease continues, the next closest support area will be at $1.17. This would take the ARB price below its breakout level.
ARB Price Prediction: Will Price Fall Below $1.0?
The technical analysis from the long-term 12-hour chart provides a more clearly bearish ARB price prediction. The main reason for this is the presence of an ascending parallel channel.
The ascending parallel channel is a type of corrective pattern in which the price bounces between parallel resistance and support lines before eventually breaking down. The fact that the price trades in the lower portion of the channel makes a breakdown even more likely.
The $1.30 support area can act as the catalyst for the potential downward movement. Besides being the channel’s support line, the area is the 0.382 Fib retracement support level (white).
The theory of Fibonacci retracement levels suggests that after a substantial price move in one direction, the price will partially retrace or return to a prior price level before continuing in its original direction. This principle can be used to determine the peak of potential future upward movements.
So, its breakdown could initiate a sharp fall toward $1. But if the ARB price breaks out above $1.50, it could reach its all-time high at $1.80.
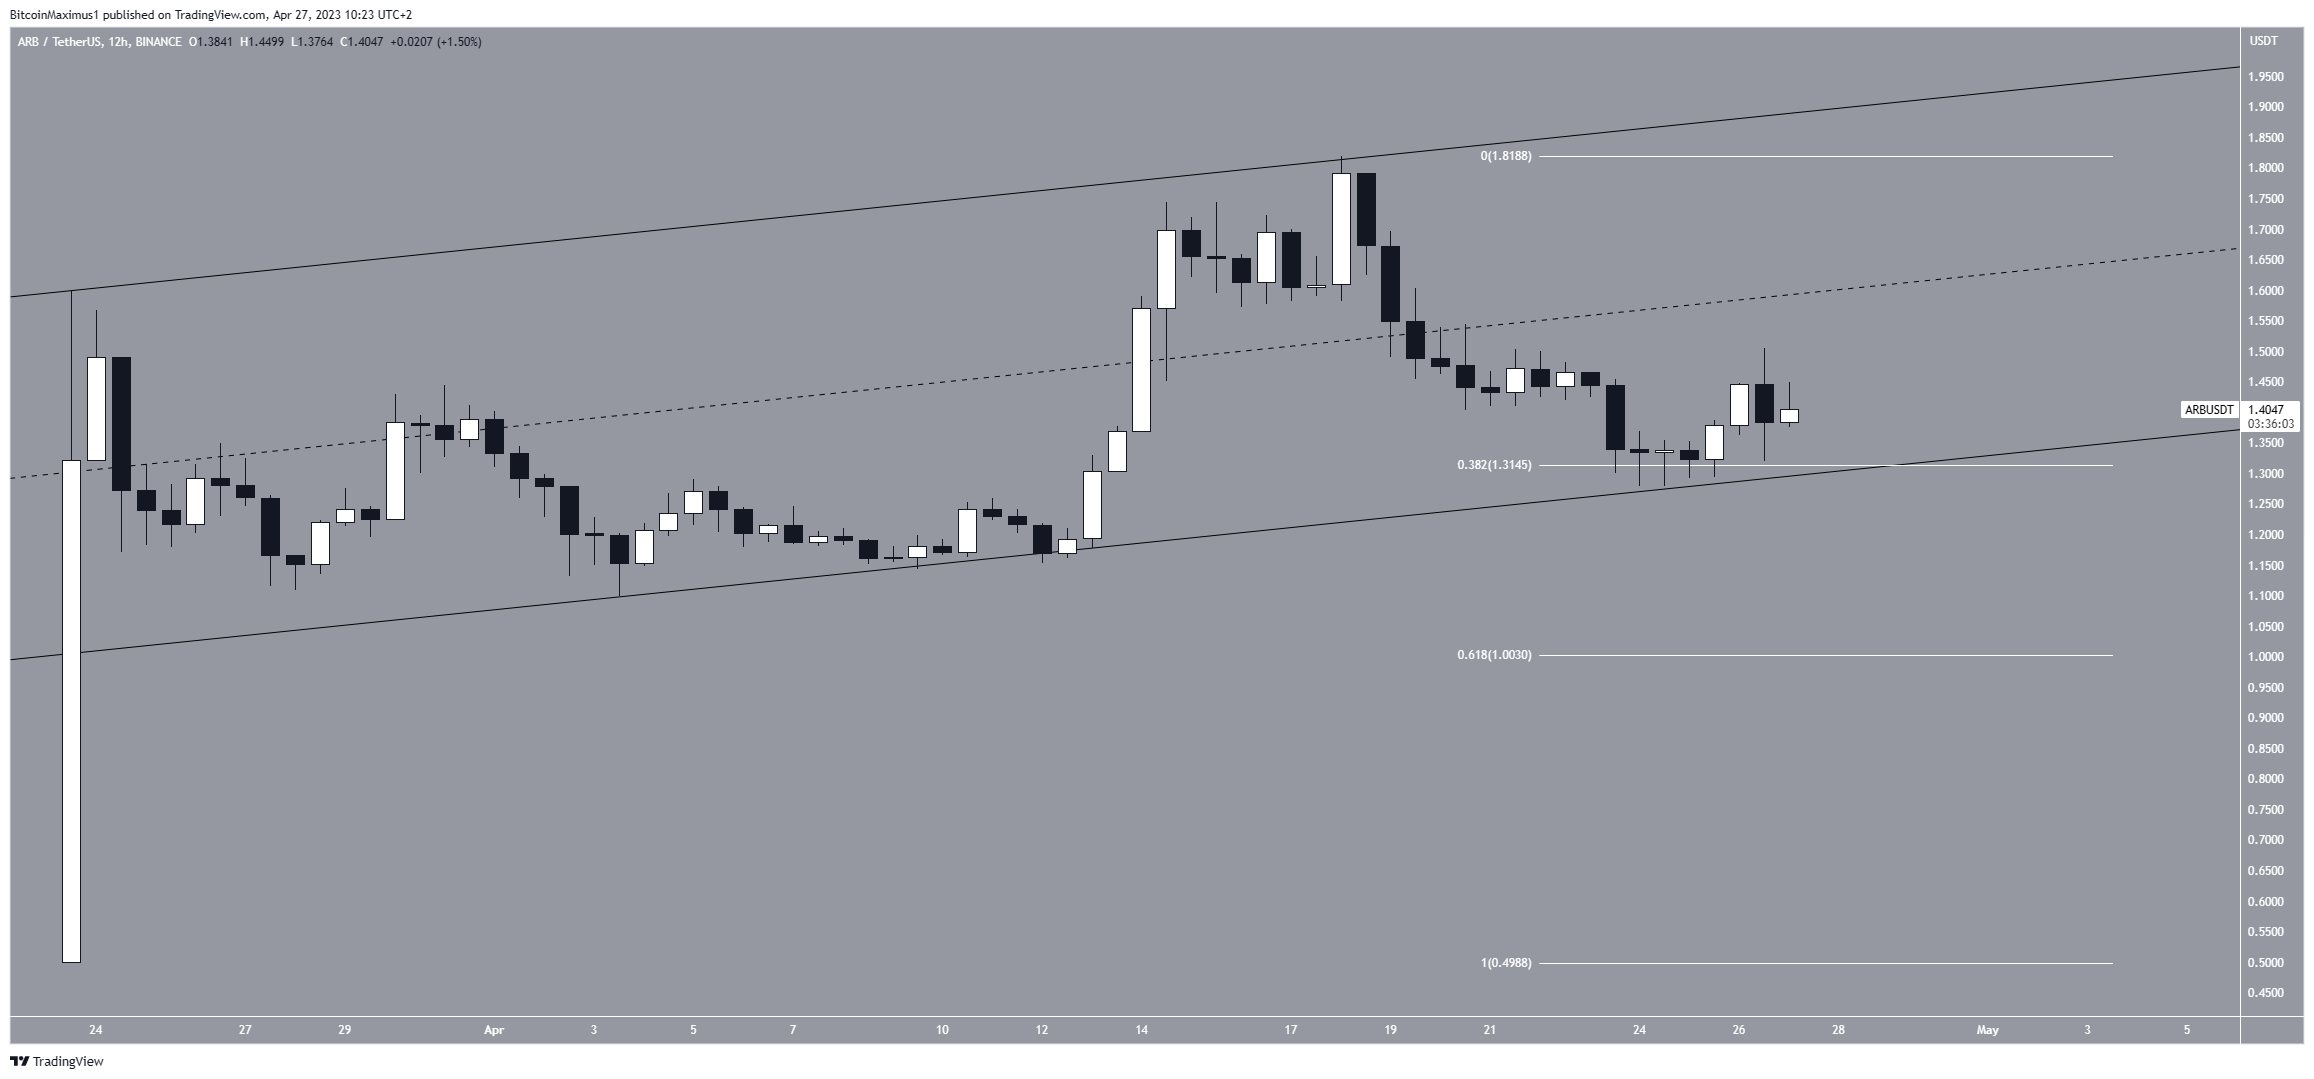
Furthermore, an increase and close above the channel’s midline will invalidate this bearish hypothesis. In that case, the ARB token price would likely increase higher, toward another new all-time high at $1.95.
For BeInCrypto’s latest crypto market analysis, click here.
Disclaimer
In line with the Trust Project guidelines, this price analysis article is for informational purposes only and should not be considered financial or investment advice. BeInCrypto is committed to accurate, unbiased reporting, but market conditions are subject to change without notice. Always conduct your own research and consult with a professional before making any financial decisions. Please note that our Terms and Conditions, Privacy Policy, and Disclaimers have been updated.
