For the uninitiated, Arbitrum is a widely popular layer-2 scaling resource for Ethereum, helping with affordable network fees and higher throughput. In this Arbitrum price prediction, we consider how the price levels corresponding to ARB — the native token — might move over time.
Arbitrum — the network — has been around since August 2021. Yet, the native token ARB was only launched on March 23, 2023. Since the token launch, ARB’s counter has seen some insane levels of trading actions courtesy of retail buyers and whales. With so much going on in relation to the price action, let’s check out the purported future price of ARB using fundamental and technical analysis.
KEY TAKEAWAYS
➤ARB, the governance token, launched in March 2023.
➤Despite slipping to 7th place in the DeFi rankings (2025), Arbitrum remains a dominant player in scaling Ethereum with Optimistic Rollups.
➤Arbitrum’s growth depends on ecosystem adoption, scaling upgrades, and maintaining its competitive edge against other layer-2 solutions.
- Arbitrum (ARB’s) long-term price prediction until the year 2035
- Arbitrum price prediction and technical analysis
- Arbitrum (ARB) price prediction 2024 (concluded)
- Arbitrum (ARB) price prediction 2025 (conservative and generous levels)
- Arbitrum (ARB) price prediction 2030
- ARB price prediction and the role of fundamentals
- Arbitrum price prediction and the associated tokenomics
- Is the Arbitrum price prediction model accurate?
- Frequently asked questions
Arbitrum (ARB’s) long-term price prediction until the year 2035
Outlook: Bullish
If you plan on holding ARB longer, through 2035 or even further, here is a quick table that captures the Arbitrum price prediction levels up to 2035:
| Year | Maximum price of ARB | Minimum price of ARB |
| 2025 | $4.55 to $5.49 | $2.97 |
| 2026 | $9.02 | $5.59 |
| 2027 | $10.82 | $6.71 |
| 2028 | $13.25 | $10.33 |
| 2029 | $20.28 | $12.57 |
| 2030 | $24.41 | $19.03 |
| 2031 | $28.07 | $21.89 |
| 2032 | $49.12 | $30.45 |
| 2033 | $58.95 | $36.55 |
| 2034 | $76.63 | $59.77 |
| 2035 | $88.13 | $68.74 |
Arbitrum price prediction and technical analysis
Before we go deep into the technical analysis of ARB, it is important to note that there wasn’t a lot of historical data available for us to accurately chart everything up to 2035. Therefore, we shall frequently refer to the price movement of Polygon (POL) and Optimism (OP) to help you identify the short-term and long-term ARB prices.
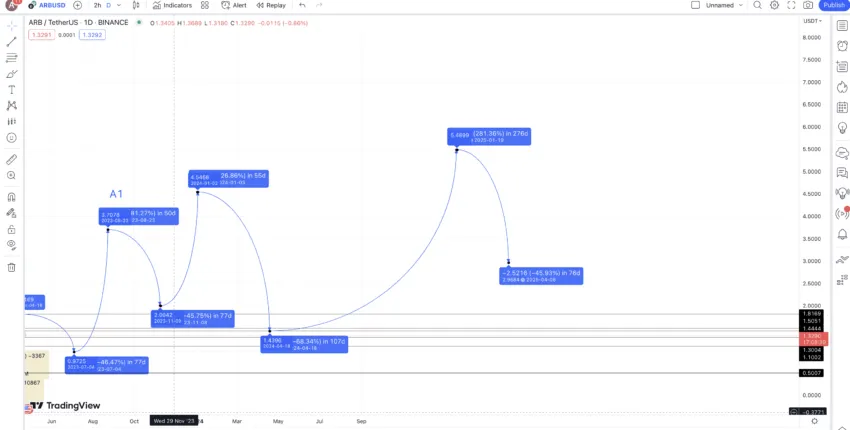
Arbitrum (ARB) price prediction 2024 (concluded)
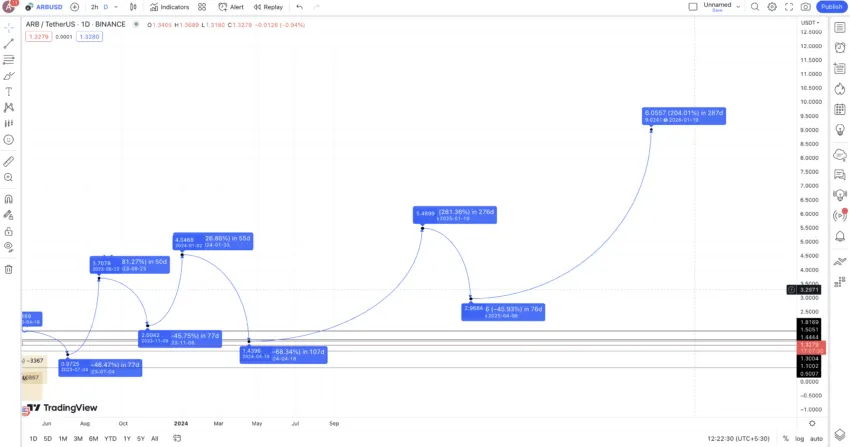
To predict the ARB price prediction for 2024, we visited the weekly chart of ARB, as there is enough data available.
Based on the chart, we tracked ARB’s move from A to B, B to C, C to D, and D to E to predict the. next leg of movement.
A to B: 28 days and +262.90 %
B to C: 56 days and -49.97%
C to D: 35 days and +48.48%
D to E: 56 days and -45.16%
All these figures hinted at a possible 2024 level of $2.5. Apparently, ARB managed to chart a high of $2.16.
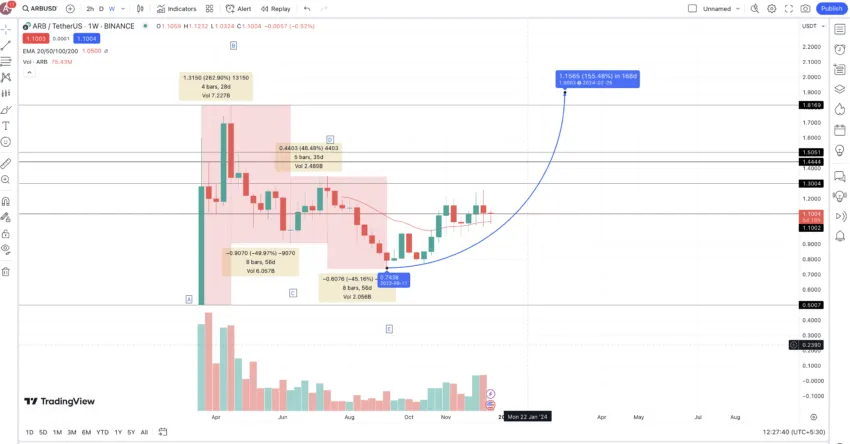
Arbitrum (ARB) price prediction 2025 (conservative and generous levels)
Outlook: Bullish
The predictions for 2025 include drops of 68.44%, 23.34%, and 46.42%, respectively, from the tables created earlier. Therefore, with three data points, we can assume the next high-to-low drop percentage is 46%.
Now that we have the expected price of ARB at $3.7 in 2023 (which wasn’t reached), the next low could surface at a drop of 46% in 2025, keeping two-year cycles in mind. Therefore, the next low for ARB could be at $2, provided ARB first manages to move higher than $4.5 in the first place, anytime in 2025.
If we now use the low-to-high moves from the ARB’s chart alone, the next high could surface at 203.95% (taking the average of 126.82% and 281.075%). Despite not reaching the 2023 or 2024 high, we are optimistic about ARB as the bull market is pushing the popular tokens higher.
And while 203.95% looks significant, Polygon and Optimism are still seeing a bulk of developer action for the layer-2 scaling platforms. Therefore, a price growth of 126.82% seems more plausible in the next few months. This puts the price of ARB tokens at $4.55 by late 2025. Do note that this is the more conservative high for 2025.
Road to 2025 (more details)
If we revisit the ARB and OP price chart, a move of 281.075% might be on the cards after a low of $1.43 or even $2, if the market conditions stay bullish in 2025.
This puts the high in 2025 at $5.49. But then, if OP and MATIC also keep growing, we can expect this high to surface closer to early 2025.
The next low could go back to the average drop of 46%, using ARB’s previous percentage drops of 68.44%, 23.34%, and 46.42%.
This would put 2025 low for ARB tokens at $2.97.
Projected ROI from the current level: 399%
Arbitrum (ARB) price prediction 2030
Outlook: Very bullish
If you take a look at our MATIC price prediction for 2025, the expected high and low could be $5.38 and $1.75, respectively. Our Arbitrum price prediction puts 2025 high at $5.49, which is similar to that of MATIC.
Hence, we can assume that the price of Arbitrum follows the same growth trajectory as that of Polygon and its native cryptocurrency MATIC.
From the 2025 low, the next high could follow a growth curve of 203.95% (taking the average of 126.82% and 281.075%). For the sake of easy calculations, we can expect this high, or $9.02, to surface in 2026.
We now have the 2023 low ($0.9725) and the 2026 high ($9.02). It is now time to extrapolate the path between them to locate the price of ARB tokens till 2030. Do note that this extrapolation might not be entirely accurate, but it can still provide a rough estimate of how ARB might move in the years to come.
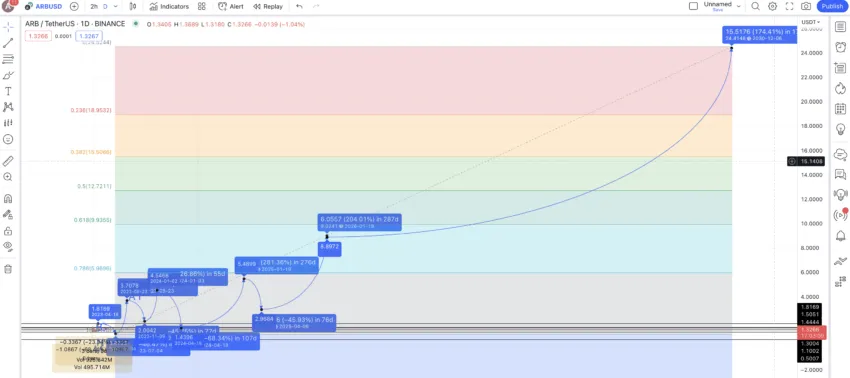
Extrapolating the same puts the price of ARB at close to $24.50 by the end of 2030.
Projected ROI from the current level: 2119%
ARB price prediction and the role of fundamentals
We shall now look at the fundamentals to understand the growth curve of Arbitrum. That will help us better relate the price of ARB to similar projects and token launches involving Optimism and Polygon — other popular layer-2 platforms for Ethereum.
Arbitrum uses Optimistic Rollups to scale Ethereum DApps. Needless to say, the network itself is EVM compatible, highly scalable, and can support around 40,000 transactions per second.
The roadmap for Arbitrum
Regardless of what has transpired already in regard to Arbitrum, here is everything that might be in store for this layer-2 scaling giant in the years and months to come:
- An upcoming layer-3 scaling resource called “Orbit.”
- Multi-language DApp deployment
- Expanding the validator set to institutions
- Integration with The Graph Protocol
- Multi-lingual Dapp coverage
- Native MEV Solutions (New for 2025)
- Arbitrum Nitro 2.0 (Next-Gen Optimizations)
- Ecosystem Expansion Grants
- Sustainability Initiatives
Arbitrum price prediction and the associated tokenomics
Tokenomics plays a major role in determining the price action of any cryptocurrency. As for ARB, the total supply cap is 10 billion, with close to 19% being moved out already as nearly claimed airdrops and unlocks. Do note that ARB is primarily a governance token, not intended to pay gas or transaction fees.
Here is what the initial token allocation looks like:
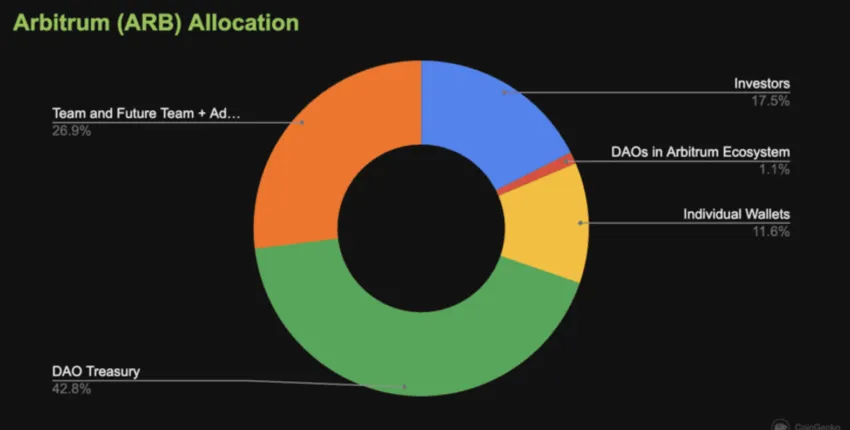
As of now, the price fluctuations are mostly due to the buying and selling of unlocked ARB tokens.
Is the Arbitrum price prediction model accurate?
Our Arbitrum price prediction model considers fundamentals, on-chain metrics, and technical analysis. Plus, we have drawn parallels with the price action of the other layer-2 Ethereum scaling solutions like Optimism and Polygon. All of that makes this ARB price prediction piece as realistic as possible. However, these levels might change depending on the state of the broader crypto market.
Disclaimer: This analysis highlights Arbitrum (ARB) and its market outlook. As with any cryptocurrency, ARB is subject to high volatility and market risks. Conduct your own research (DYOR) and consult a financial advisor before making investment choices.
Frequently asked questions
Can Arbitrum reach $100 dollars?
Who owns arbitrum?
Is the Arbitrum chain safe?
Will ARB crypto go up in 2030?
Disclaimer
In line with the Trust Project guidelines, the educational content on this website is offered in good faith and for general information purposes only. BeInCrypto prioritizes providing high-quality information, taking the time to research and create informative content for readers. While partners may reward the company with commissions for placements in articles, these commissions do not influence the unbiased, honest, and helpful content creation process. Any action taken by the reader based on this information is strictly at their own risk. Please note that our Terms and Conditions, Privacy Policy, and Disclaimers have been updated.