


On August 9, Aptos Labs announced that it was partnering with Microsoft in order to drive Web3 into the mainstream. Aptos Labs will introduce Aptos Assistant, which will help bridge web2 to web3 for everyday internet users.
Aptos and Microsoft also agreed to explore various solutions, such as tokenization and Central Bank Digital Currencies (CBDCs) to advance the adoption of web3 further. Shortly after the announcement, the APT price bounced by 15%, in an upward movement that is still ongoing.
Can Aptos (APT) Price Break Out From Resistance?
The technical analysis from the daily time frame shows that the APT price broke out from a descending resistance line on July 1. Before the breakout, the line had been in place for 155 days.
However, the APT price failed to sustain its upward movement. Rather, it was rejected by the $8 resistance area and fell below its breakout level. This occurred despite the Aptos daily active users surging by 800% after the Chingari Integration.
But, APT began another upward movement on August 9 and is currently trading inside the $8 area again. If it breaks out, it can increase by 65% to the next resistance at $13.
Read More: Best Upcoming Airdrops in 2023
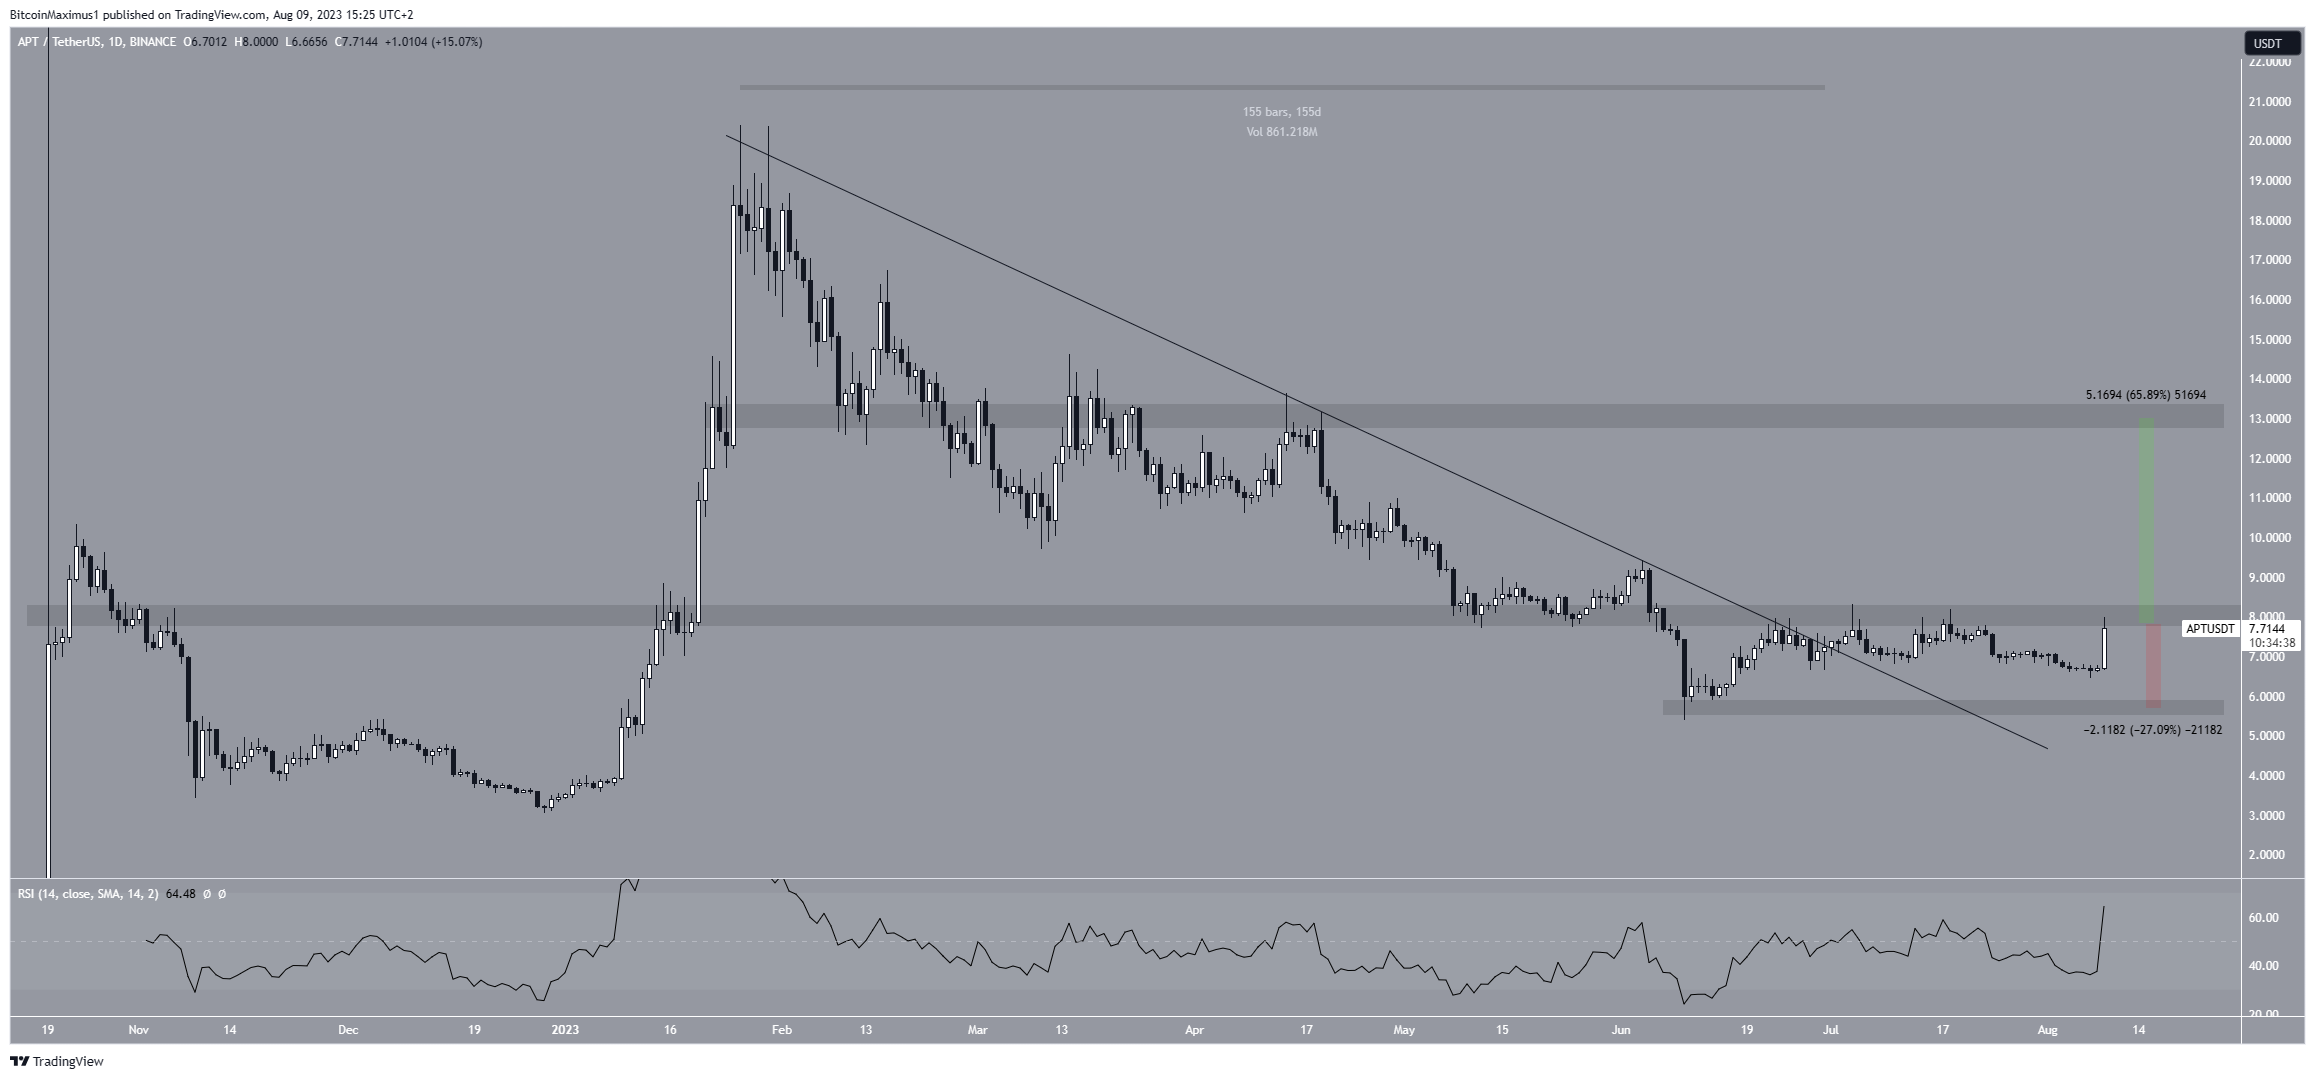
The daily RSI supports the continuing increase. Traders utilize the RSI as a momentum indicator to assess whether a market is overbought or oversold and to determine whether to accumulate or sell an asset.
If the RSI reading is above 50 and the trend is upward, bulls still have an advantage, but if the reading is below 50, the opposite is true. The indicator is above 50 and increasing, both signs of a bullish trend. Thus, it suggests that the APT price will likely break out and reach the $13 resistance.
Despite this bullish reading, the APT price prediction will turn out bearish if the price fails to clear the $8 resistance area. A rejection could lead to a 27% drop in the $5.70 horizontal support area.
For BeInCrypto’s latest crypto market analysis, click here.



