


BeInCrypto looks at five altcoins that increased the most in this week’s crypto market, specifically from August 11 to 18.
The term altcoin refers to cryptocurrencies other than Bitcoin (BTC). These bullish altcoins have stolen the crypto news and cryptocurrency market spotlight this week as the biggest gainers:
- SEI price increased by 650%
- THORChain (RUNE) price increased by 33.32%
- Akash Network (AKT) price increased by 22.83%
- DEXE price increased by 9.85%
- UNIBOT price increased by 6.97%
SEI Price Leads Altcoin Gainers
The SEI price increased massively on August 15. Following its launch on Binance, its price reached a new all-time high of $0.48 as soon as trading commenced. However, it has fallen since. The decrease has followed a descending resistance line since August 16.
While initial token listings can see some huge price swings, it generally can take a few days for the price to stabilize.
On August 18, SEI bounced and broke out from the resistance line. However, it has yet to initiate any upward movement.
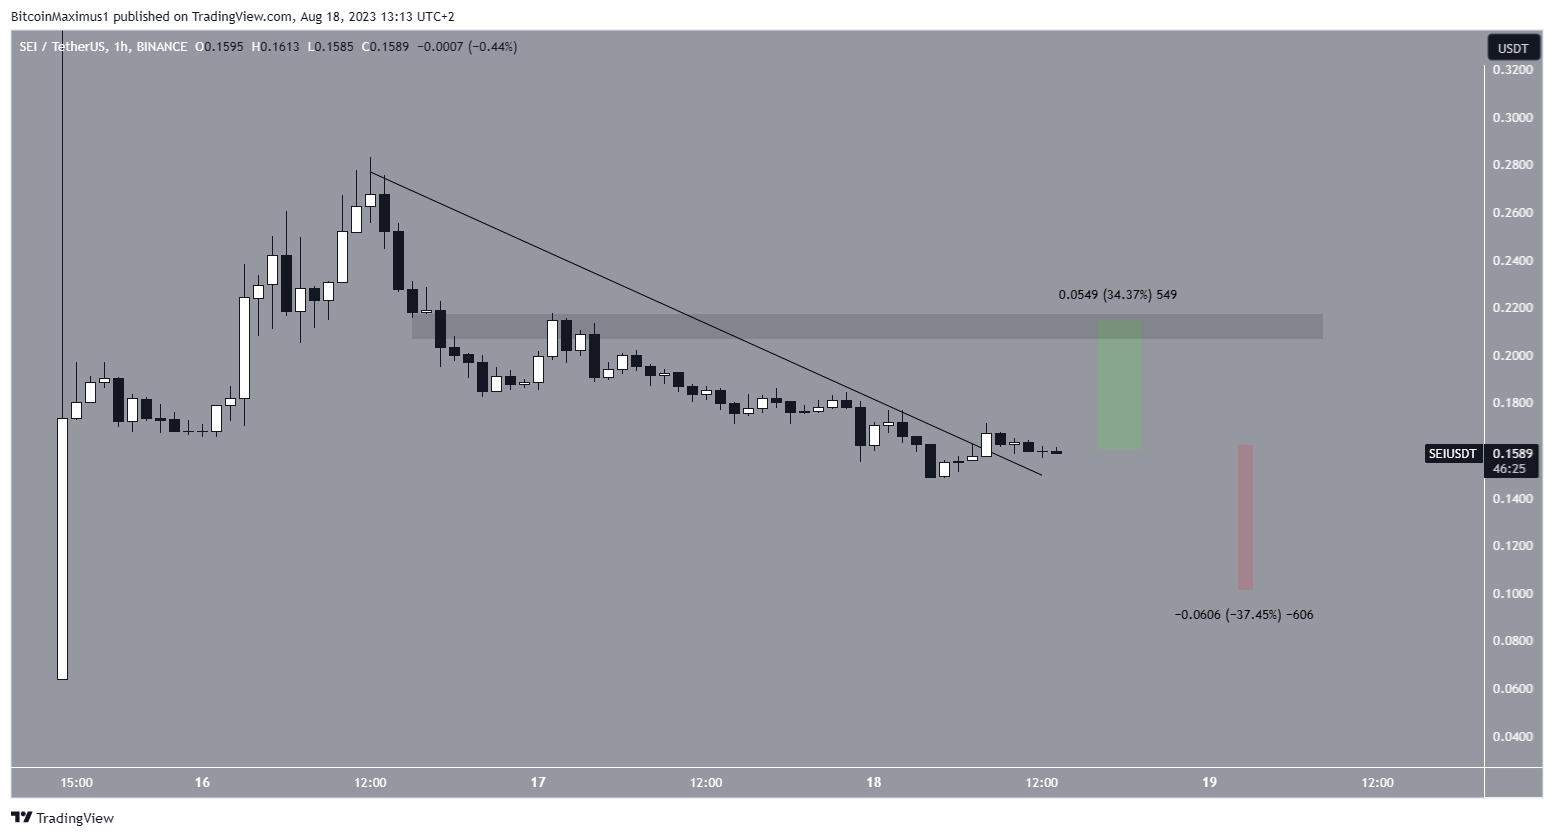
If the SEI price moves upwards, it can increase by 35% to the $0.21 resistance area. However, a 37% drop to $0.10 will be expected if it breaks down.
THORChain (RUNE) Price Breaks Out After Higher Low
The RUNE price has moved upwards since June 14. After creating a higher low on July 30, the price accelerated its rate of increase. On August 12, RUNE broke out from a descending resistance line that had been in place since the beginning of February.
Currently, RUNE trades inside the $1.50 horizontal resistance area. Whether it breaks out or gets rejected will be crucial in determining the future trend.
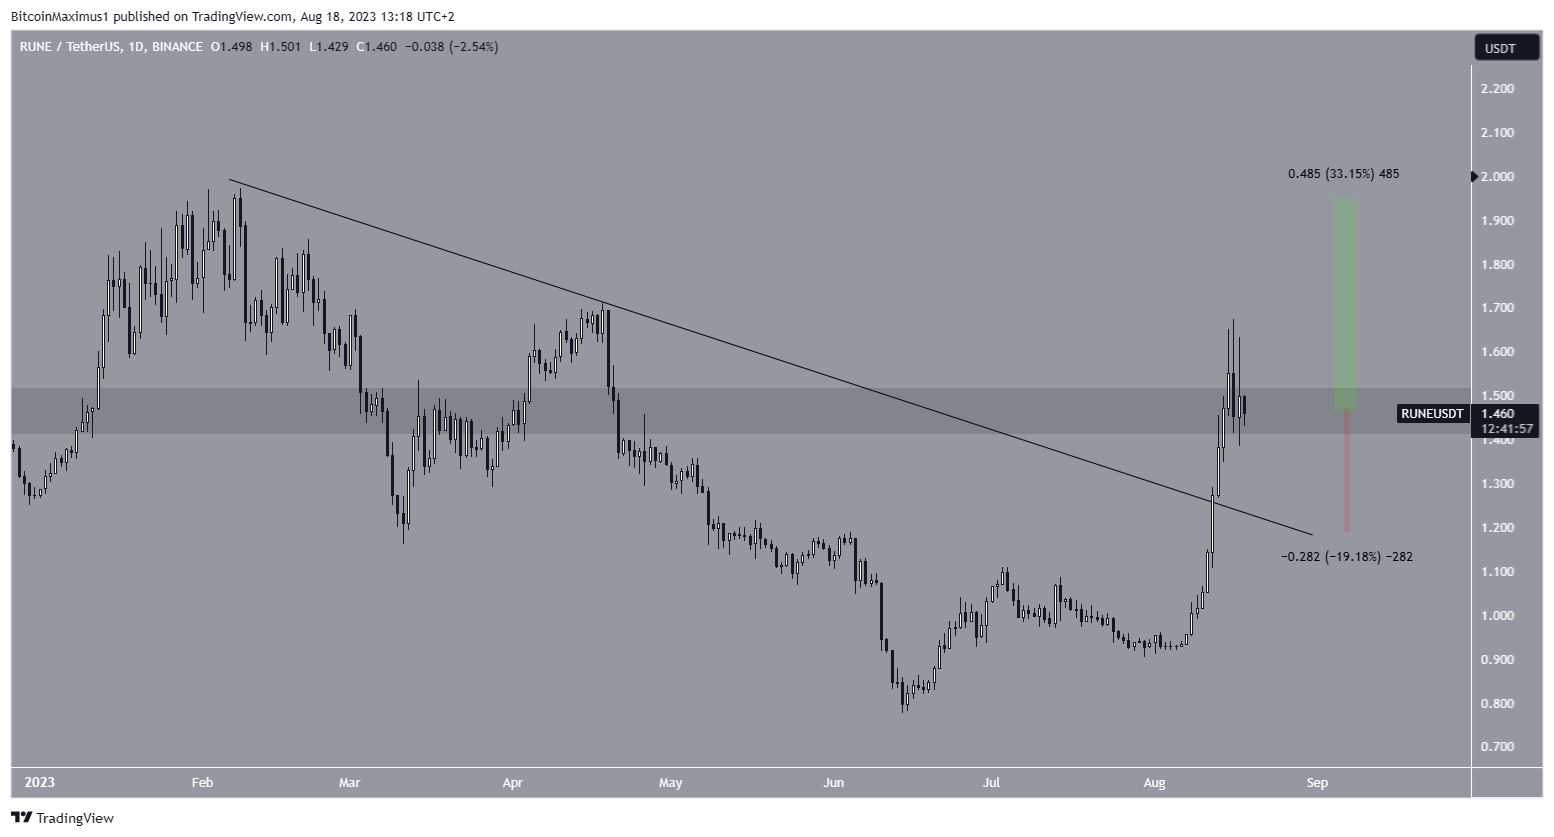
If RUNE breaks out, it can increase by 33% to the next resistance at $1.90. On the other hand, if it gets rejected, a 19% drop to the previous descending resistance line will be likely. The line is currently at $1.20.
Akash Network (AKT) Price Breaks Out From Triangle
The AKT price traded inside a symmetrical triangle in the period between June and August. While the triangle is considered a neutral pattern, it transpired after an upward movement. Therefore, a breakout from it was the most likely future price scenario.
On August 8, AKT broke out and reached a high of $1.44 six days later. The high was made right at the 2.61 Fib extension of the previous increase.
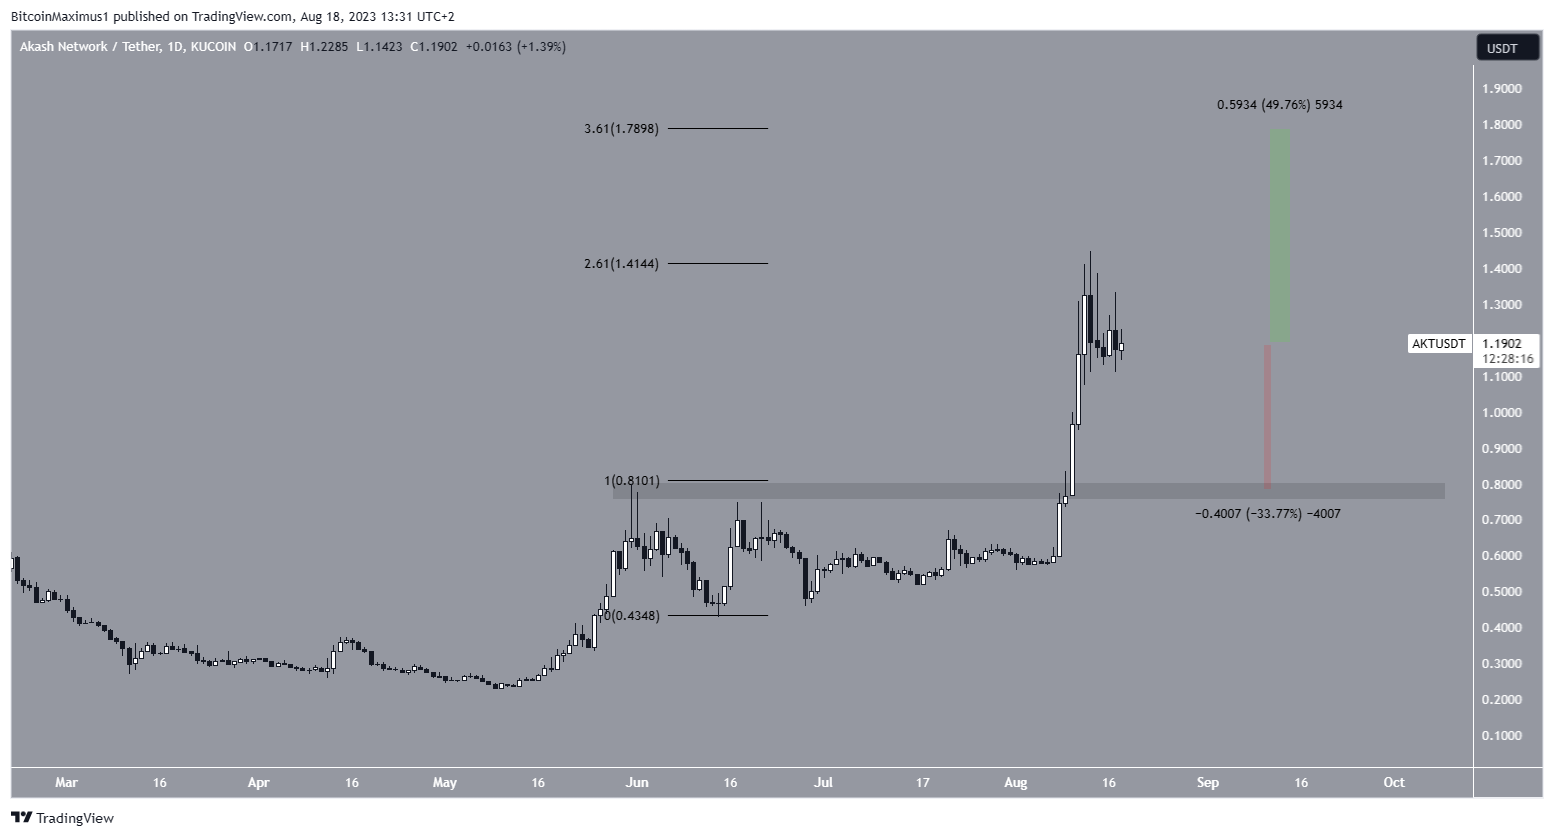
If the upward movement continues, the next resistance will be at $1.80, at the 3.61 Fib extension of the same increase. This would be an upward movement of 50%.
On the other hand, in case a bearish trend reversal transpires, AKT can fall by 33% to the closest support at $0.80.
Looking For a New Exchange? These Are the Best Crypto Sign-Up Bonuses in 2023
DEXE Reclaims Horizontal Level
The DEXE price has increased since June 5. The upward movement caused a reclaim of the $2.20 horizontal area and led to a high of $3.11 on July 4.
While the price has fallen since it validated the $2.20 area on August 17 (green icon) and has seemingly begun another upward movement, DEXE has yet to break out from a descending resistance line.
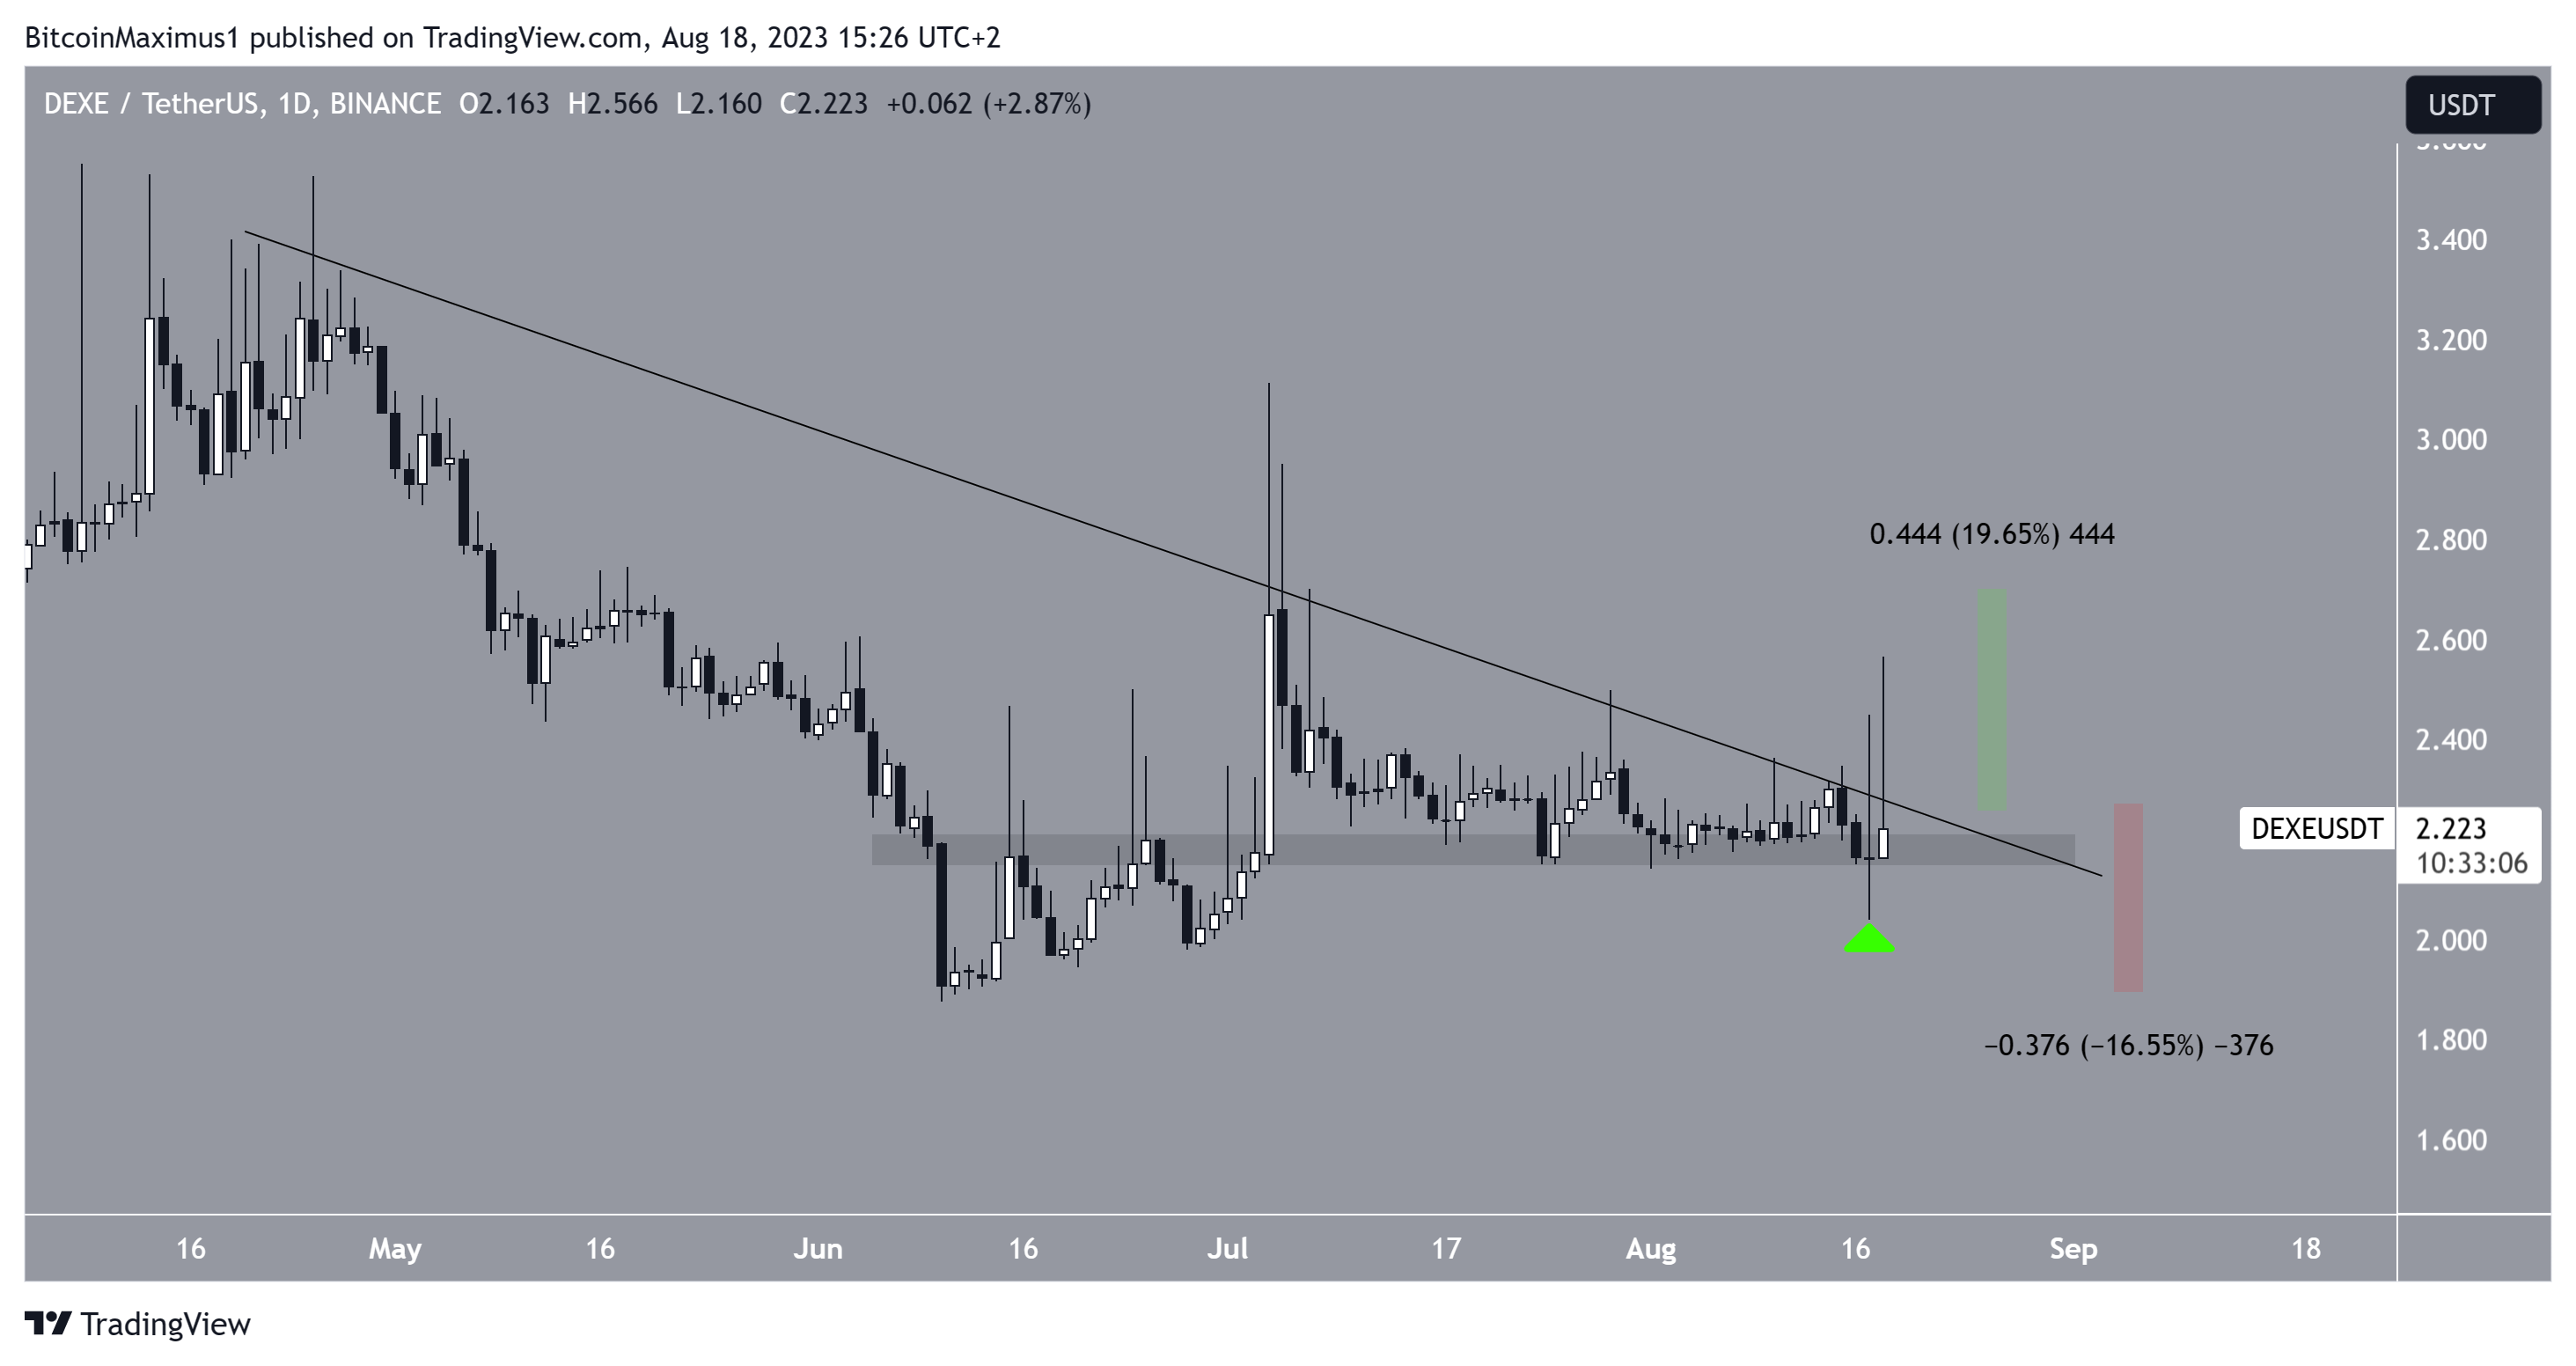
A 20% increase to $2.70 will be expected if it does. However, if DEXE breaks down below $2.20, the price can fall by 17% to $1.90.
UNIBOT Deviates Above Range High
The UNIBOT price has fallen since its all-time high of $245 on August 16. The decrease was especially important since it rendered the breakout above the $205 area as only a deviation.
The price has fallen since the deviation and reached the $170 support area on August 17 (green icon). This is a crucial area since it has provided support since August 8.
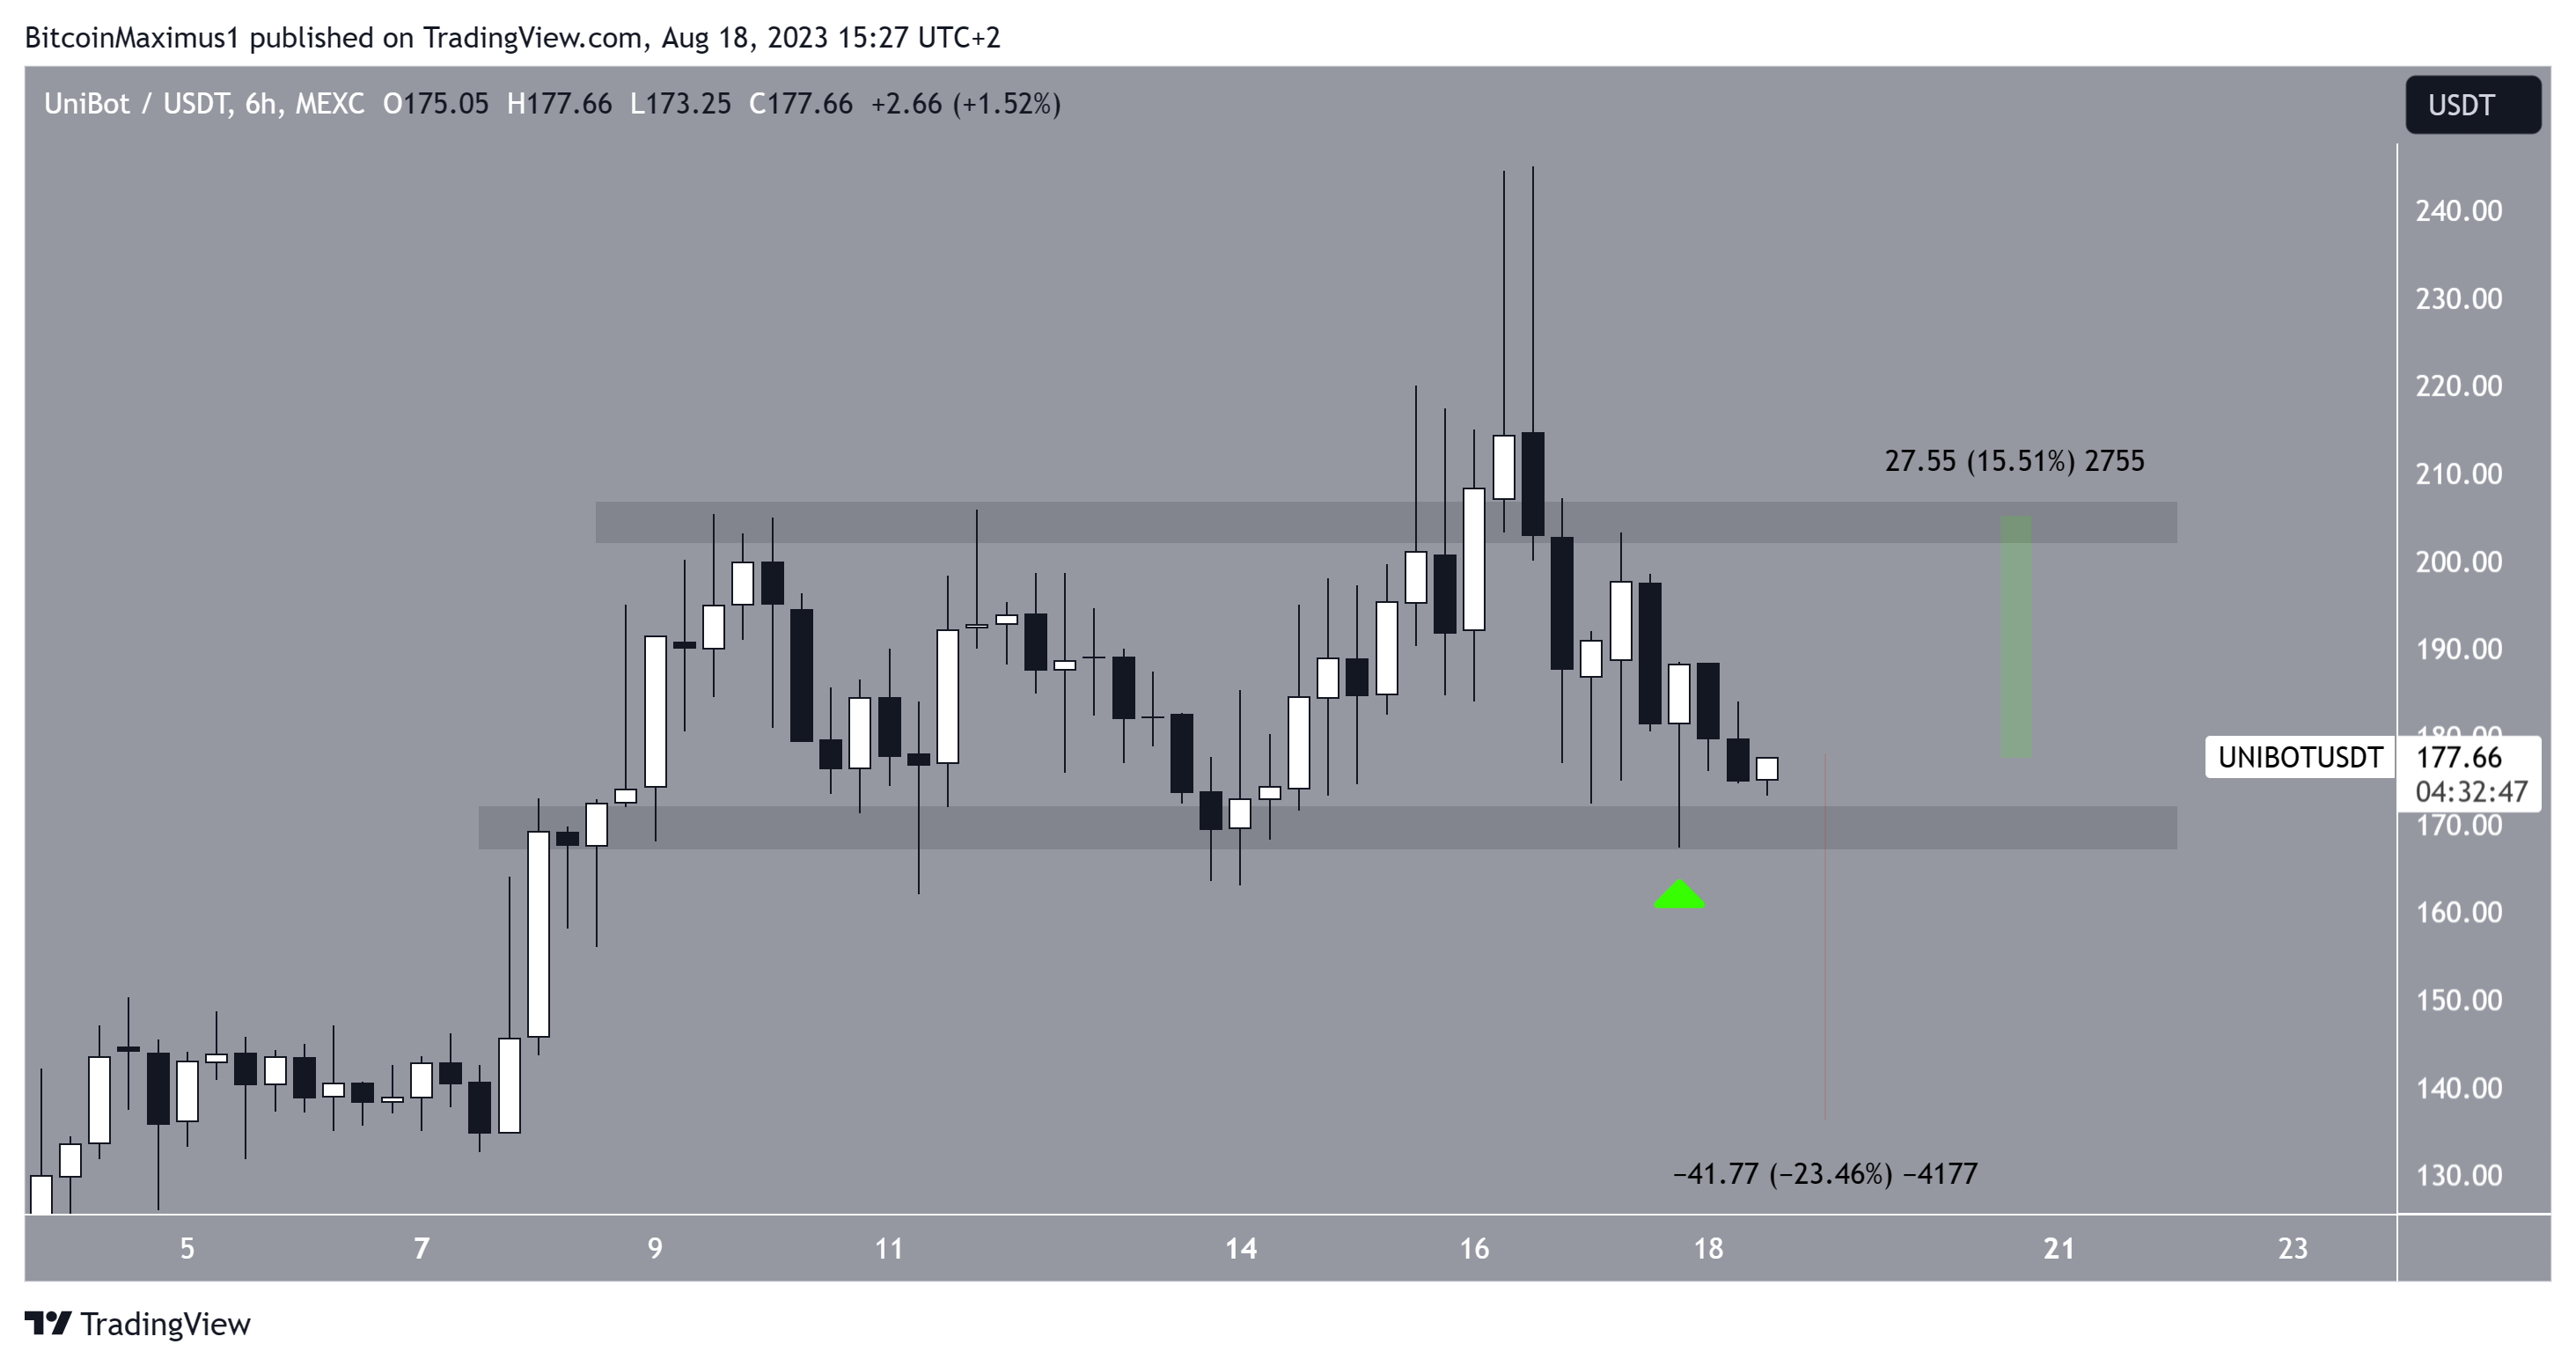
If UNIBOT breaks down, it can fall by 23% to $140. However, it can retest the $205 area if the price bounces. This would be an increase of 15%, measuring from the current price.
For BeInCrypto’s latest crypto market analysis, click here.


