


The price of Cardano (ADA) is trading inside a corrective pattern and has created a bullish double-bottom pattern.
Despite these bullish signs, ADA has fallen below an important horizontal support level. The bullish trend reversal cannot be confirmed until the price reclaims it.
Cardano Price Falls Below Support but Creates Bullish Pattern
The technical analysis from the daily timeframe provides mixed signs for ADA.
On the bearish side, the price has fallen below the $0.26 horizontal support area. This is a critical area since it has provided support since the June 10 low. At the time, the price bounced and created a long lower wick (green icon) before validating the area as support.
It is hovering just above the $0.25 horizontal support area. This is an important support area that has been in place since the start of the year.
Crypto investing, simplified. Get ADA price predictions here.
However, the price action since July 14 has been contained inside a descending parallel channel. These channels usually contain corrective patterns. If so, it would mean that the decrease since July 14 is corrective rather than the beginning of a new downward movement. In this case, a breakout from the channel would be likely.
Furthermore, the price has created a double bottom pattern since August 14. The double bottom is also considered a bullish pattern and has also been combined with a bullish divergence in the RSI (green line).
A bullish divergence occurs when a price decrease is combined with a momentum increase. It usually leads to bullish trend reversals, and this is even more likely since it coincides with a bullish pattern. Price action inside the area gives conflicting signs. On the bullish side, ADA has seemingly created a triple bottom pattern (green icons).
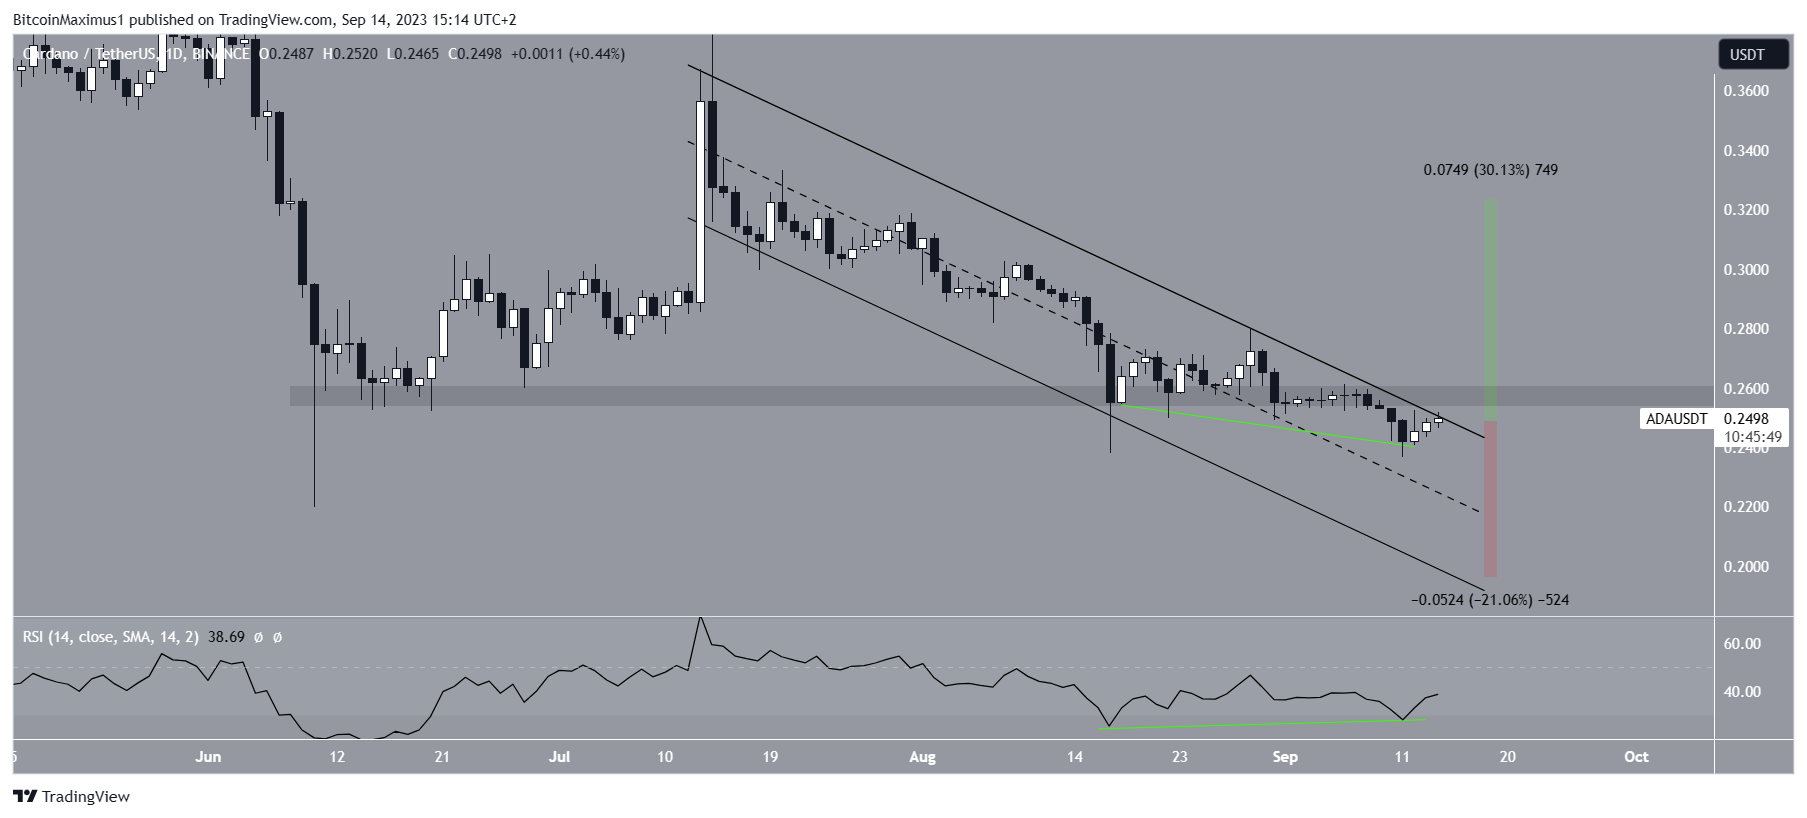
An ADA price breakout from the channel will likely lead to a 30% increase to the next resistance at $0.32. However, if the price gets rejected, a 20% drop to the channel’s support line at $0.20 will likely be the future price scenario.
ADA Price Prediction: Will Price Reclaim Horizontal Support Level?
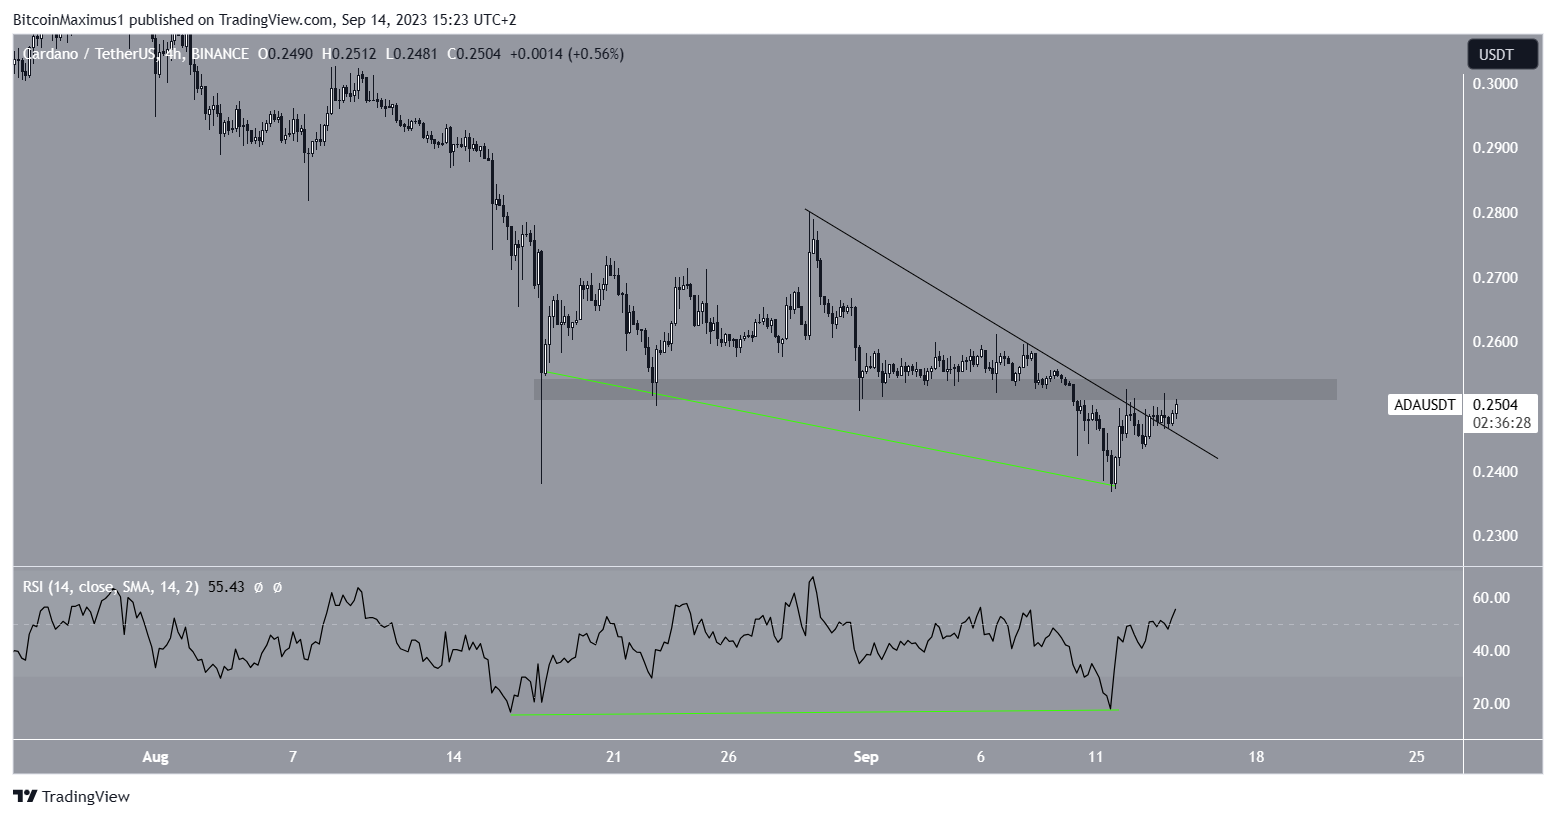
Similarly to the daily timeframe, the six-hour chart provides mixed readings.
Firstly, the price action shows both bullish and bearish signs. While ADA broke out from a short-term descending resistance line, it still trades below the minor $0.25 horizontal area. It has to reclaim it to consider a bullish trend.
Trade With AI – 9 Best AI Crypto Trading Bots to Maximize Your Profits
The RSI also gives mixed signs. The indicator is increasing and has generated a bullish divergence. However, it has not moved above 50 yet, which is required to confirm the trend as bullish.
Therefore, the future ADA price prediction will determine whether the price breaks out from the channel and the $).26 area or gets rejected. A 30% increase could occur in case of a breakout, while a 20% drop is likely if the price gets rejected.
For BeInCrypto’s latest crypto market analysis, click here.


