


The Polygon (MATIC) price fell to a new yearly low on September 11. The decrease caused a breakdown from the $0.60 horizontal resistance area.
The price action and wave count suggest that another low is expected before a reversal. However, the RSI is already showing some bullish signs.
Polygon Price Falls to New Yearly Low
The daily timeframe technical analysis for MATIC shows a bearish trend. The price has fallen under a descending resistance line since the yearly high of $1.57 on February 28. The decrease caused a breakdown from the $0.60 horizontal support area, validating it as resistance on August 29 (red icon).
The validation coincided with the most recent touch of the descending resistance line. After the rejection, MATIC fell to a new yearly low of $0.51 on September 10.
Since the line has been in place, the MATIC price has decreased by 67% in 208 days. If the decrease continues, the next closest support area will be at $0.34, a decrease of 33% measuring from the current price.
On the other hand, the closest resistance is at $0.84, an increase of 63% measuring from the current price.
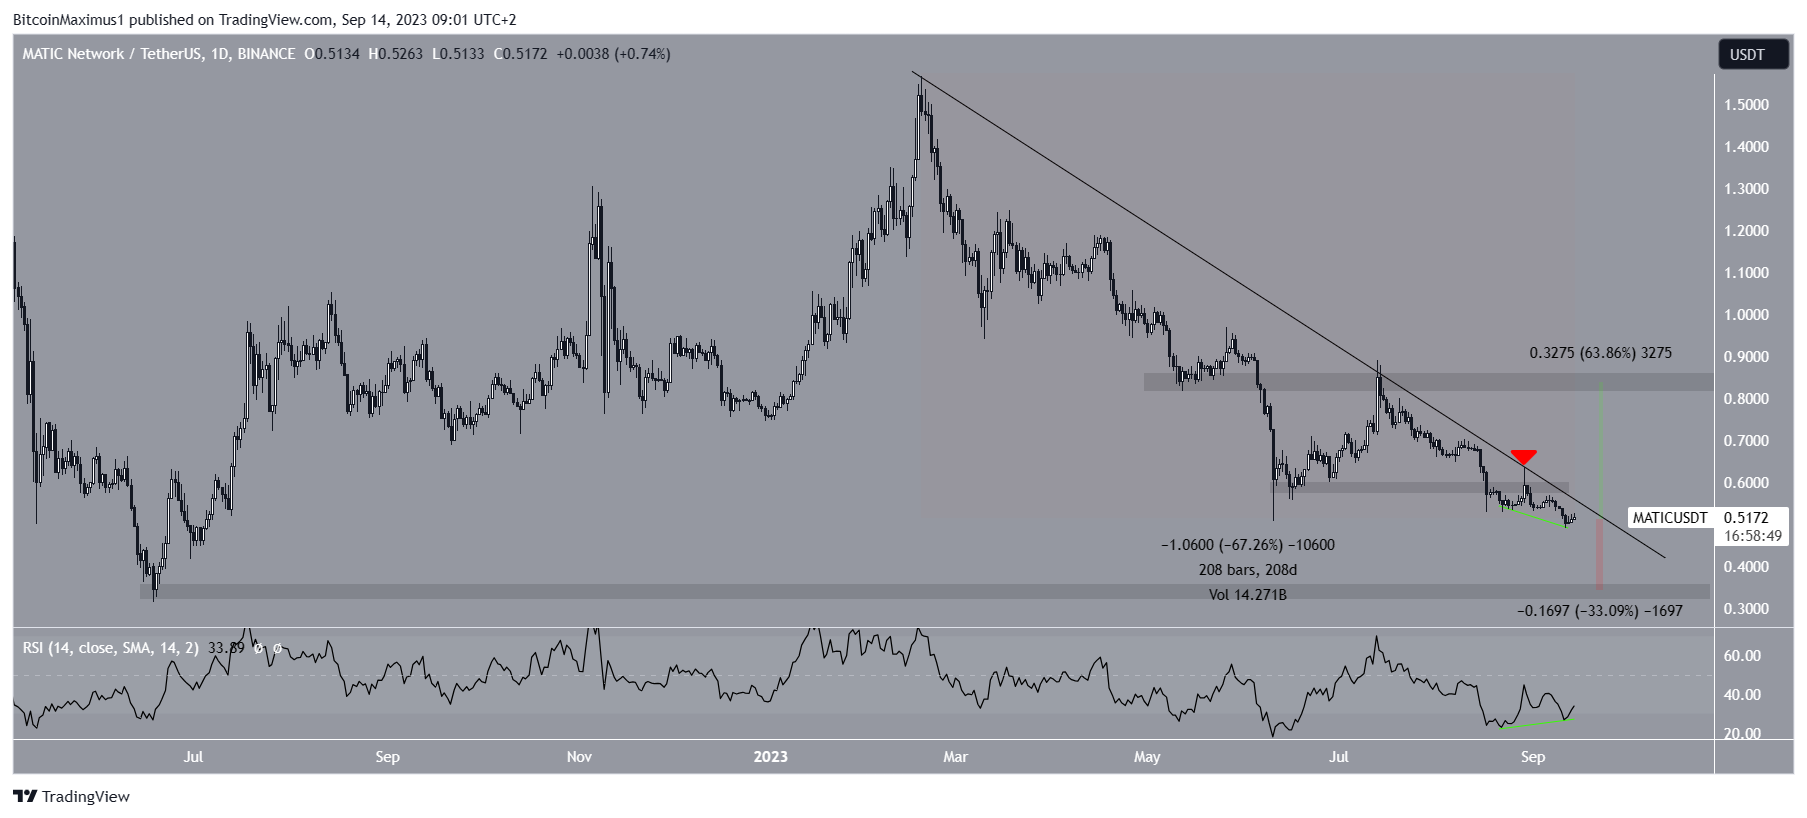
While the price action is decisively bearish, the daily Relative Strength Index (RSI) offers hope for a bullish reversal. Market traders use the RSI as a momentum indicator to identify overbought or oversold conditions and to decide whether to accumulate or sell an asset.
Readings above 50 and an upward trend indicate that bulls still have an advantage. On the other hand, readings below 50 suggest the opposite.
While the RSI is below 50, it has increased and created a higher low. Moreover, it has generated a bullish divergence (green line). This is a type of bullish development in which a momentum increase accompanies a price decrease. It often leads to bullish trend reversals.
The Polygon network news is positive since the Southeast Asian application Grab has incorporated a crypto wallet based on the Polygon blockchain.
Read More: Best Crypto Sign-Up Bonuses in 2023
MATIC Price Prediction: Elliott Wave Count Predicts Bottom
A closer look at the Elliott Wave count in the daily timeframe analysis indicates a bearish outlook for MATIC, but it also suggests that a bottom may be reached soon.
Technical analysts use the Elliott Wave theory to determine the direction of trends by examining recurring long-term price patterns and investor psychology.
The most probable scenario indicates that MATIC is currently in the fifth and final phase of its downtrend that began in February. The shape of the fourth wave strongly supports this interpretation.
Wave four was confined within an ascending parallel channel, a common feature in corrective movements. Furthermore, the peak of wave four briefly exceeded the $0.80 horizontal level (red circle), which subsequently turned into a resistance level.
If the downtrend continues, MATIC’s price is expected to complete its fifth and final wave around $0.41, corresponding to wave four’s 1.27 external Fibonacci retracement level. This target is above the main horizontal support area at $0.34.
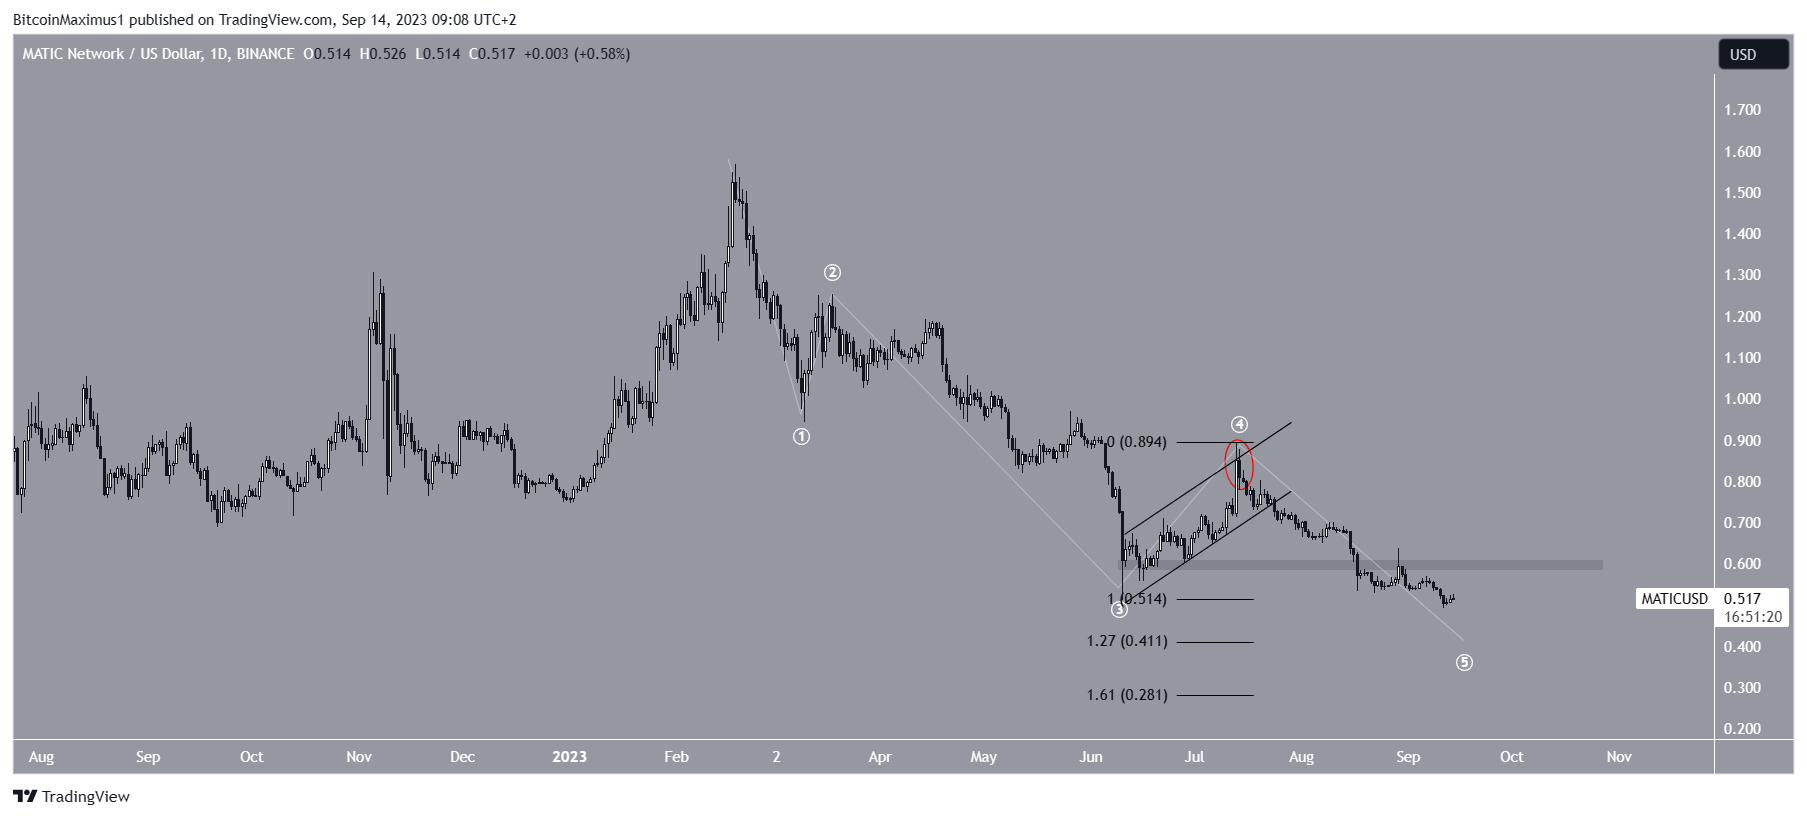
Therefore, the most likely price prediction for MATIC’s price is a decline to $0.40, followed by a significant rebound.
However, if MATIC manages to reclaim the $0.60 level, it would indicate that the bottom has been reached, potentially leading to a 63% price increase towards the next resistance at $0.84.
Interested in AI Trading? 9 Best AI Crypto Trading Bots to Maximize Your Profits


