Last week, Cardano (ADA) experienced a bullish bounce, successfully meeting its Fibonacci (Fib) price target. However, there is now a possibility that Cardano might undergo a correction phase.
Reflecting on the previous week’s analysis, it was noted that if Cardano were to break through the resistance area between the $0.4 and $0.43 levels, it could then aim for the .382 Fib resistance level, which is situated around $0.61. Given the recent bullish bounce, this scenario has been relevant, but the current market dynamics suggest that a corrective movement might follow.
Cardano Price Hits Fibonacci Resistance at Approximately $0.61
The price of Cardano has reached the 0.382 Fibonacci (Fib) resistance level, approximately at $0.61. At this level, the price may initially face bearish rejection.
Despite this potential short-term setback, the medium-term outlook for Cardano remains very bullish. Since October, ADA has seen a substantial increase, rising over 170%.
Supporting this bullish trend, the monthly chart’s Moving Average Convergence Divergence (MACD) histogram shows a bullish increase, and the MACD lines are also crossing in a bullish manner. The Relative Strength Index (RSI), meanwhile, is in neutral territory.
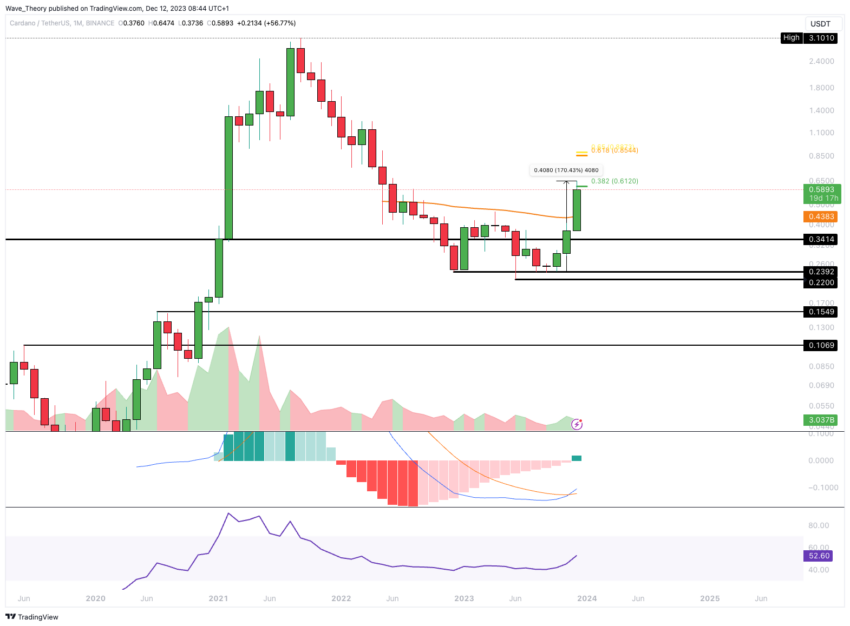
Furthermore, ADA has successfully breached the 50-month Exponential Moving Average (EMA) resistance at around $0.44, which now acts as a support level, adding to Cardano’s positive medium-term perspective.
Weekly Chart Analysis: Cardano’s MACD Indicates Strong Bullish Trend
In the weekly chart for ADA, the indicators present a mix of signals. On one side, there’s a ‘death cross’ in the Exponential Moving Averages (EMAs), indicating that a bullish trend confirmation is yet to be established.
Additionally, the Relative Strength Index (RSI) is in a heavily overbought region. This suggests that the market might be due for a correction. However, on the bullish side, the Moving Average Convergence Divergence (MACD) histogram is trending upwards, and the MACD lines have crossed bullishly.
Despite these bullish indicators, there is a noticeable bearish rejection at the .382 Fibonacci (Fib) resistance level around $0.61. Consequently, Cardano may undergo a correction to the next Fib support levels, which are around $0.484 and $0.38, respectively.
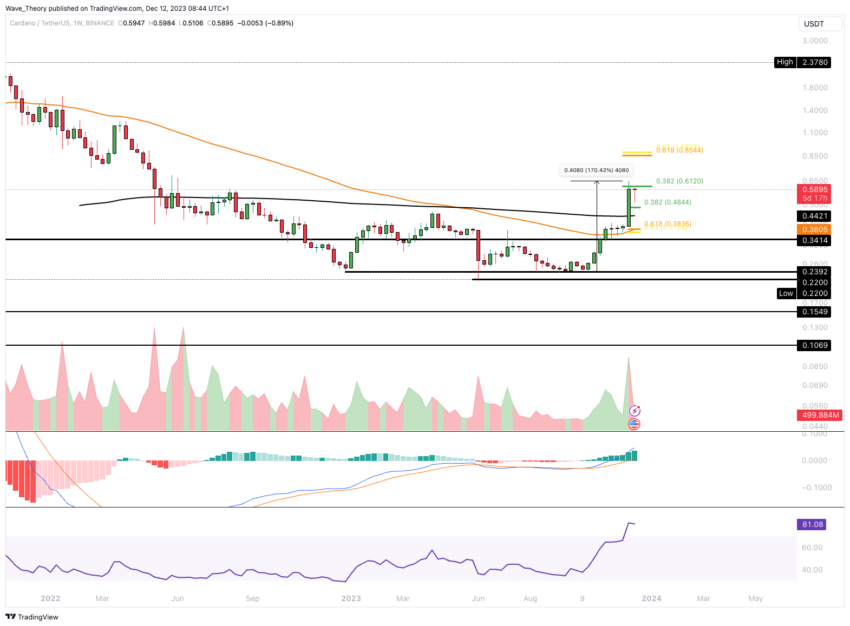
Additional support is provided at around $0.38 by the 50-week EMA, while the 200-week EMA offers support at approximately $0.44. These EMA levels could stabilize Cardano’s price if it undergoes a downward correction.
Daily Chart Outlook: ADA Maintains Bullish Trajectory in Short to Medium-Term
In the daily chart for ADA, the trend remains bullish in the short to medium term. This bullish outlook is supported by a golden crossover in the Exponential Moving Averages (EMAs), indicating positive momentum. Additionally, the Moving Average Convergence Divergence (MACD) lines are in a bullish crossover, and the MACD histogram is trending upwards, further reinforcing the bullish sentiment.
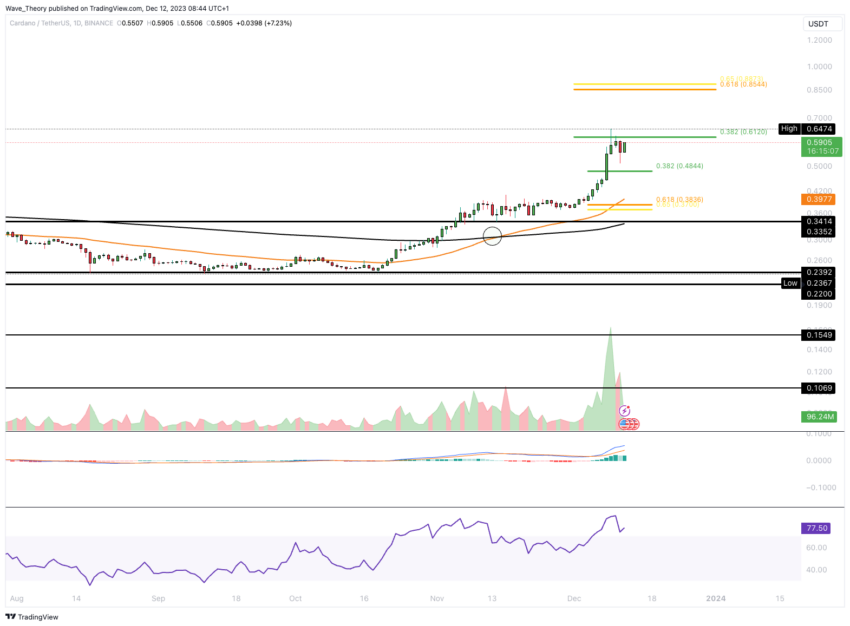
However, the Relative Strength Index (RSI) is currently in a heavily overbought region. Despite this overbought condition, there are no evident signs of a bearish divergence, which means the upward momentum might continue without immediate reversal signals. This combination of indicators suggests continued bullishness for Cardano, albeit with caution due to the overbought RSI, which often precedes a potential pullback or consolidation phase.
Cardano’s Next Target: Eyeing 0.382 Fib Resistance at $0.61 Again
If Cardano successfully breaches the .382 Fibonacci (Fib) resistance level at approximately $0.61, it has the potential to ascend towards the golden ratio level, around $0.86. This would mark a significant bullish progression.
Read More: Best Upcoming Airdrops in 2023
Furthermore, the 4-hour (4H) chart indicates a possible early conclusion to the corrective movement, as Cardano is already re-approaching the 0.382 Fib resistance near $0.61. Supporting this bullish outlook, the Moving Average Convergence Divergence (MACD) histogram is trending upwards. While the Exponential Moving Averages (EMAs) continue to display a golden crossover.
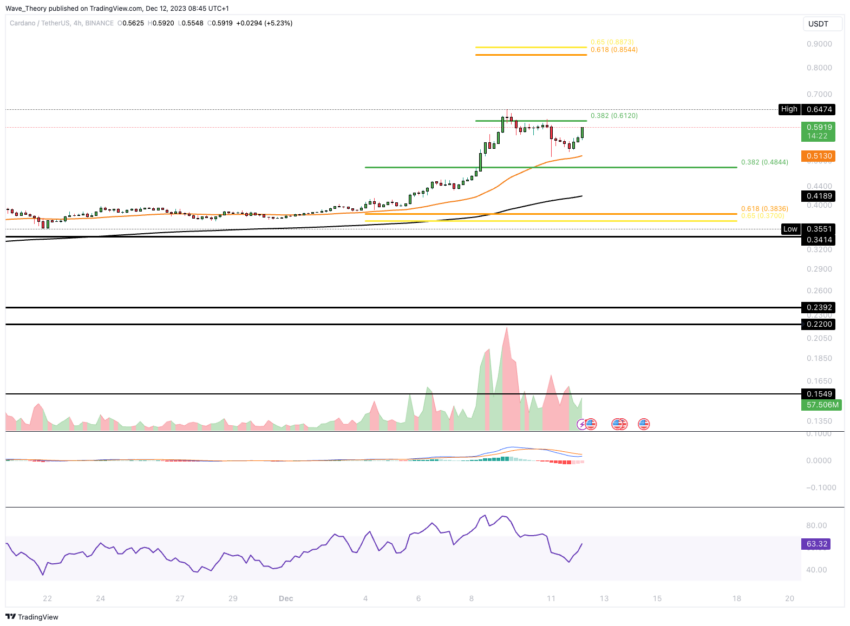
These indicators collectively suggest a resurgence in bullish momentum for Cardano in the short term.
Cardano’s Price Experiences Bullish Breakout Against Bitcoin Last Week
Last week, Cardano experienced a significant price surge against Bitcoin (BTC), successfully breaking through several key resistance levels. These included the Fibonacci (Fib) resistance levels at around 0.0000103 BTC and 0.000012 BTC, as well as surpassing the 50-week Exponential Moving Average (EMA) at approximately 0.0000126 BTC.
Looking forward, the next major Fib resistance levels for ADA are set at around 0.000015 BTC and approximately 0.00001985 BTC. This upward momentum is further supported by the Moving Average Convergence Divergence (MACD) histogram. Which has been trending upward since last week, and the MACD lines have also crossed bullishly.
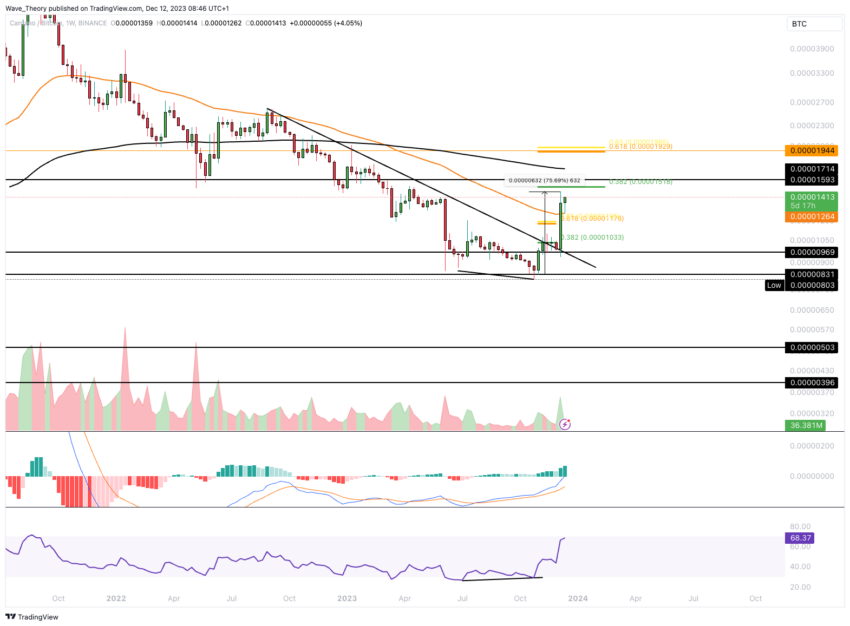
Overall, Cardano’s price has seen an impressive rise of over 75% in the past few weeks. The recent developments indicate that Cardano is currently performing very well, especially in its pairing against Bitcoin.
Read More: Best Crypto Sign-Up Bonuses in 2023
Disclaimer
In line with the Trust Project guidelines, this price analysis article is for informational purposes only and should not be considered financial or investment advice. BeInCrypto is committed to accurate, unbiased reporting, but market conditions are subject to change without notice. Always conduct your own research and consult with a professional before making any financial decisions. Please note that our Terms and Conditions, Privacy Policy, and Disclaimers have been updated.

