The Klaytn (KLAY) price has fallen under a descending resistance line since its yearly high on February 22.
There are no bullish reversal signs in the weekly or daily timeframe, suggesting that the downward movement is likely to continue.
Klaytn Price Falls to Three-Year Low
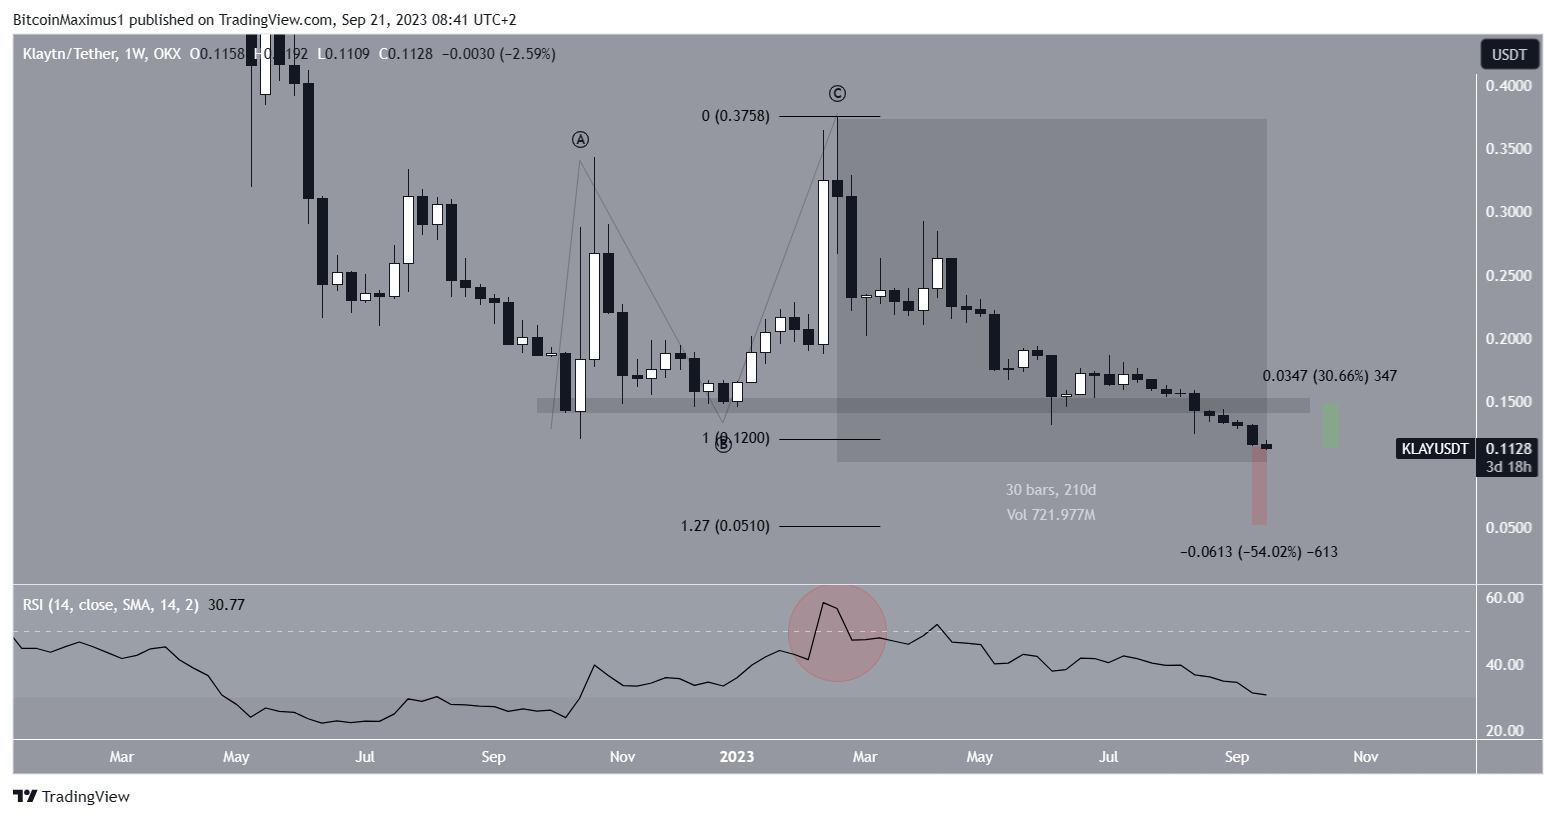
The KLAY price had traded above the $0.145 horizontal support area since September 2022. During this time, it bounced inside the area numerous times.
However, KLAY broke down from the support in August 2023 and has fallen since. On September 20, the price reached a low of $0.111. This is the lowest price since the end of May 2020, but still higher than the all-time low of $0.057.
Read More: 9 Best AI Crypto Trading Bots to Maximize Your Profits
Invest smarter with our KLAY price predictors.
The movement before the breakdown suggests that the trend is bearish. The reason for this is the completion of an A-B-C wave structure that faces upwards. Technical analysts utilize the Elliott Wave theory to ascertain the trend’s direction by studying recurring long-term price patterns and investor psychology. The fact that the corrective structure is facing upwards suggests that the presiding trend (highlighted) is bearish.
The weekly Relative Strength Index (RSI) supports the continuing downward trend. Market traders use the RSI as a momentum indicator to identify overbought or oversold conditions and to decide whether to accumulate or sell an asset.
Readings above 50 and an upward trend indicate that bulls still have an advantage, whereas readings below 50 suggest the opposite. The RSI was rejected by the 50 line (red circle) and is falling, both signs of a bearish trend.

If the decrease continues, the next closest support will be at $0.051, which is 55% below the current price. The 1.27 external Fib retracement finds the support and would constitute a new all-time low price.
On the other hand, a sudden increase in momentum can lead to a 30% surge that takes the price back to the $0.145 area. The area is now likely to provide resistance.
KLAY Price Prediction: Are There Any Short-Term Reversal Signs in Place?
Similarly to the weekly timeframe, the daily chart is also bearish. However, the wave count offers hope that the price will bottom before reaching the $0.051 support.
The daily timeframe count shows that the KLAY price is in the fifth and final wave of a downward movement (white). After the wave is complete, a significant increase is expected.
Projecting the 0.618 length of wave one to the top of wave four gives a target of $0.074, which is 35% below the current price. If KLAY does not bounce there, it will likely fall to the previously outlined $0.051 support area.
However, it is worth mentioning that KLAY still follows its descending resistance line that has been in place since the yearly high. Until it breaks out above it, the cryptocurrency is considered to be in a bearish trend.
Therefore, the KLAY price prediction is considered bearish, and a drop of 35%-55% is likely. A breakout from the descending resistance line will mean that the correction is complete, and an upward movement will follow.
For BeInCrypto’s latest crypto market analysis, click here.
Disclaimer
In line with the Trust Project guidelines, this price analysis article is for informational purposes only and should not be considered financial or investment advice. BeInCrypto is committed to accurate, unbiased reporting, but market conditions are subject to change without notice. Always conduct your own research and consult with a professional before making any financial decisions. Please note that our Terms and Conditions, Privacy Policy, and Disclaimers have been updated.


