August was a bearish month for the cryptocurrency market. The majority of altcoins continued the descent that began in the middle of July.
However, altcoins generally outperformed Bitcoin (BTC), as evidenced by the decrease in the Bitcoin Dominance Rate (BTCD) in the monthly candlestick for August. With that in mind, BeInCrypto looks at the crypto predictions for the month of September.
Chainlink (LINK) Will Finally Clear Long-Term Resistance
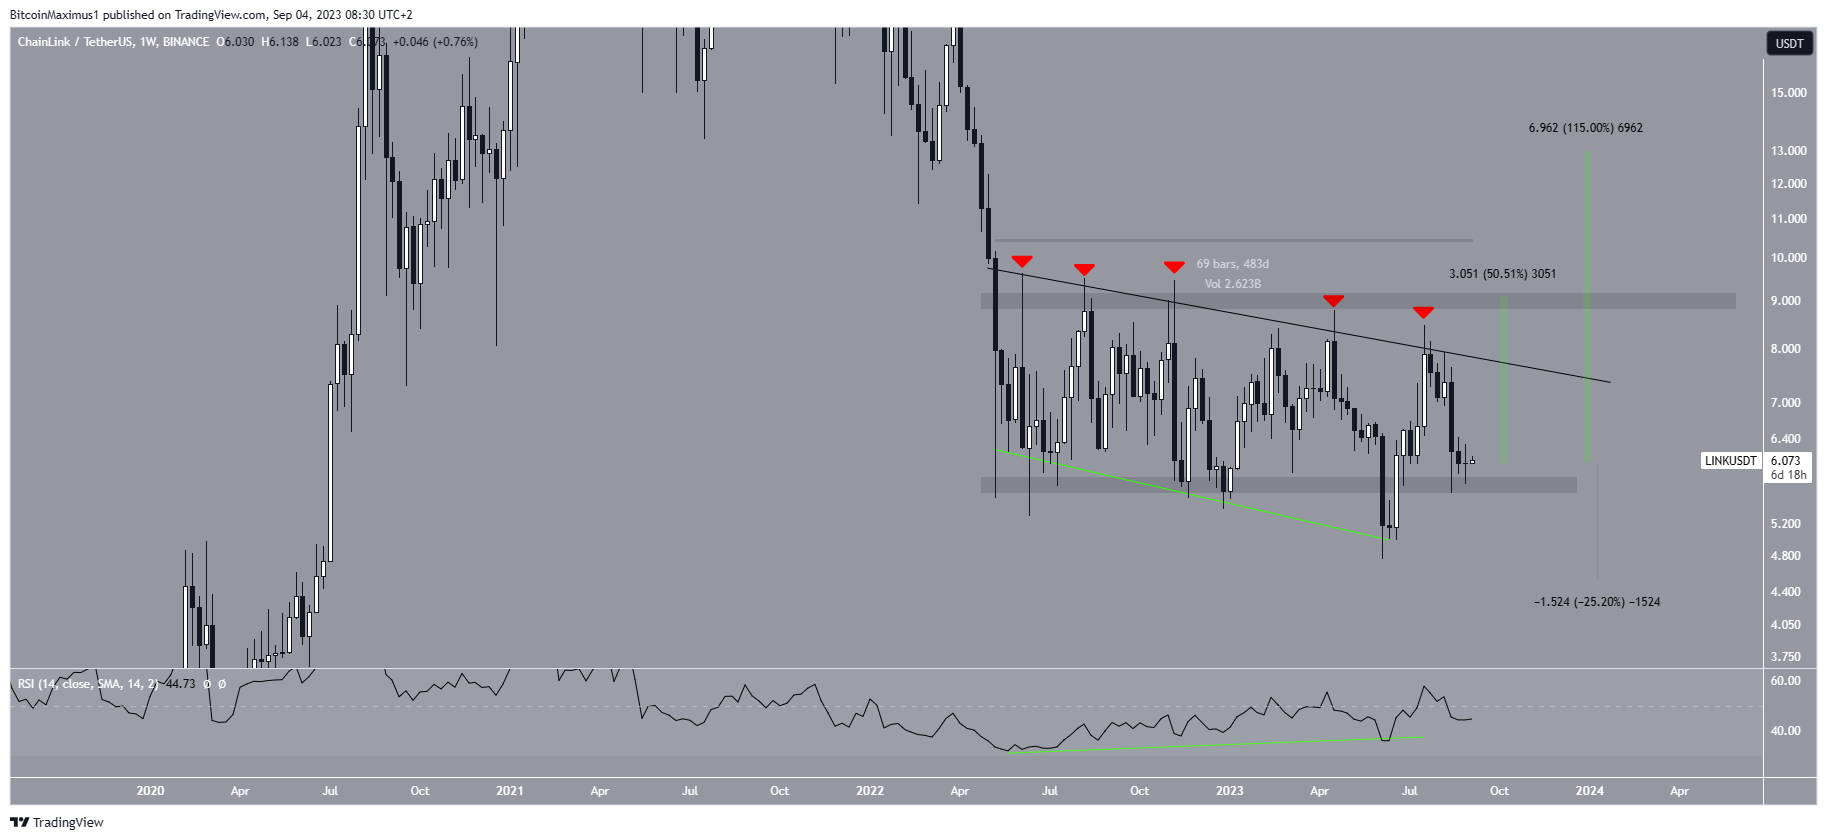
The Chainlink price has been stuck in a consolidation pattern since April 2022. The price has traded below a descending resistance line but above the $5.70 horizontal support area during this time.
This all seemingly ended in June, when the price broke down from the $5.70 area. However, LINK reclaimed the area shortly afterward, suggesting that the drop was only a deviation. This is a bullish sign that is often followed by an upward movement.
Read More: Best Upcoming Airdrops in 2023
The deviation was also combined with a strong bullish divergence in the weekly Relative Strength Index (RSI). The RSI is a momentum indicator used to identify overbought or oversold conditions and to decide whether to accumulate or sell an asset. Readings above 50 and an upward trend indicate that bulls still have an advantage, whereas readings below 50 suggest the opposite.
A bullish divergence occurs when a momentum increase accompanies a price decrease. It is a bullish sign that often precedes upward movements, as was the case for LINK. Therefore, the divergence legitimizes the deviation and reclaim, suggesting that an upward movement will follow.
Next, the LINK price reached the resistance line for the fifth time (red icons) but was rejected. So far, the line has been in place for 483 days. Since lines get weaker each time they are touched, an eventual breakout from it is the most likely scenario.

In that case, LINK could increase to at least the next resistance at $9 and possibly even go to $13. This would amount to an increase of 50% and 115%, respectively. However, a breakdown from the $5.70 area could trigger a 25% drop to the next closest support at $4.50.
Get Chainlink (LINK) Price Prediction insight here
Ocean Protocol (OCEAN) Price Could Double
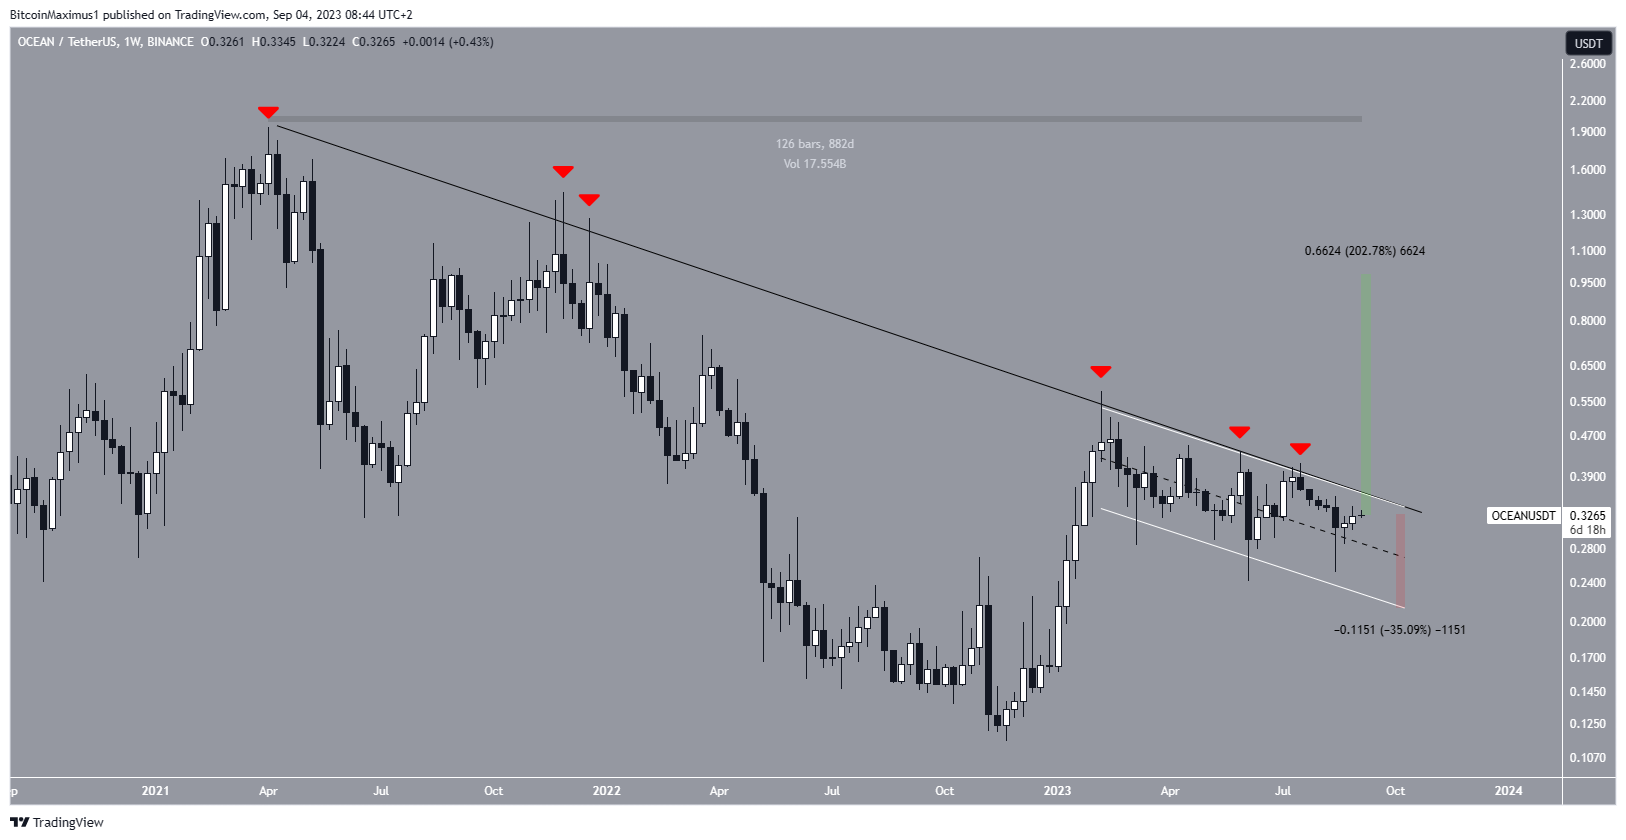
The OCEAN price, which peaked at $1.94 in April 2021, has decreased below a descending resistance line since then. This downward trend has persisted for 882 days, with the price making six unsuccessful attempts to surpass this trend line (red icons).
Since trend lines tend to weaken with each touch, there’s a higher likelihood of OCEAN eventually breaking from this trend line and increasing significantly.
Since early February, the price has been moving within a descending parallel channel (white). This pattern is typically associated with corrective movements.
So, the most likely future price scenario is a breakout from this channel. This expectation aligns with the repeated breakout attempts weakening the long-term resistance.

So, if the OCEAN price breaks out from the channel and the resistance line, it can increase by at least 200%, reaching the $1 horizontal resistance area in the process. However, another rejection from the line could cause a 35% drop in the channel’s support line at $0.21.
DASH Will Fall by 60%
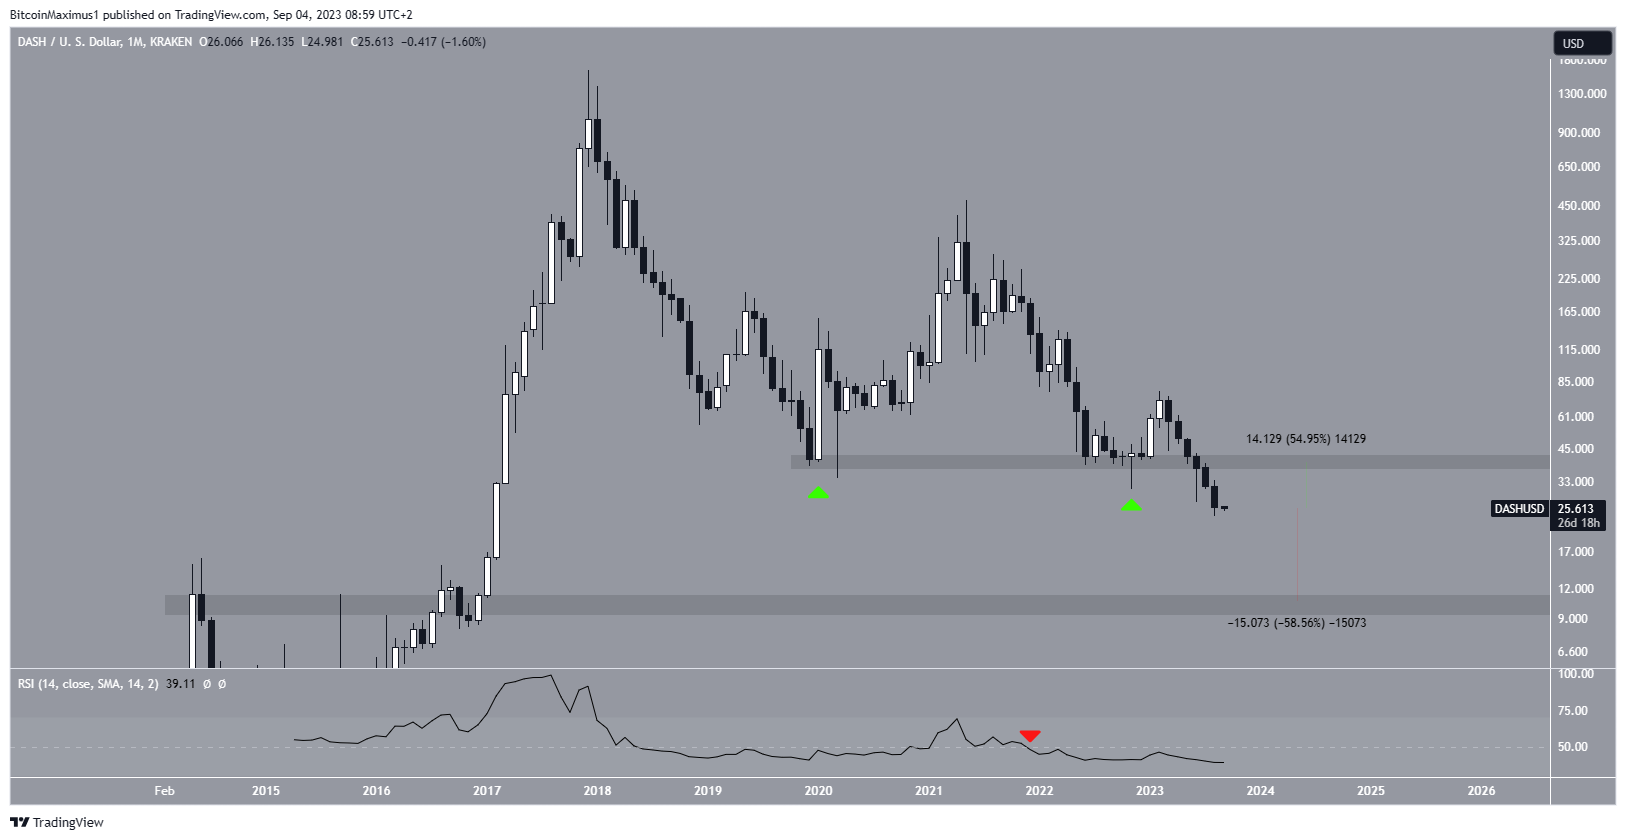
The DASH price has experienced a decline from its record high of $1,625 in December 2017. After two years, it found support around the $40 level (green icon), resulting in a significantly lower wick and the start of an upward movement.
However, in May 2021, the DASH price once again turned bearish. By July 2023, it finally broke below the $40 support level, reaching a low point of $23.86 on August 17. This marked the lowest price since February 2017.
The weekly Relative Strength Index (RSI) confirms the ongoing downtrend. Traders commonly use the RSI as a momentum indicator to assess whether a market is overbought or oversold and make decisions regarding asset accumulation or selling.
When the RSI reading surpasses 50 with an upward trend, it suggests that the bulls still hold an advantage. Conversely, when the reading falls below 50, it indicates the opposite. Currently, the RSI is below 50 (red icon) and decreasing, both of which are signs of a bearish trend.

Should the decline persist, the nearest support area to watch for is at $10, representing a nearly 60% drop from the current price. Conversely, a return to the $40 resistance level would translate to a 55% increase.
Read More: Top 11 Crypto Communities To Join in 2023
For BeInCrypto’s latest crypto market analysis, click here.
Disclaimer
In line with the Trust Project guidelines, this price analysis article is for informational purposes only and should not be considered financial or investment advice. BeInCrypto is committed to accurate, unbiased reporting, but market conditions are subject to change without notice. Always conduct your own research and consult with a professional before making any financial decisions. Please note that our Terms and Conditions, Privacy Policy, and Disclaimers have been updated.


