The BNB price has fallen since its rejection from the range high in April 2023. The price now trades inside the bottom of its range.
Whether the price bounces or breaks down could determine the future trend.
BNB Price Trades at Range Low
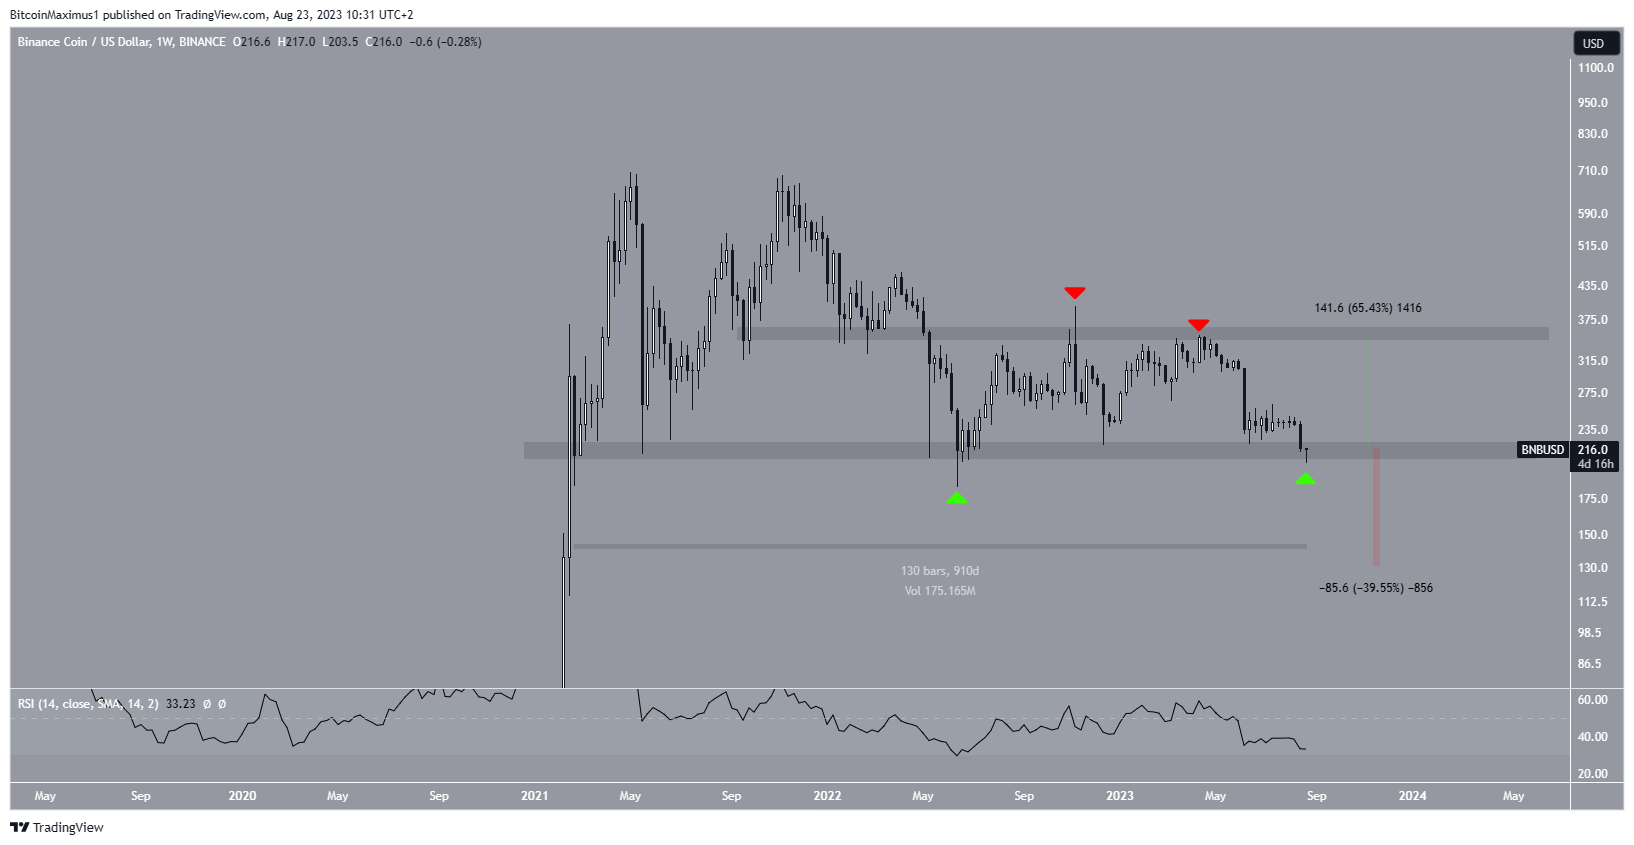
The weekly timeframe technical analysis shows that BNB has traded between $215 and $350 since May 2022. High and low ranges have been validated numerous times (red & green icons) throughout this period.
More recently, BNB fell to the range low last week, reaching a low of $203.5 and then bouncing. So far, the area has been in place for 910 days.
Since the area has been in place for a long time and due to the lack of support below it, a breakdown could trigger a 40% decrease to $130. On the other hand, a strong bounce can cause a 65% increase to the range high of $350.

The weekly RSI shows a bearish signal, implying the possibility of a decline and downward shift. Traders in the market utilize the RSI to gauge momentum, spot instances of excessive buying or selling, and determine whether to amass or liquidate an asset.
Readings surpassing 50 alongside an ascending pattern demonstrate the continued dominance of the bulls, whereas readings falling below 50 indicate the contrary. The present reading at 35, situated beneath the 50 threshold, signifies a bearish trend.
BNB news is mostly negative. Firstly, OpenSea stopped supporting NFT transactions on the BNB chain. Furthermore, there are reports that the Binance exchange artificially propped its value. Finally, there are fears of a cascading effect of liquidation in case the price falls decisively below $200.
BNB Price Prediction: Pattern Breakdown Triggers Decrease
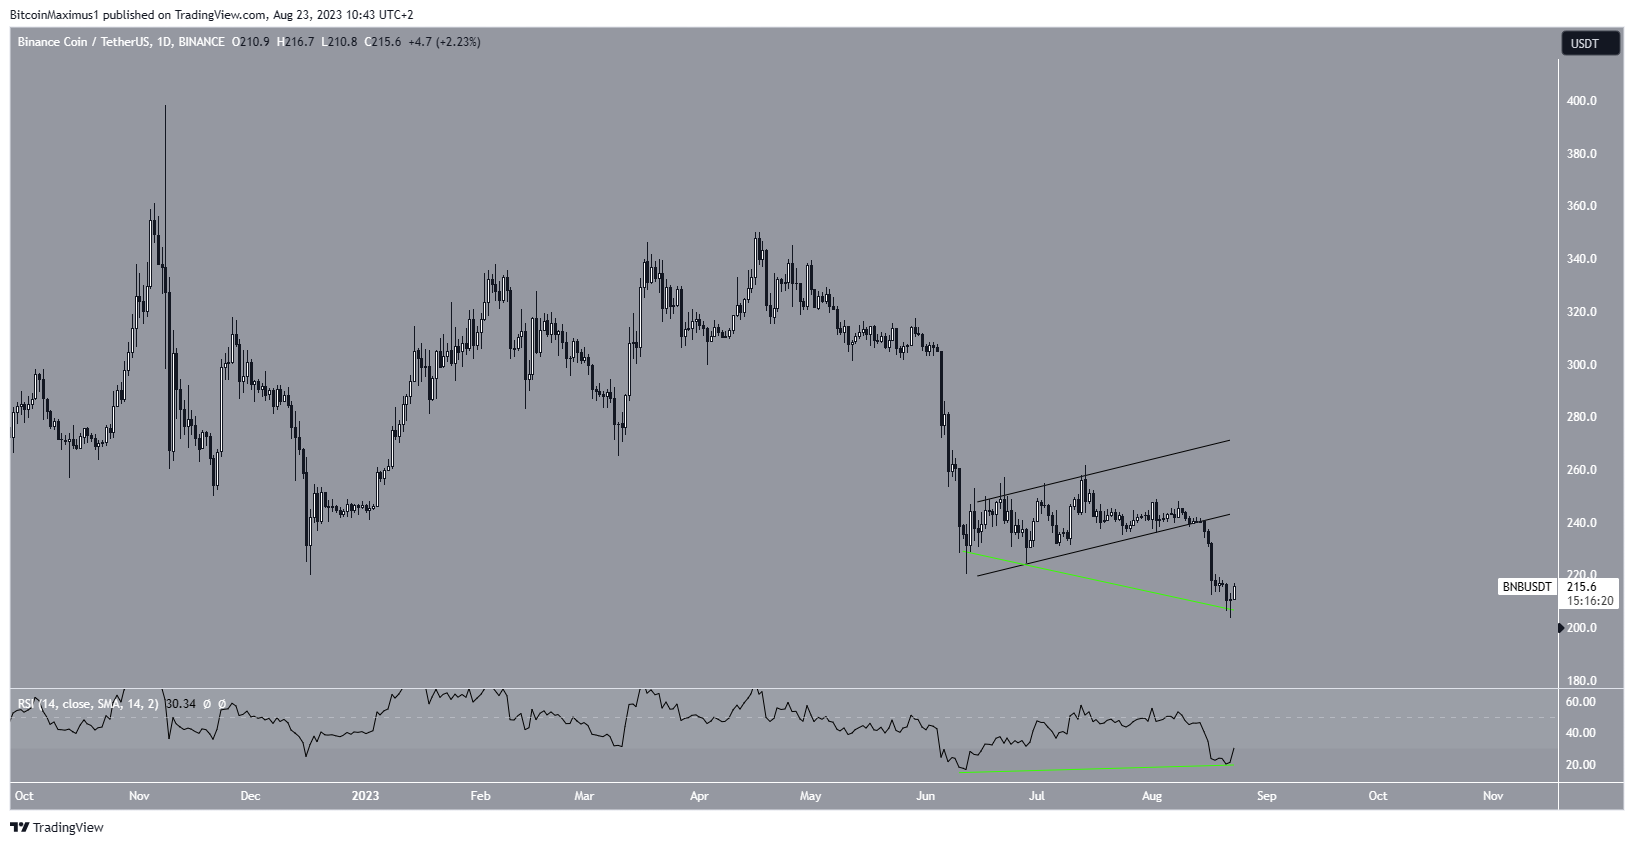
The technical analysis from the daily time frame shows that the decrease accelerated once the price broke down from an ascending parallel channel on August 15. Ascending parallel channels usually contain corrective patterns, meaning that a breakdown from it is expected.
While this is a bearish sign, the daily RSI shows bullish signs. Even though the indicator is below 50, it has generated a bullish divergence (green line) and is moving outside of its oversold territory.
A bullish divergence occurs when a momentum increase accompanies a price increase. It often precedes bullish trend reversals.

The BNB price prediction hinges on the price bouncing at the $215 horizontal support area or closing below it. A 40% drop could occur in case of a bearish breakdown, while a 65% increase could follow a bounce.
Read More: Best Upcoming Airdrops in 2023
For BeInCrypto’s latest crypto market analysis, click here
Disclaimer
In line with the Trust Project guidelines, this price analysis article is for informational purposes only and should not be considered financial or investment advice. BeInCrypto is committed to accurate, unbiased reporting, but market conditions are subject to change without notice. Always conduct your own research and consult with a professional before making any financial decisions. Please note that our Terms and Conditions, Privacy Policy, and Disclaimers have been updated.


