The Shiba Inu (SHIB) price has increased by 85% since its June lows. The price action suggests that the increase will continue.
A breakout from the current descending resistance line can be the catalyst for another 50% increase.
Shiba Inu (SHIB) Ascent Continues
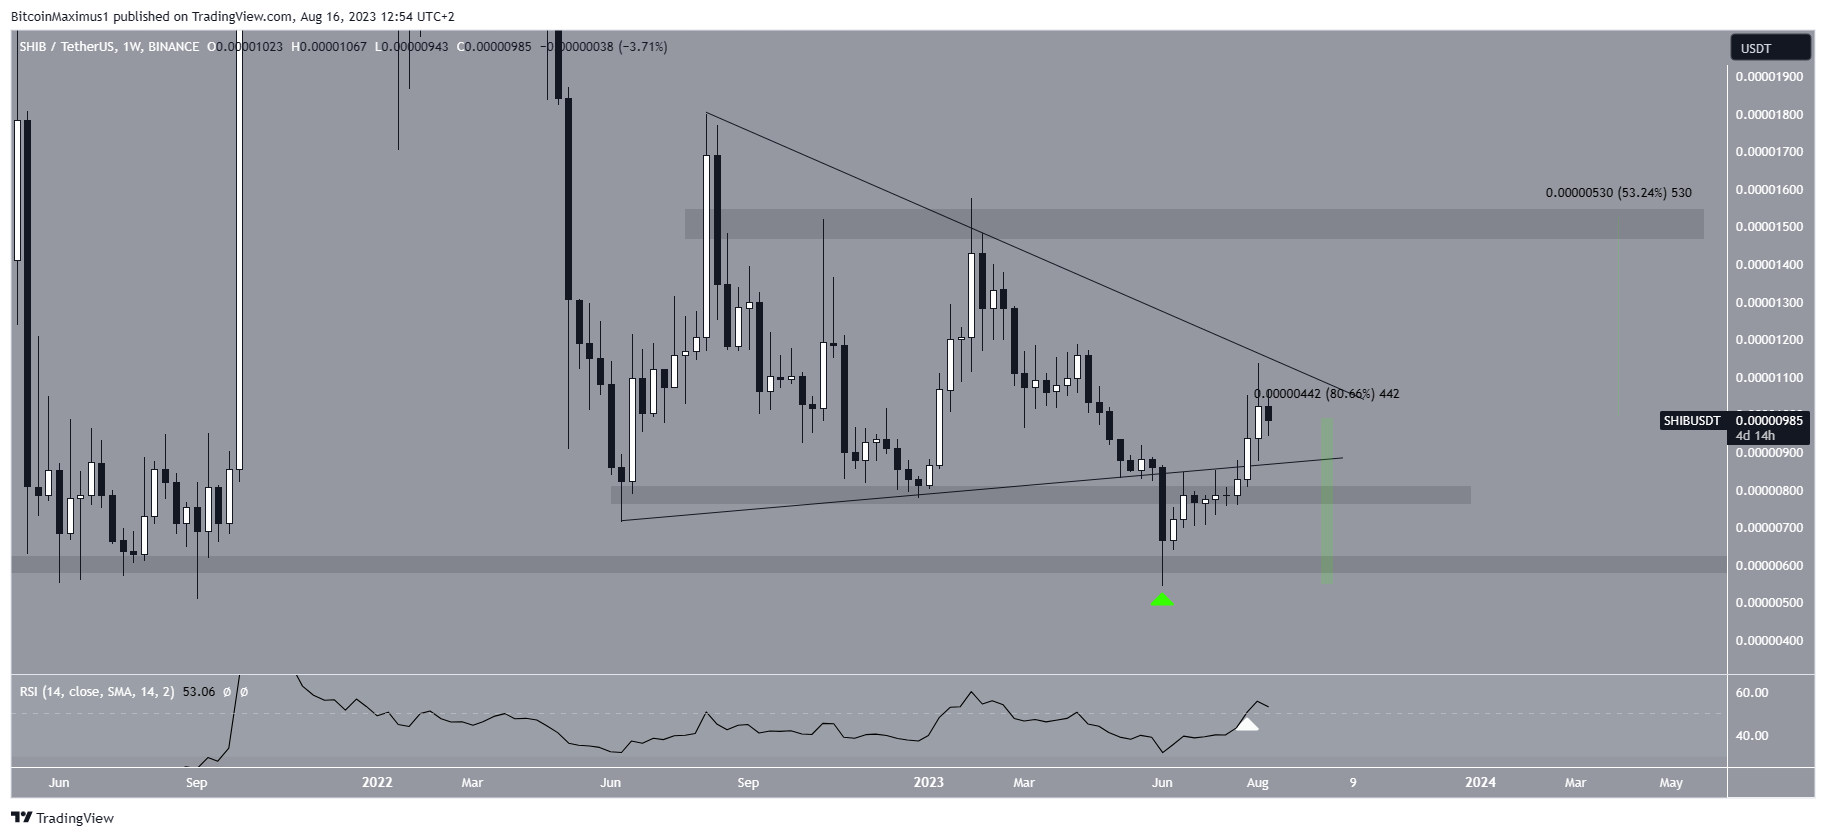
The SHIB price has increased swiftly since reaching a new yearly low of $0.0000054 on June 10. The upward movement has so far amounted to 80%, outperforming Bitcoin and the rest of the cryptocurrency market.
The increase is especially crucial since it caused the price to reclaim the ascending support line of a previous symmetrical triangle and the $0.0000080 support area. The reclaim indicates that the previous breakdown was only a deviation and not the beginning of a bearish trend reversal.
As expected, the SHIB price has increased considerably since the reclaim and is now trading in the middle of the triangle.
A breakout from the triangle could lead to a 50% increase that takes the price to the $0.0000150 resistance area. This level has not been reached since early January this year.
Check Out the Best Upcoming Airdrops in 2023

Furthermore, the weekly RSI supports the continuing increase. The RSI is a momentum indicator used by traders to evaluate whether a market is overbought or oversold and to determine whether to accumulate or sell an asset. Readings above 50 and an upward trend suggest that bulls still have an advantage, while readings below 50 indicate the opposite.
The indicator just moved above 50 (white icon) and is increasing, both signs of a bullish trend for the meme coin.
Furthermore, the news on the Shiba Inu ecosystem are positive. Shytoshi Kusama, the Shiba Inu community lead, hinted that the much-anticipated Shibarium launch could be today. Shibarium is a layer-2 solution for the SHIB ecosystem that aims to provide a more scalable and cost-effective transaction platform.
SHIB Price Prediction: Will Breakout Transpire?
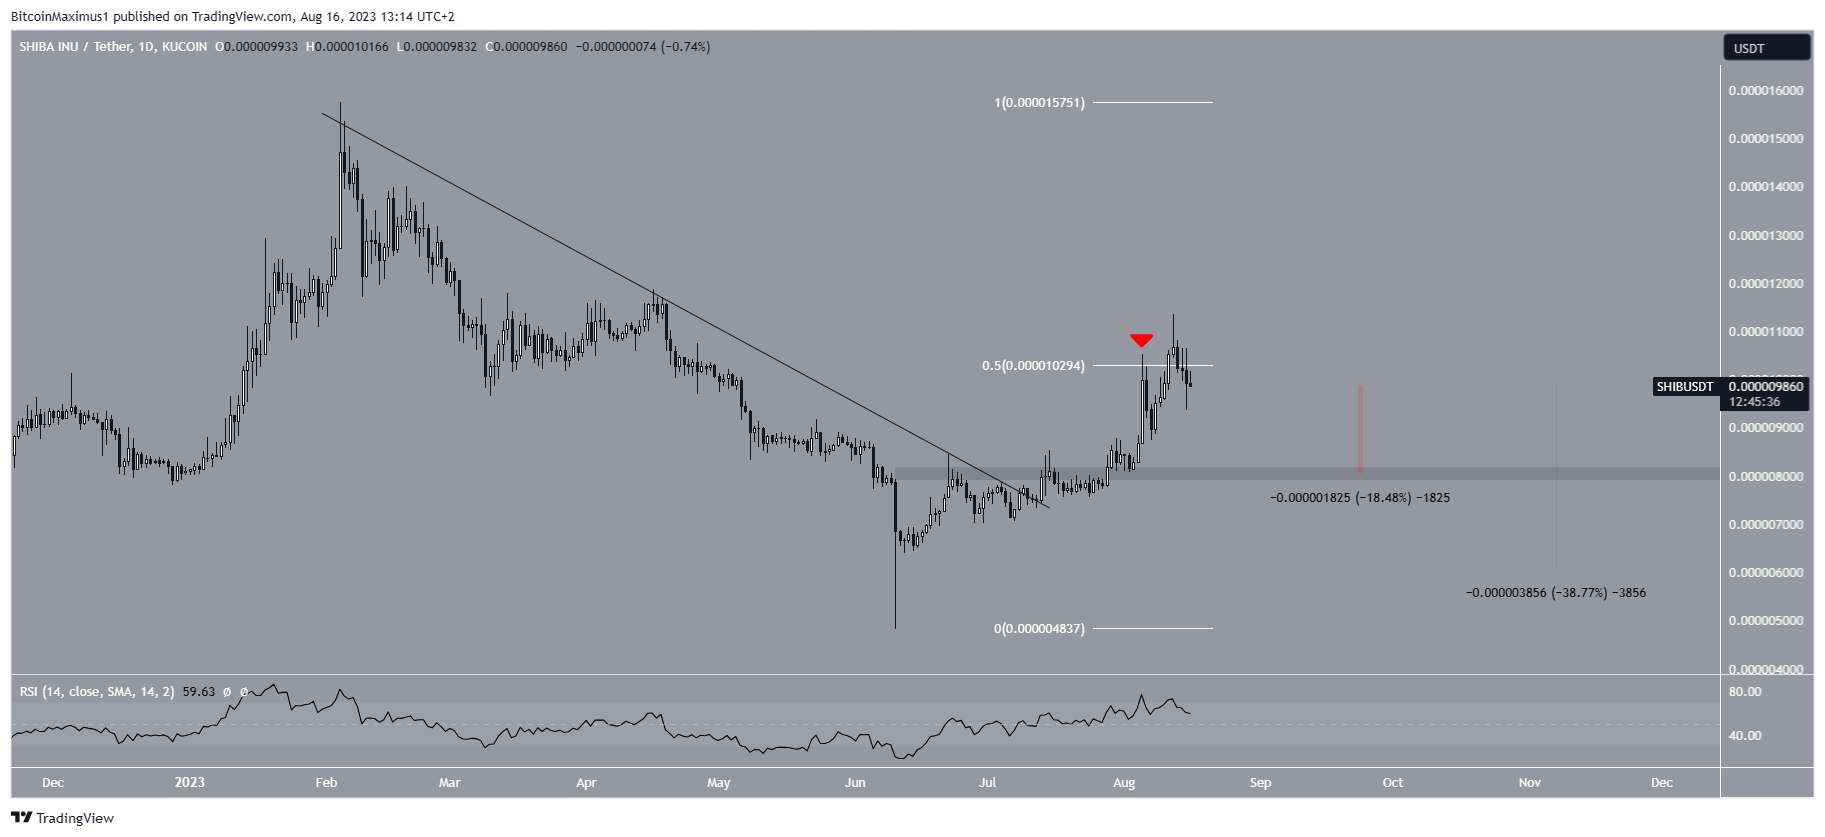
The daily timeframe readings align with those from the weekly one. This is especially evident in the breakout from a descending resistance line.
After the breakout, the SHIB price briefly moved above the 0.5 Fib retracement resistance level at $0.0000103. However, it has fallen below it since (red icon).
While this is considered a short-term bearish sign that could lead to an 18% drop to the $0.0000080 support area, the long-term trend remains bullish.
Moreover, the daily RSI is increasing and is above 50. These are both considered signs of a bullish trend and support the continuing increase.
Since the long-term triangle‘s resistance line is at $0.0000120, a breakout above it would confirm the bullish trend reversal and lead to a 50% increase to $0.0000150.

Despite this bullish SHIB price prediction, a close below the $0.0000080 horizontal support area could trigger a sharp fall to $0.0000060. This would be a decrease of nearly 40%.
Check Out the 9 Best AI Crypto Trading Bots to Maximize Your Profits
For BeInCrypto’s latest crypto market analysis, click here.
Disclaimer
In line with the Trust Project guidelines, this price analysis article is for informational purposes only and should not be considered financial or investment advice. BeInCrypto is committed to accurate, unbiased reporting, but market conditions are subject to change without notice. Always conduct your own research and consult with a professional before making any financial decisions. Please note that our Terms and Conditions, Privacy Policy, and Disclaimers have been updated.


