Ripple’s XRP price managed to surpass a significant long-term resistance level briefly. However, it fell short of closing above it, resulting in an extended upper wick and subsequent drop.
Due to this rejection and subsequent decline, XRP’s price has probably initiated a new downward movement. This hypothesis is supported by both the Relative Strength Index (RSI) readings and the wave count analysis.
Read More: Best Crypto Sign-Up Bonuses in 2023
Ripple Price Falls After Rejection at Long-Term Resistance
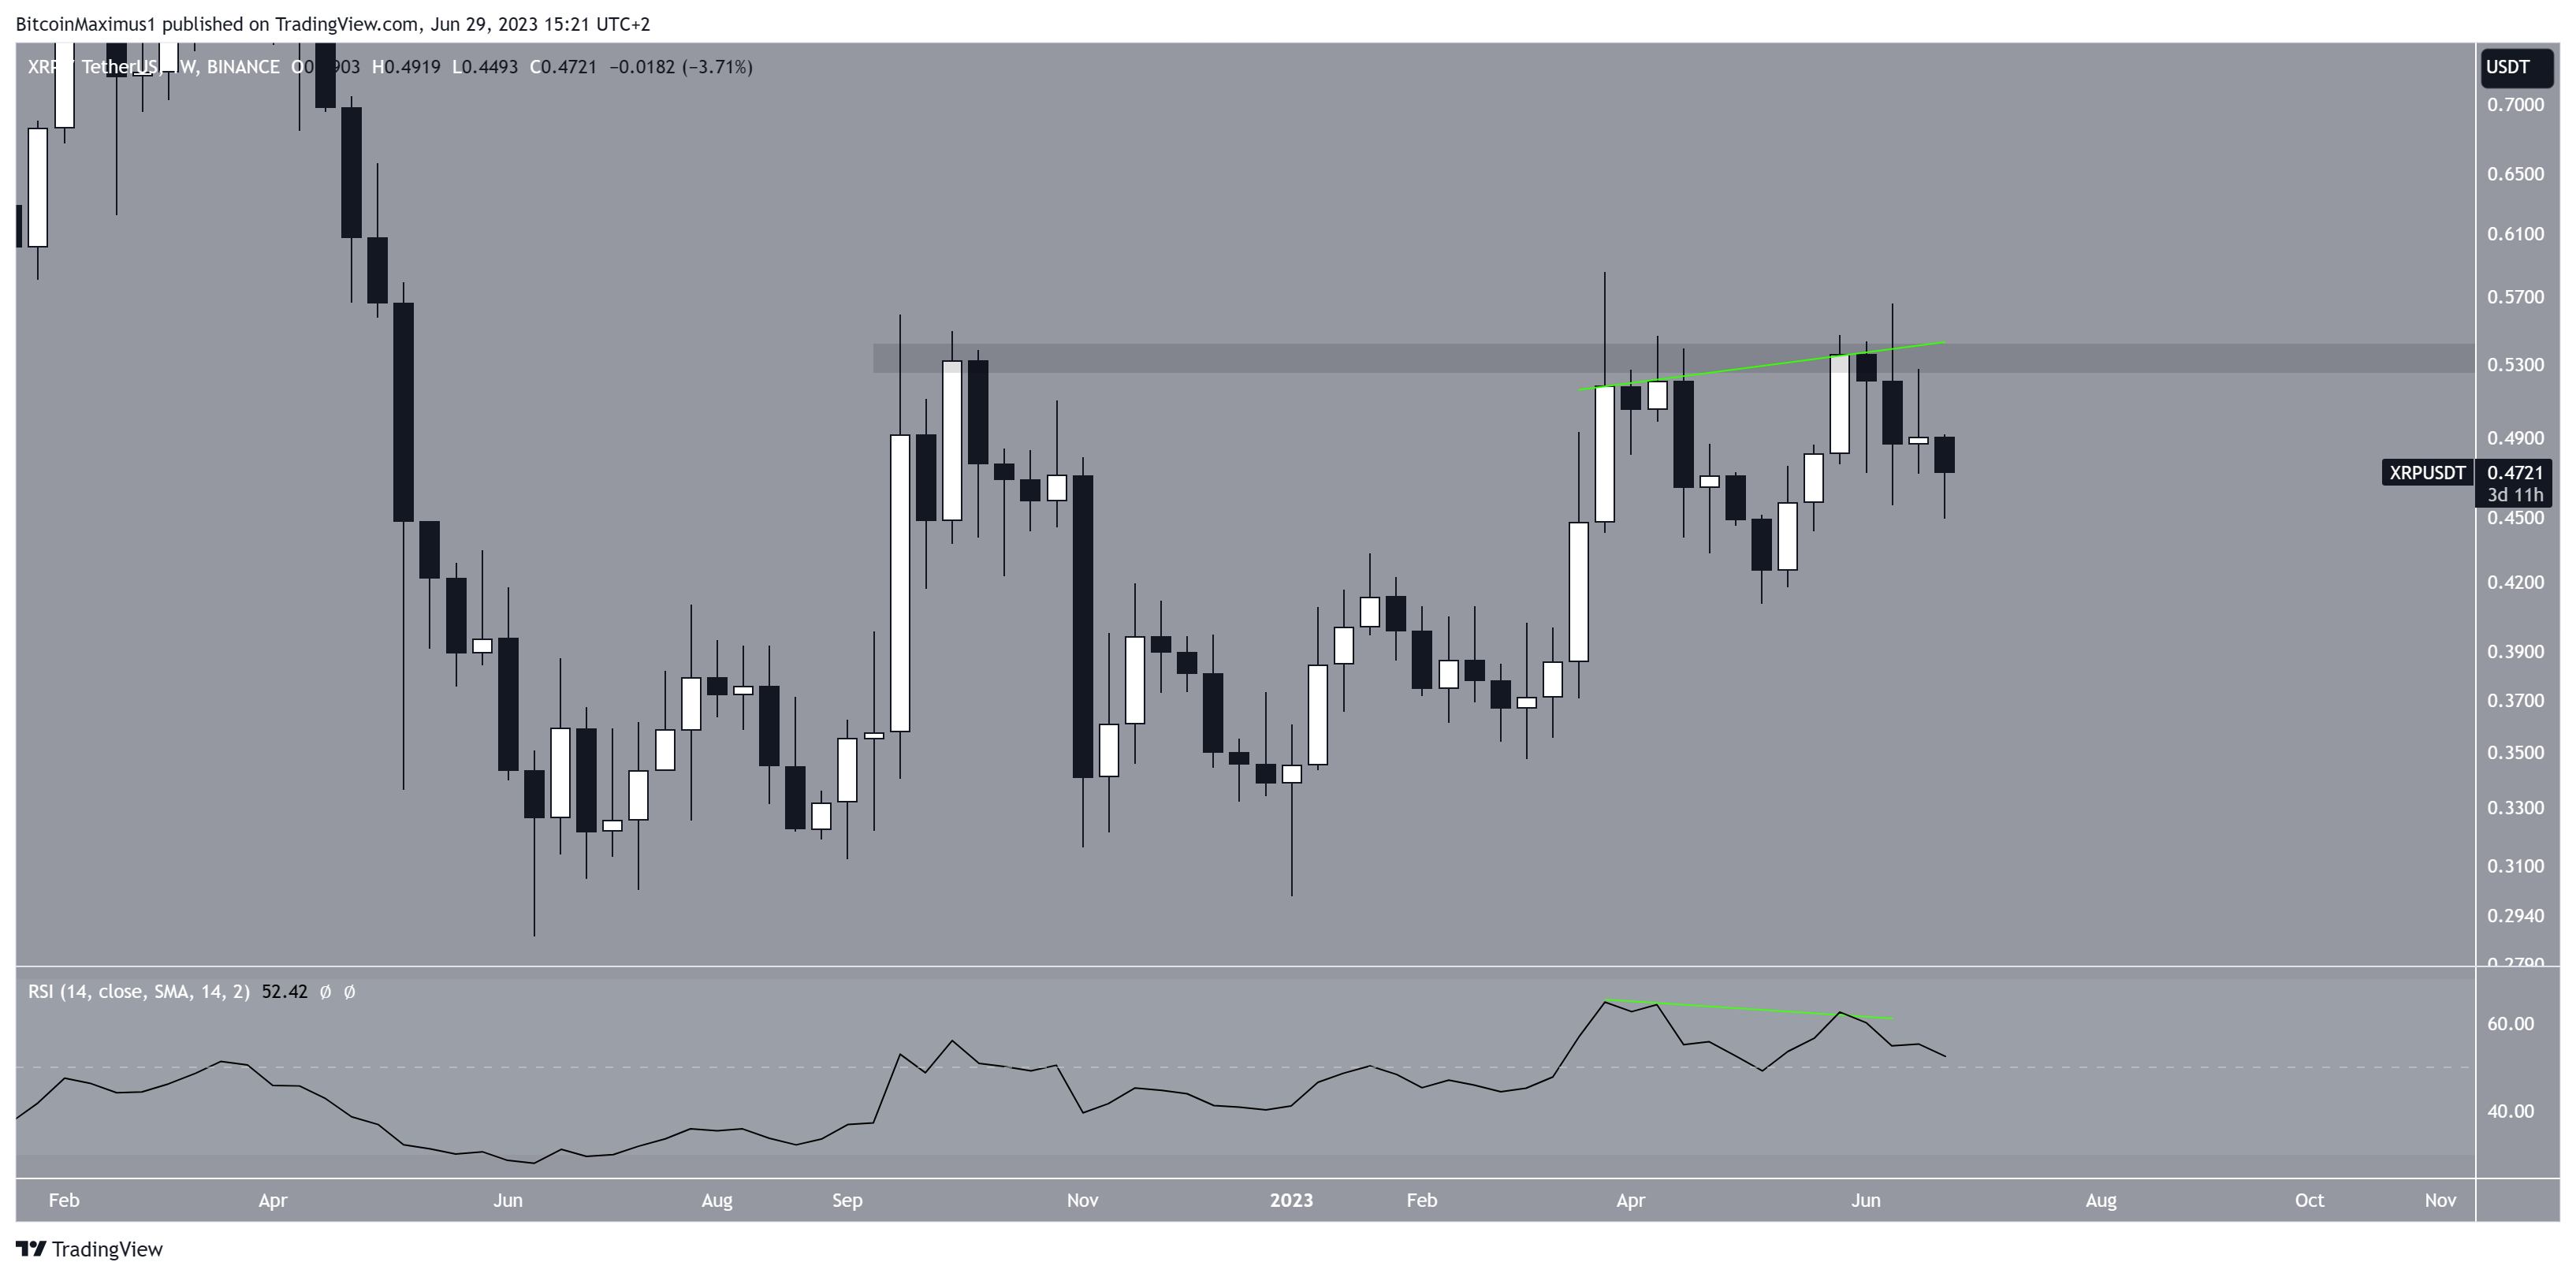
Since September 2022, the price of XRP has made three unsuccessful attempts to surpass the long-term resistance level of $0.53. Due to it being in place for such a long time, this is a crucial resistance area.
So, a breakout above which could greatly accelerate the rate of increase.
During the past two weeks, two rejections resulted in candlesticks with a long upper wick (indicating selling pressure). Therefore, in June, the XRP price nullified almost all of the gains made in May.

The Relative Strength Index (RSI)) indicator further suggests a potential downward movement. Traders utilize the RSI as a momentum indicator to assess whether a market is overbought or oversold, aiding their decision to accumulate or sell an asset.
When the RSI reading is above 50, and the trend is upward, bulls have an advantage. However, if the reading falls below 50, the opposite holds true. Despite the RSI currently being above 50, it is declining, indicating weakness.
Additionally, a bearish divergence has appeared in the RSI, often foreshadowing downward movements.
The presence of this bearish divergence within a significant resistance area, combined with the bearish candlestick, reinforces the likelihood of an approaching bearish trend reversal.
More From BeInCrypto: 9 Best AI Crypto Trading Bots to Maximize Your Profits
XRP Price Prediction: Wave Count Gives Bearish Outlook
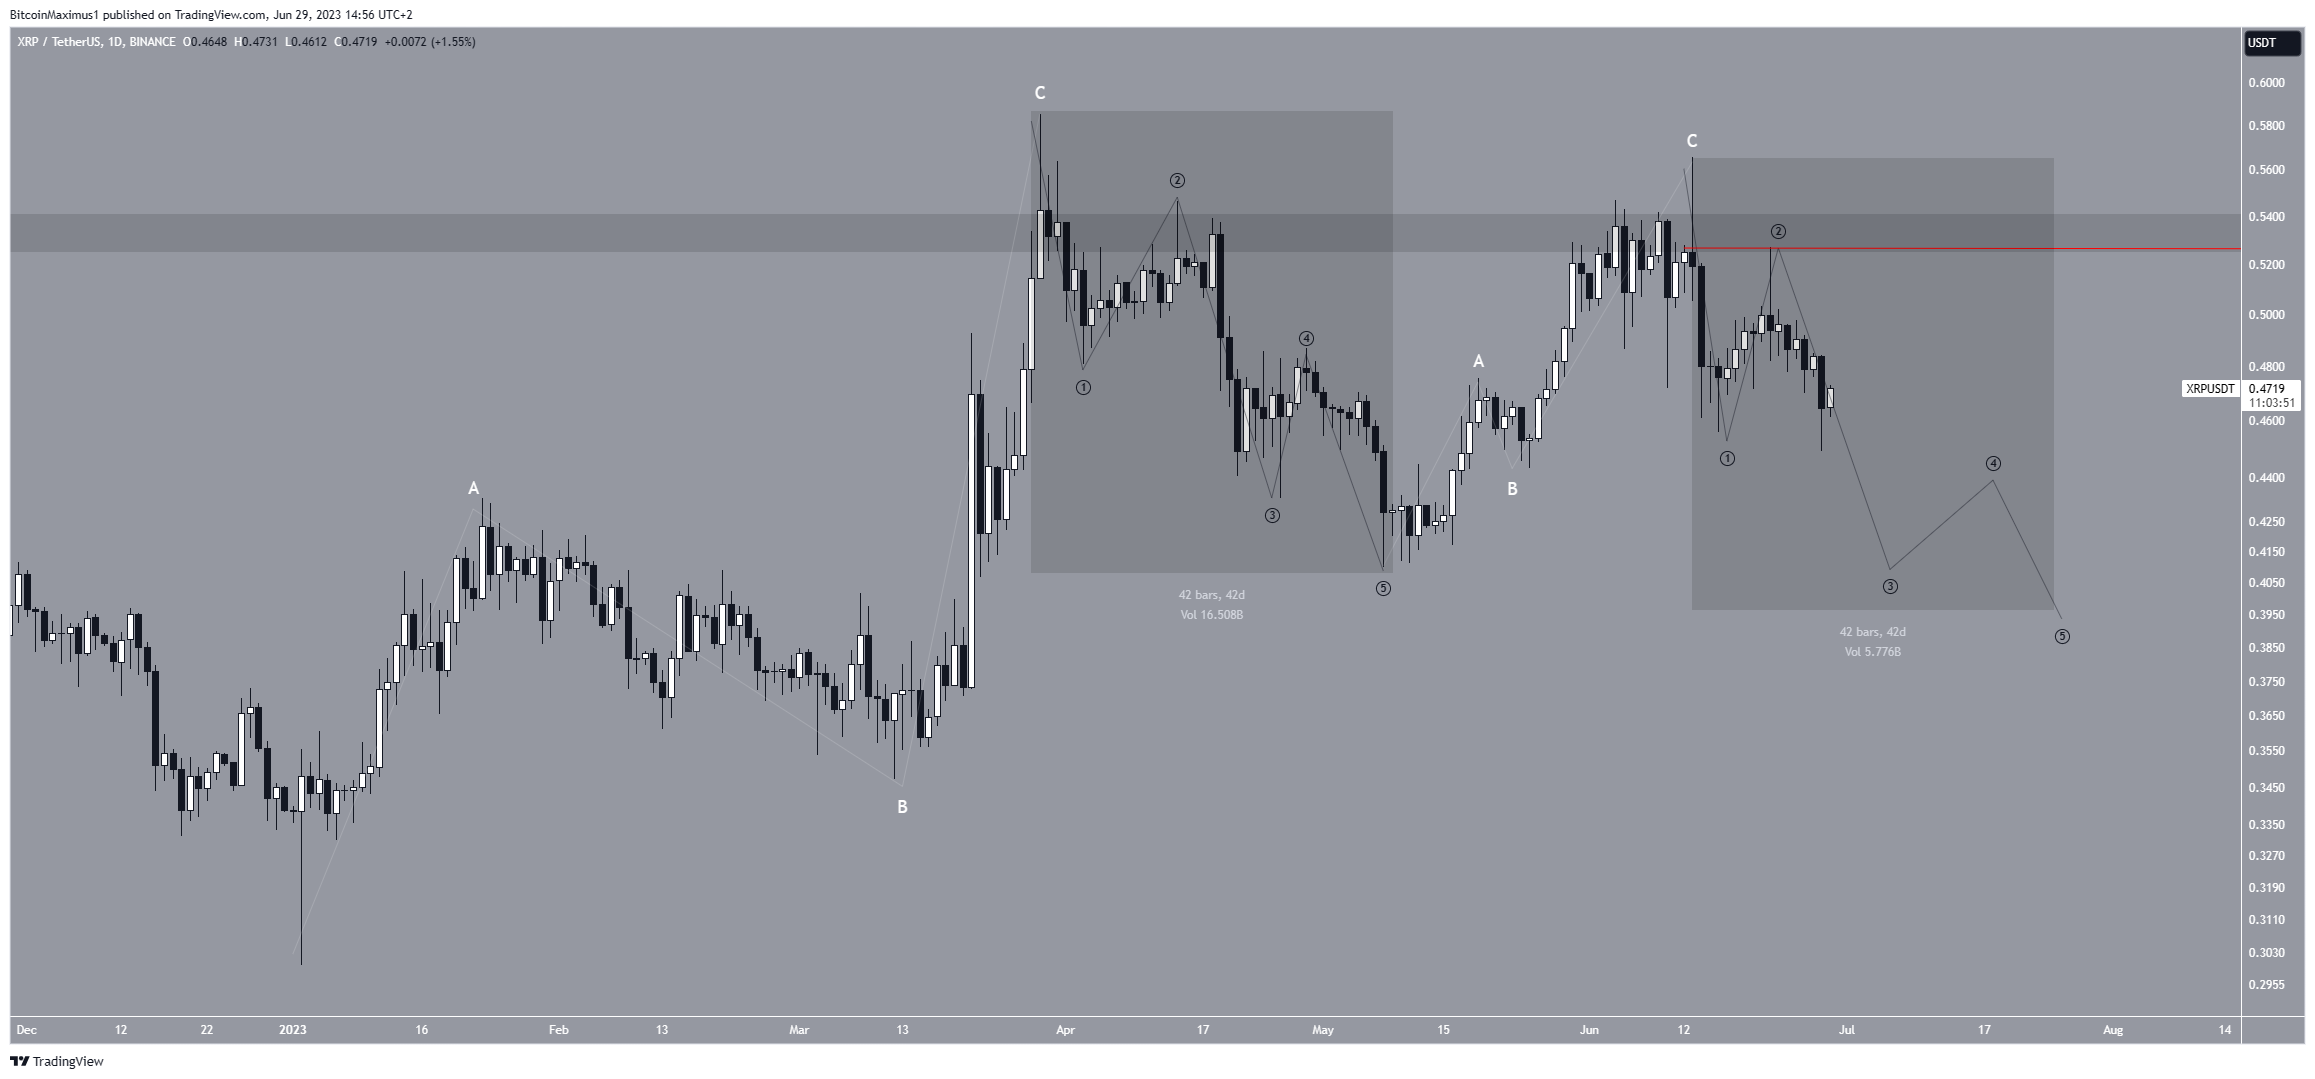
According to a technical analysis of the daily time frame, the price of XRP has reached its highest point for a while. So, it is expected to decrease in July.
This bearish prediction is based on the Elliott Wave theory, which examines recurring price patterns and investor psychology to determine trends.
This year, the movement of XRP’s price has shown a distinct pattern of three-wave structures (white) during increases, indicating potential corrections.
Then, the decline in April and May was a five-wave drop (highlighted). Consequently, if the wave count is accurate, XRP’s price is now mired in another five-wave decline (black), with a probable low around the $0.40 range.
If both decreases have the same length of time and magnitude, the XRP price will bottom near July 25 at $0.39. It is worth mentioning that this is just a rough estimate of where the price may bottom.
A more accurate prediction will likely depend on how the movement develops.

Despite this bearish XRP price prediction, an increase above the sub-wave two high (red line) at $0.53 will mean that the trend is still bullish.
The XRP price could quickly rally to the next resistance at $0.90 in that case.
For BeInCrypto’s latest crypto market analysis, click here
Disclaimer
In line with the Trust Project guidelines, this price analysis article is for informational purposes only and should not be considered financial or investment advice. BeInCrypto is committed to accurate, unbiased reporting, but market conditions are subject to change without notice. Always conduct your own research and consult with a professional before making any financial decisions. Please note that our Terms and Conditions, Privacy Policy, and Disclaimers have been updated.


