


BeInCrypto looks at five altcoins that increased the most in this week’s crypto market, specifically from May 26 to June 3.
The term altcoin refers to cryptocurrencies other than Bitcoin (BTC). These bullish altcoins have stolen the crypto news and cryptocurrency market spotlight this week as the biggest gainers:
- Injective (INJ) price increased by 27.88%
- Quant (QNT) price increased by 21.46%
- XDC Network (XDC) price increased by 17.13%
- Aptos (APT) price increased by 13.82%
- The Graph (GRT) price increased by 13.56%
Injective (INJ) Price Leads Bullish Altcoin Gainers
The INJ price has increased significantly since the beginning of the year. The increase may be part of a five-wave upward movement (white). If so, INJ is currently in the fifth and final wave.
Technical analysts employ the Elliott Wave theory as a means to identify recurring long-term price patterns and investor psychology, which helps them determine the direction of a trend.
If the count is correct, the INJ price could move to either $11 or $14.30. The targets are found by the 1:0.618 and 1:1 length of waves one and three combined. A breakout from the current channel would confirm the bullish outlook.
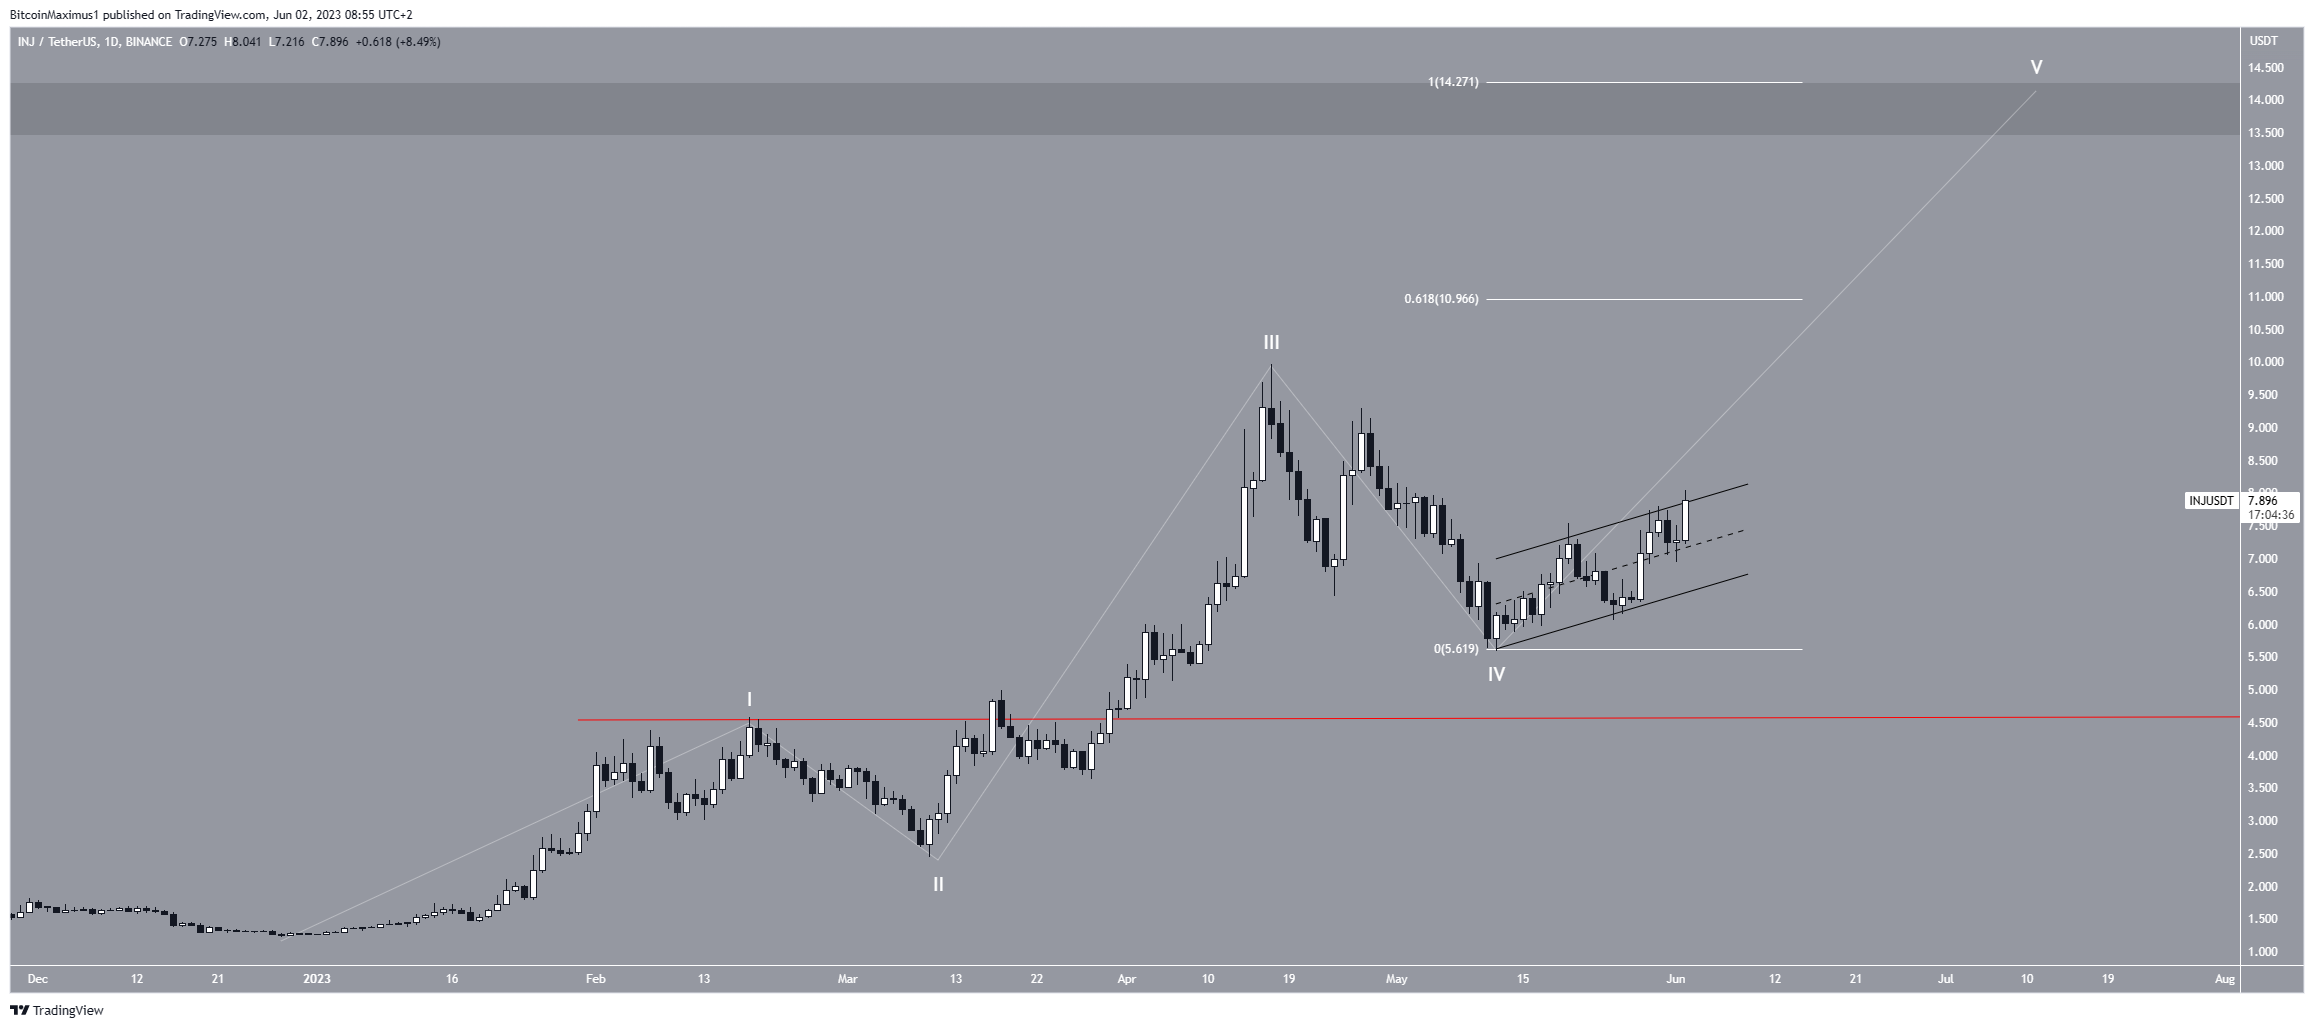
Despite this bullish INJ price prediction, a drop below the wave one high at $4.54 (red line) will mean that the trend is bearish. In that case, the price could drop to $2.50.
Quant (QNT) Price Clears Resistance
The QNT price had fallen under a descending resistance line since the beginning of February. The decrease led to a low of $96.50 on May 26.
However, the price broke out from the line after two days, suggesting that the correction is complete.
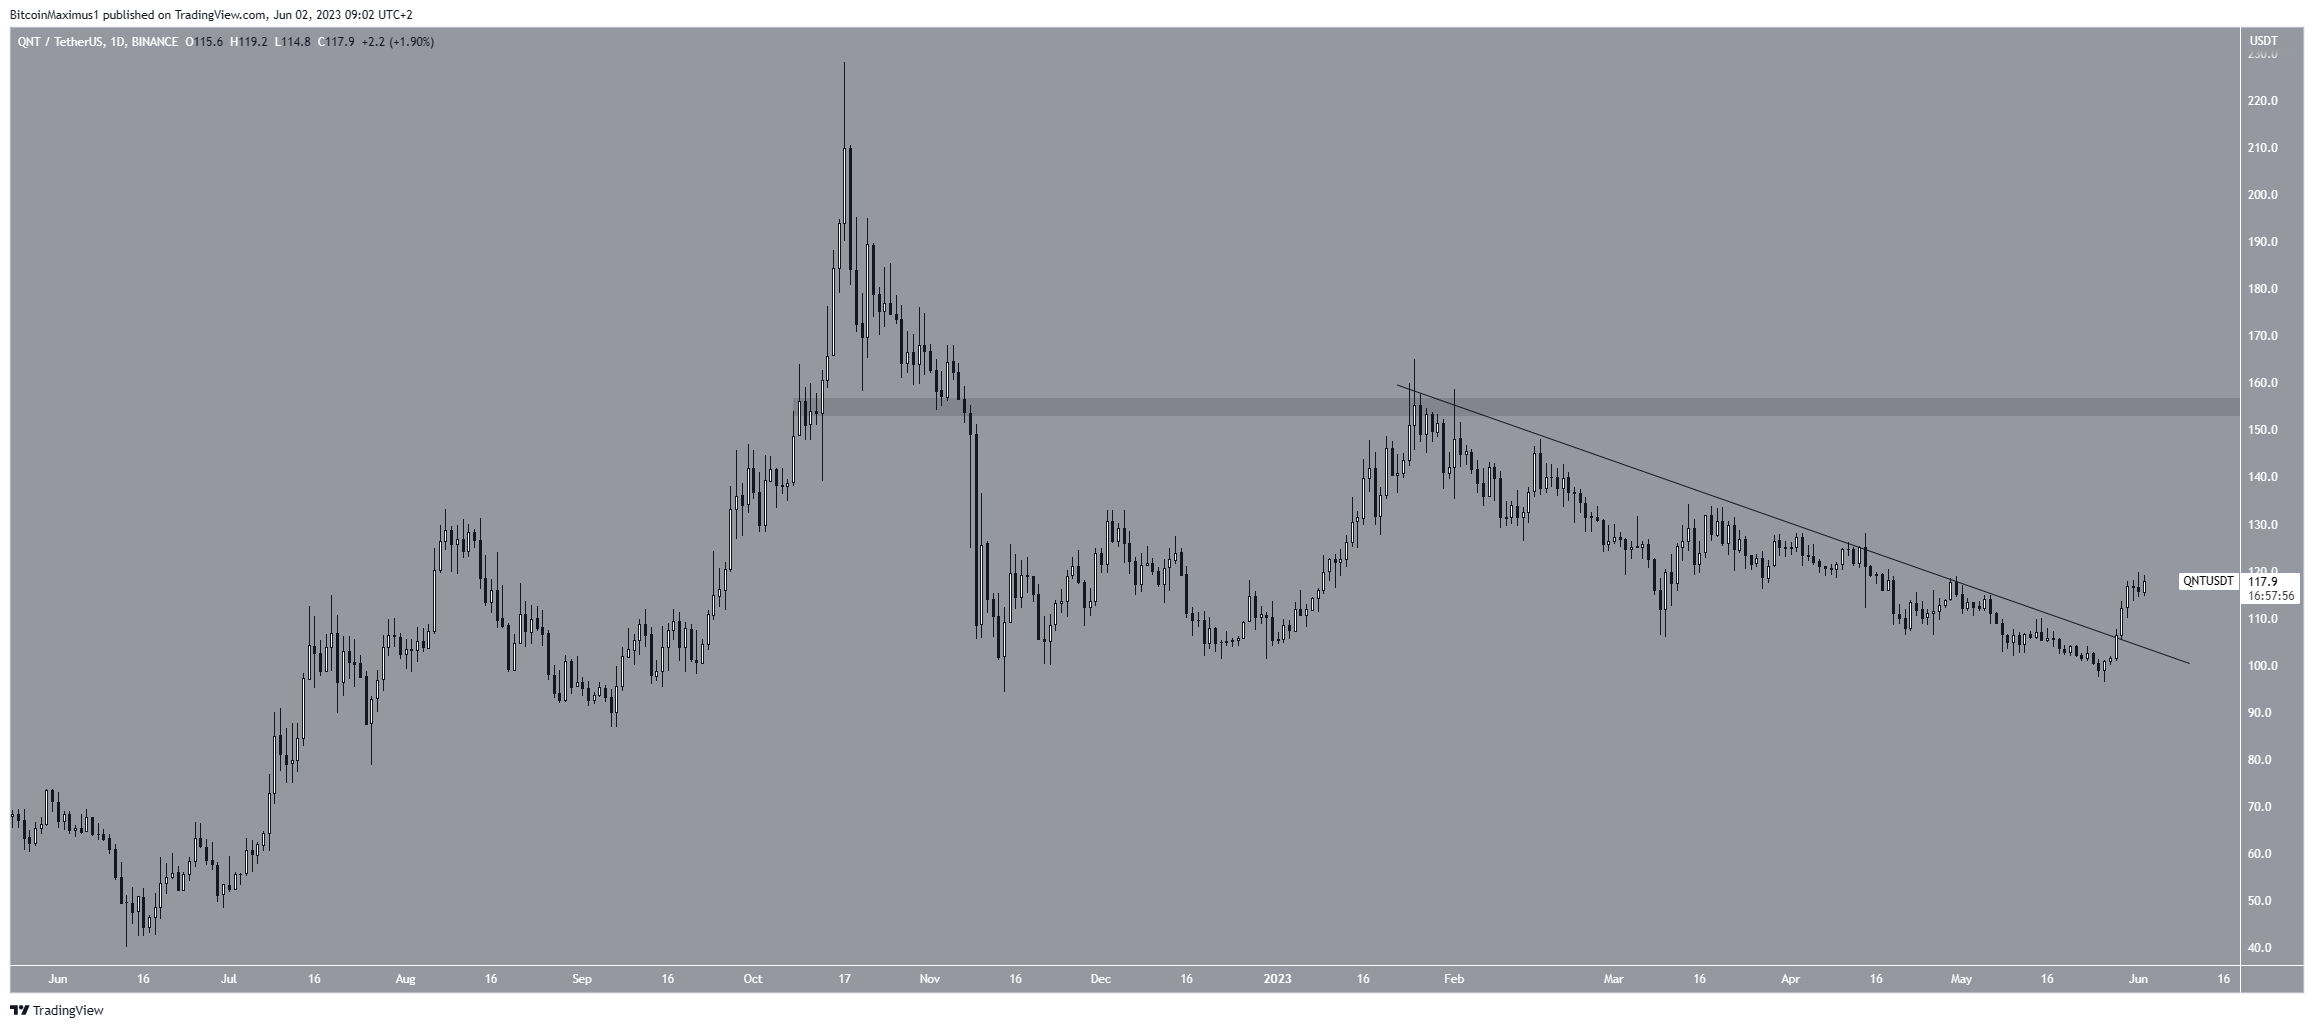
If the increase continues, the price could move to the next resistance at $155. However, if the price falls below the resistance line, a drop to $70 could then transpire.
Read More:
XDC Network (XDC) Price Saves Breakdown
The XDC price has increased alongside an ascending support line since December 2022. The increase led to a high of $0.047 in March 2023.
The price has fallen since and seemed to break down from the line in May. However, an upward movement followed shortly afterward, and the price reclaimed the line and reached the $0.042 resistance area.
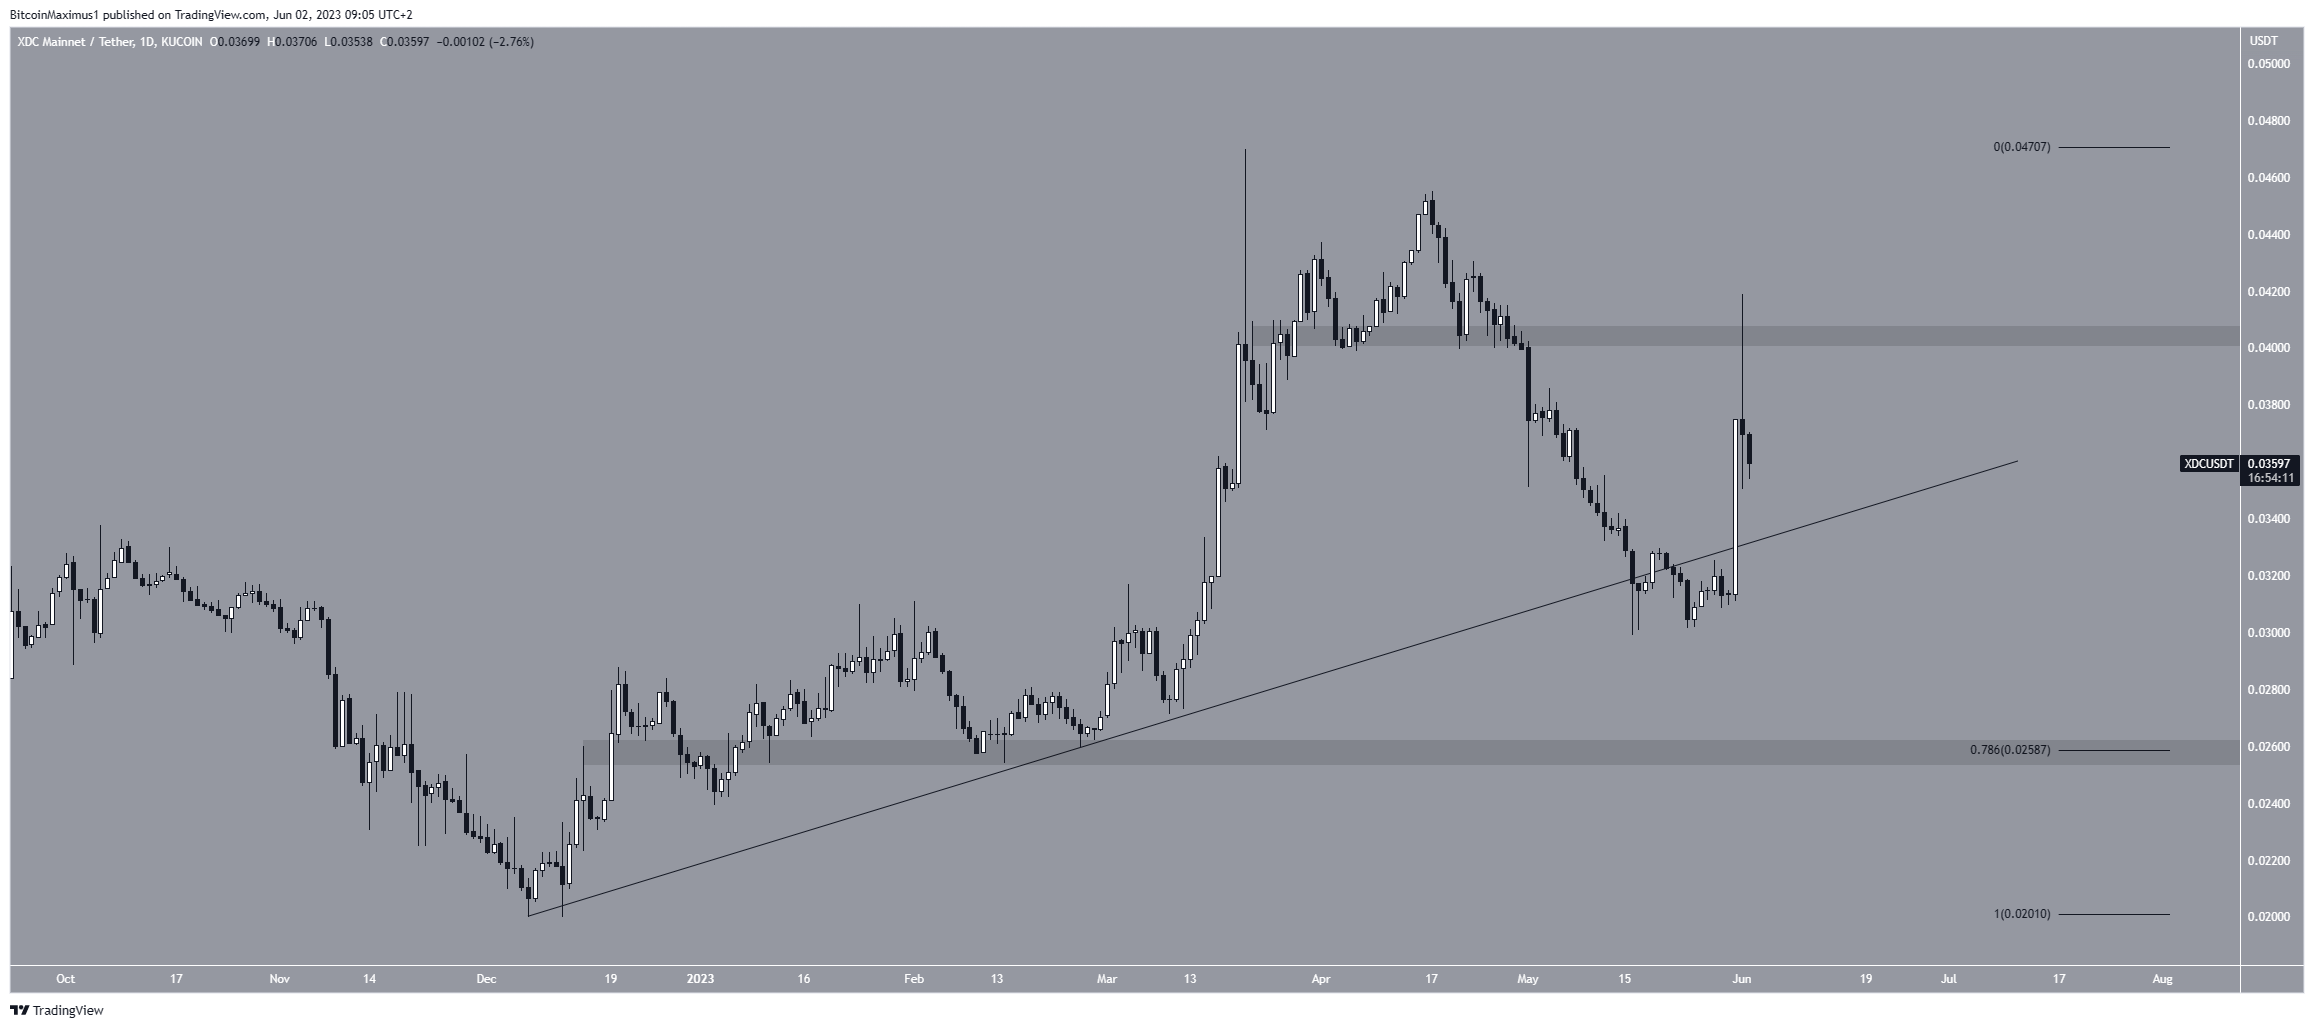
Whether the price bounces at the line or breaks down below it will determine the future trend.
A bounce will lead to another retest of the $0.042 area while a breakdown could lead to a drop to $0.026.
Aptos (APT) Price Could Break Resistance
The APT price has decreased below a descending resistance line since January. The downward movement led to a low of $7.70 on May 12.
However, the price created a higher low and is now in the process of breaking out from the line. If successful, this could initiate a sharp increase to the next resistance at $13.20.
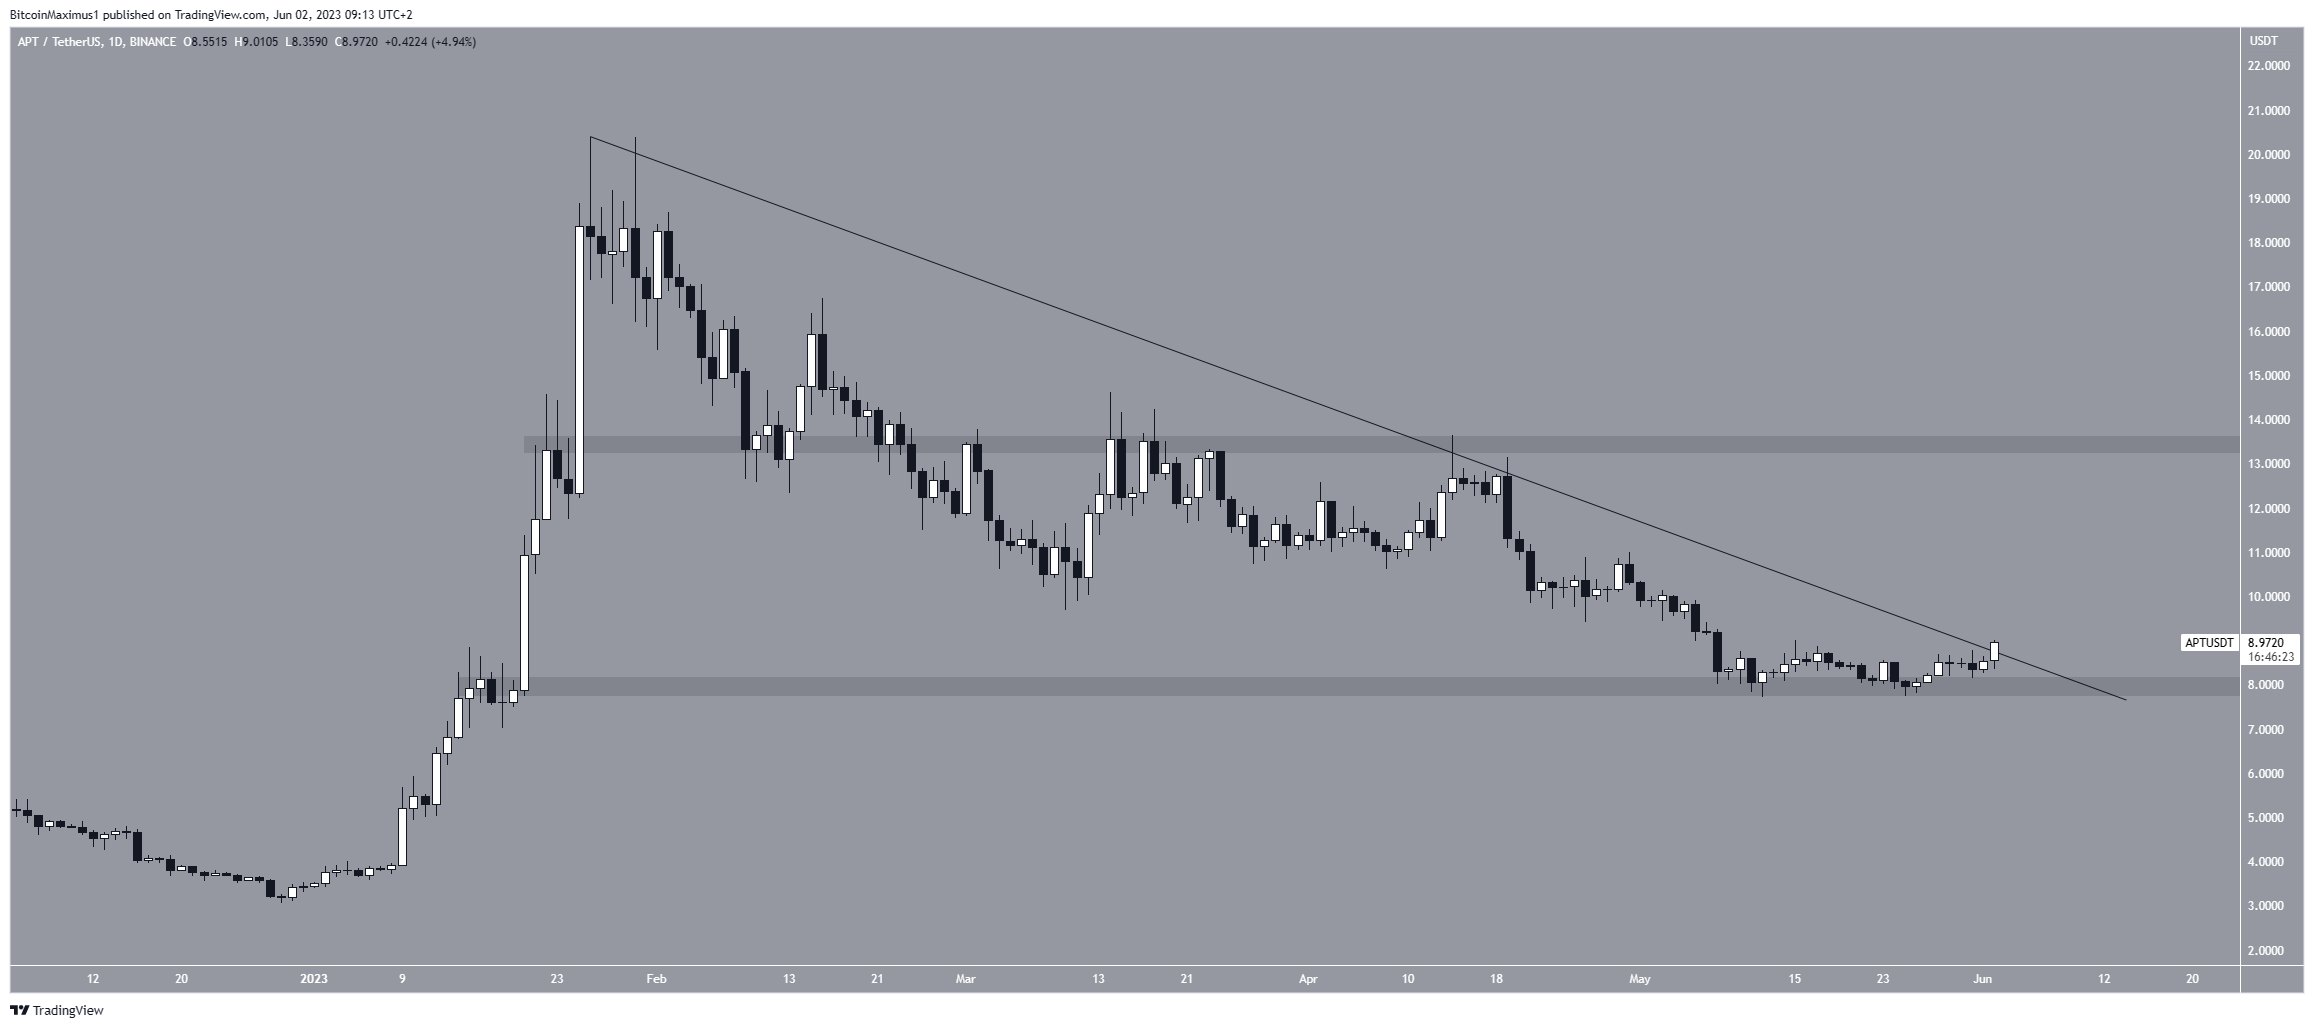
If the price breaks out from the line, an increase to the next resistance at $13.50 could transpire.
However, if it gets rejected and closes below the $8 support area, the APT price could drop to $4.50.
The Graph (GRT) Concludes Bullish Altcoins
The GRT price has fallen under a descending resistance line since Feb. 7. The decrease led to a low of $0.10 on March 10.
While the price has bounced several times since it failed to clear the descending resistance line. More recently, it was rejected by it on June 1 (red icon).
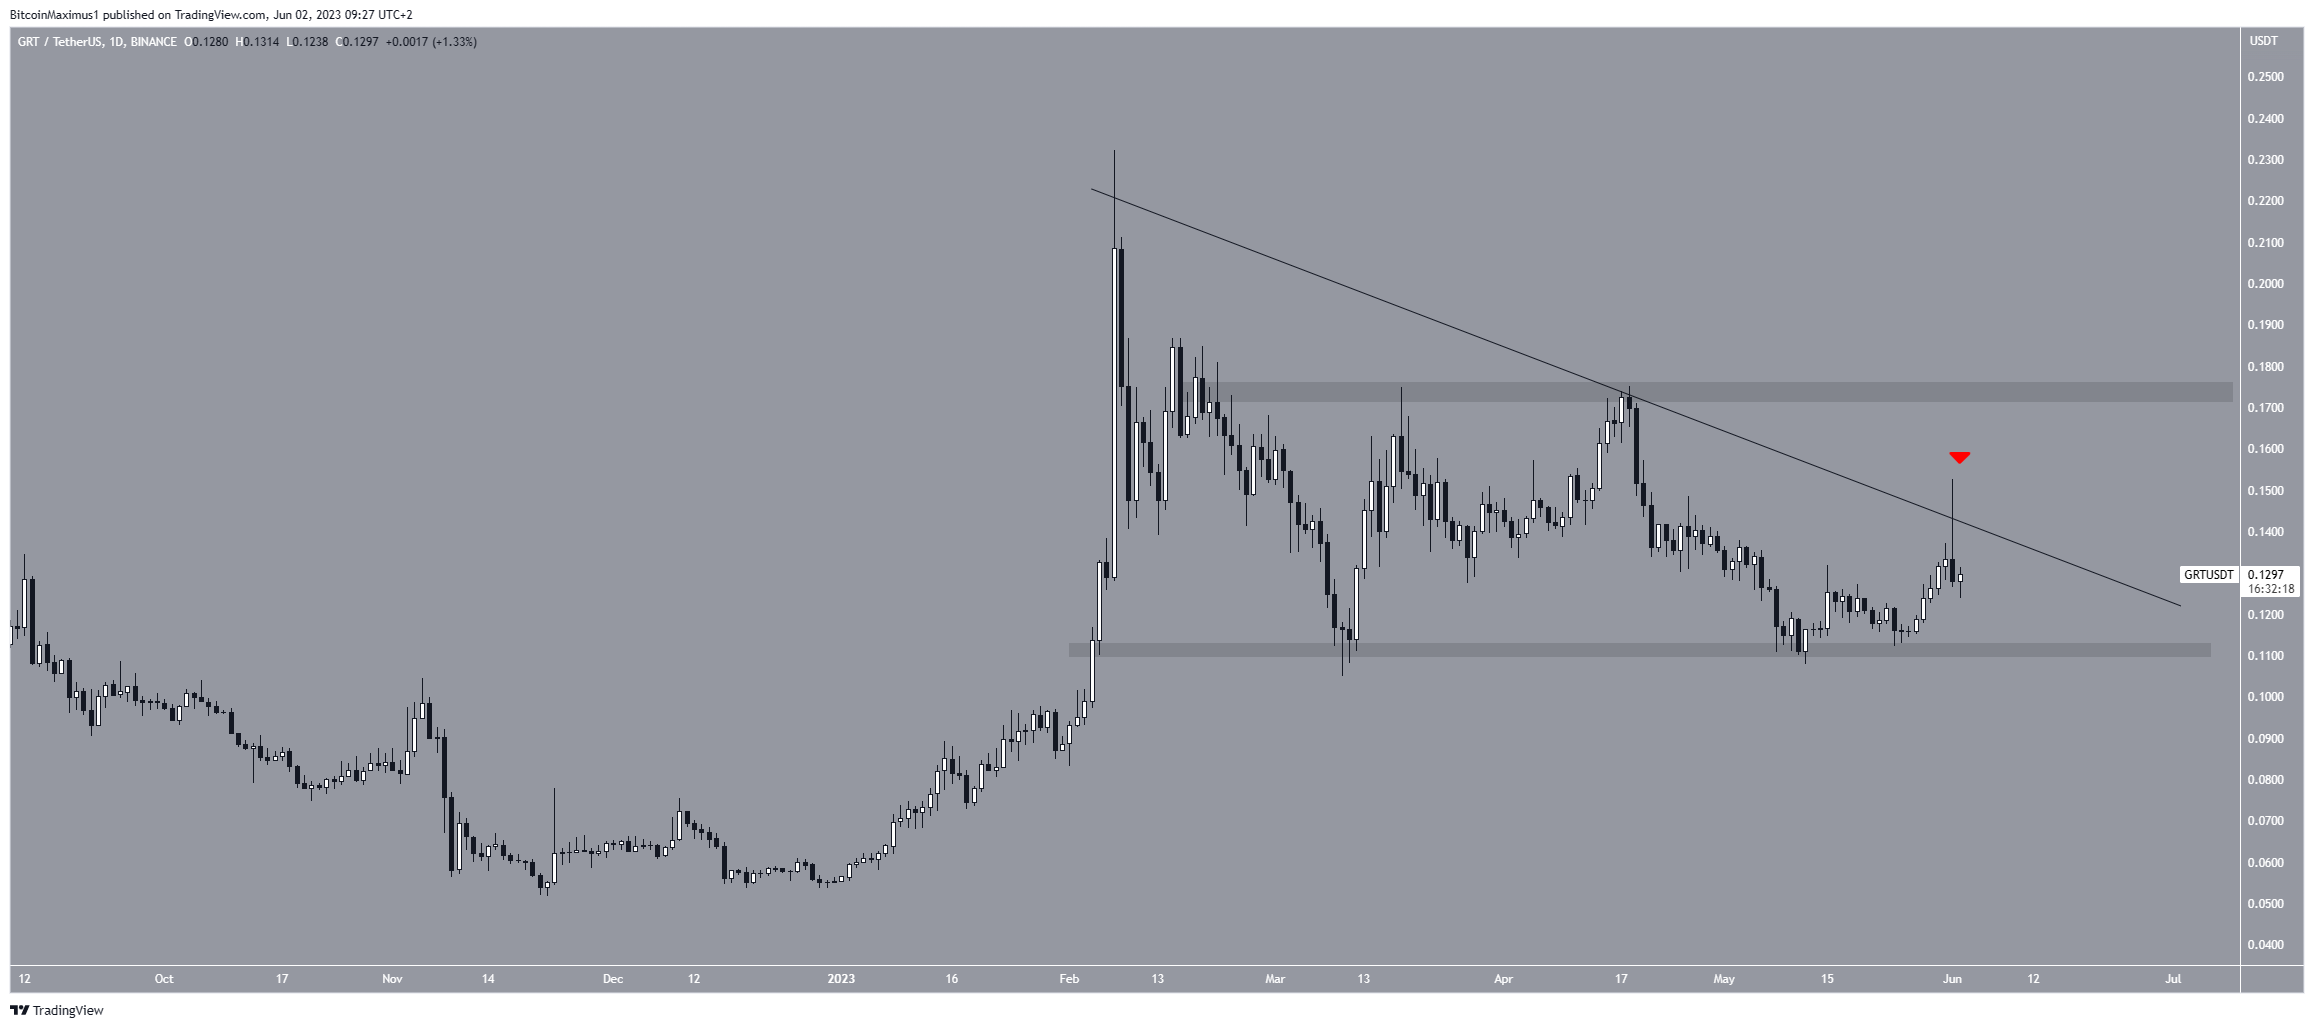
If the price breaks out, it could increase to the next resistance at $0.175. However, if the rejection continues, a decrease to the $0.110 area could transpire.
For BeInCrypto’s latest crypto market analysis, click here.


