

The Quant ecosystem connects multiple blockchains. The network’s native token, QNT, is trading at a 73.63% discount to its all-time high. But is it a good investment? This Quant price prediction piece uses tokenomics, on-chain metrics, and data-backed technical analysis to find out.
Want to get QNT price prediction weekly? Join BeInCrypto Trading Community on Telegram: read QNT price prediction and technical analysis on the coin, ask and get answers to all your questions from PRO traders! Join now
- Quant price prediction and fundamental analysis
- Insights that make QNT a good investment choice
- Quant tokenomics and the impact on the future price
- QNT price prediction and the trading exposure (2023 data)
- Quant price prediction and on-chain metrics (2023 data)
- Quant price prediction and technical analysis
- Quant (QNT) price prediction 2023
- Quant (QNT) price prediction 2024
- Quant (QNT) price prediction 2025
- Quant (QNT) price prediction 2030
- Quant (QNT) long-term price prediction until 2035
- Is the QNT price prediction accurate?
- Frequently asked questions
This article may be outdated, we suggest you visit our new Quant Network Price Prediction tool.
Quant price prediction and fundamental analysis
Imagine you are using a decentralized medical application on a specific blockchain. But what happens when the same application needs to work with another tool built on a different blockchain? Quant — the project — helps with that.
Insights that make QNT a good investment choice
Did you know? The primary use case of Quant is to facilitate the development of Mapps or multi-chain applications focused on interoperability.
Here are some of the other insights that you might find useful:
- Overledger, a novel form of DLT OS, is the underlying technology powering the Quant network.
- The Quant network allows developers to build different application layers across blockchains for the purpose of messaging, ordering, managing transactions, and other activities.
- There is a dedicated app store capable of tracking multi-chain insights.
- Overledger network supports smart contract writing even on non-compatible blockchains like Bitcoin.
- The project helps further the vision of “One Blockchain for all.”
- QNT — the native token of the Quant network — can be deployed as the transaction juice for developing the applications. Every resource within the Quant ecosystem is paid for using the QNT tokens.
- Quant is one of the few networks with a community-run treasury. And guess what? Even the treasury is a Mapp built inside the ecosystem.
- Finally, its Overledger platform even plans to cater to enterprises, provided the adoption grows in time.
Here is how Quant’s Overledger competes with other scalability and interoperability projects:
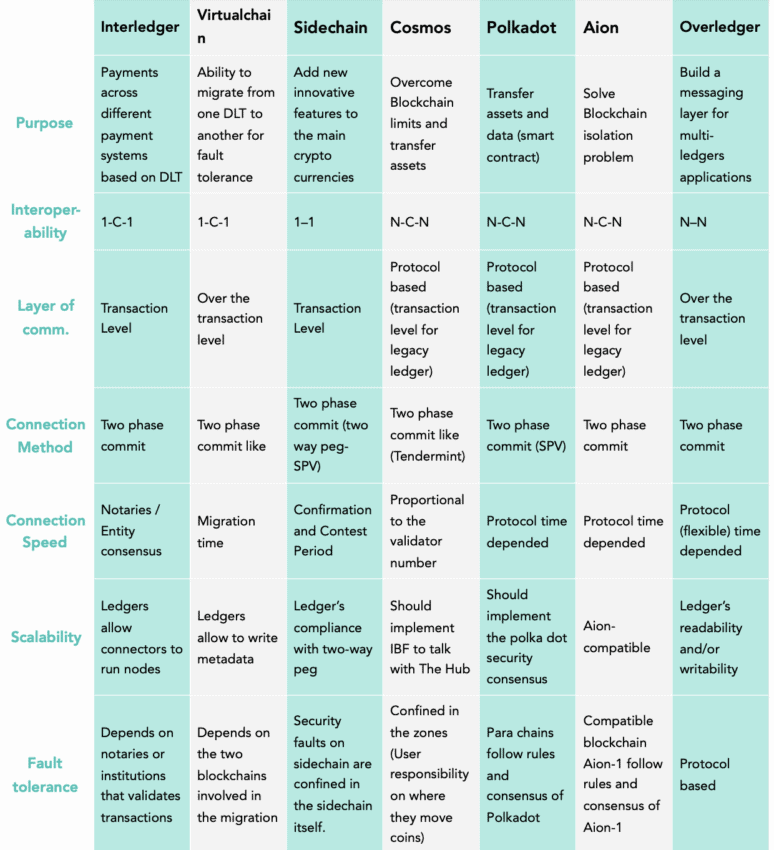
Overall, Quant aims to change the way we view blockchain technology.
Quant tokenomics and the impact on the future price
Like several other desirable projects, QNT tokens have a supply cap of 14.88 million. The ecosystem raised initial funding by selling 9.9 million on those tokens in an Initial Coin Offering event. Also, the circulating supply of QNT is currently a little higher than 12 million. This means the network itself is currently holding over 2 million QNT tokens.
Keeping track of those tokens is essential as they aren’t locked via smart contracts and can be liquidated instantly. Also, developer activity is a major revenue generator for the ecosystem. Devs must purchase licenses using the QNT tokens even to consider building Mapps.
We cannot ignore the possible selling pressure on QNT. Yet, observing how the future price responds when the entire supply enters circulation will be interesting.
QNT price prediction and the trading exposure (2023 data)
In early 2023 too, QNT was trading at a nearly 73% discount to its all-time high price. We can compare the peak market cap and trading volume of QNT with the 2023 — to find the overall volatility in play.
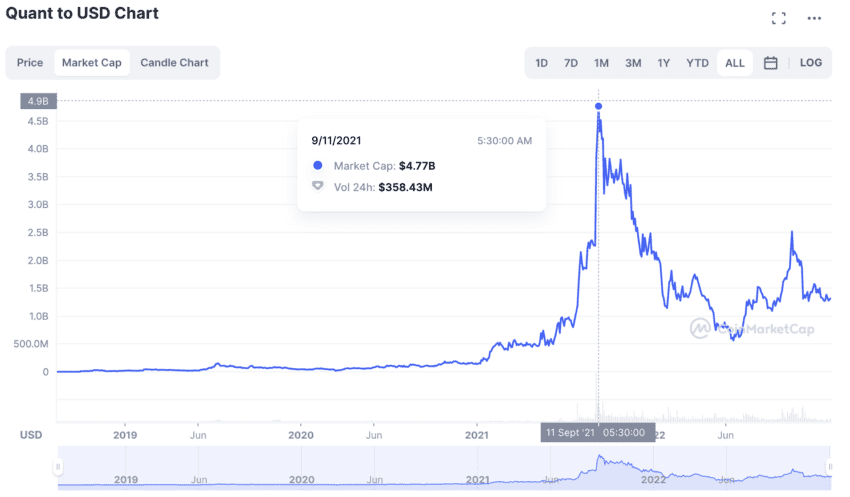
If you look at QNT’s market cap progression, you can see the peak forming on Sep. 11, 2021. The peak market cap figure was $4.77 billion, and the trading volume at that time was $358.43 million. The turn-over ratio — trading volume by market capitalization — comes out to be 0.075.
As of Jan. 4, 2023, the market capitalization was $1.30 billion, but the volume dropped to $26.63 million. The turnover ratio as of Jan. 4, 2023, was 0.020. A higher turnover ratio means lower volatility, meaning the price of QNT might be more volatile in 2023 than at the peaks, which might also have led to a muted price move.
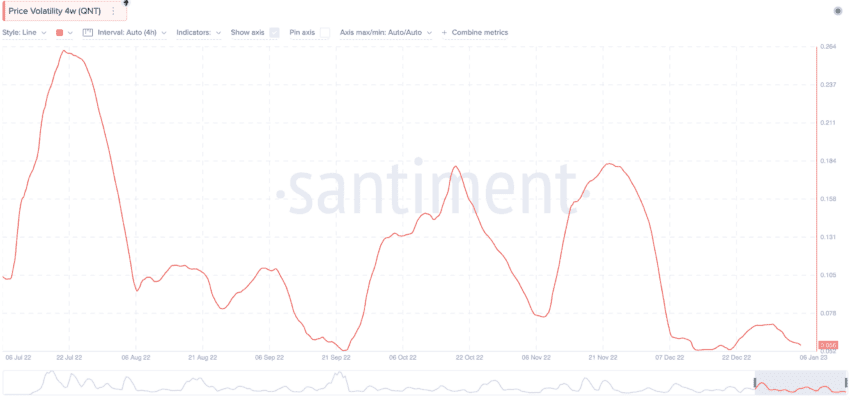
But there is a silver lining to all of this. The 4-week volatility chart, as of — early January 2023, shows that QNT’s volatility was the lowest since July 2022. This was good news for the short-term price action of QNT, which did grow but not as massively as expected.
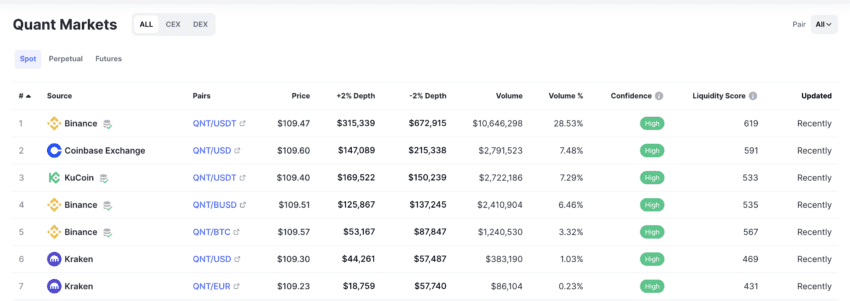
However, significant trading popularity helps put a tab on the existing volatility. QNT has relatively high spot trading market exposure, with Binance’s QNT-USDT trading pair making nearly 29% of the overall volume as of January 2023. Liquidity is high courtesy of decent 24-hour trading volume figures.
Quant price prediction and on-chain metrics (2023 data)
The project fundamentals and tokenomics seem in control. We can now shift our attention to the on-chain details, including the active address growth.
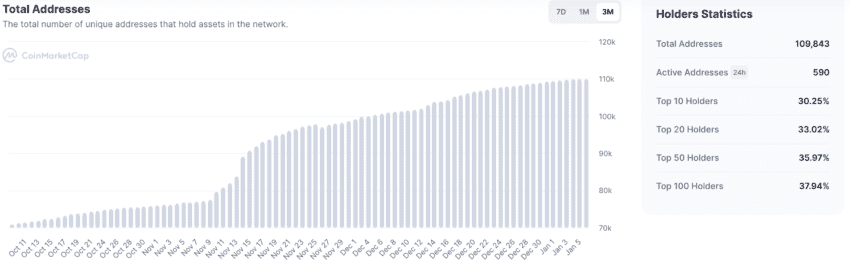
Looking closely at the 3-month data for QNT, it is clear active addresses have been steadily growing. While that looks optimistic for the short-term price action of QNT, another related trend comes to our attention.
Surprisingly, the top 100 holders of QNT only hold 37.94% of the circulating supply. This represents a proportionate distribution, ensuring that QNT might not be so susceptible to market-wide pumps and dumps.
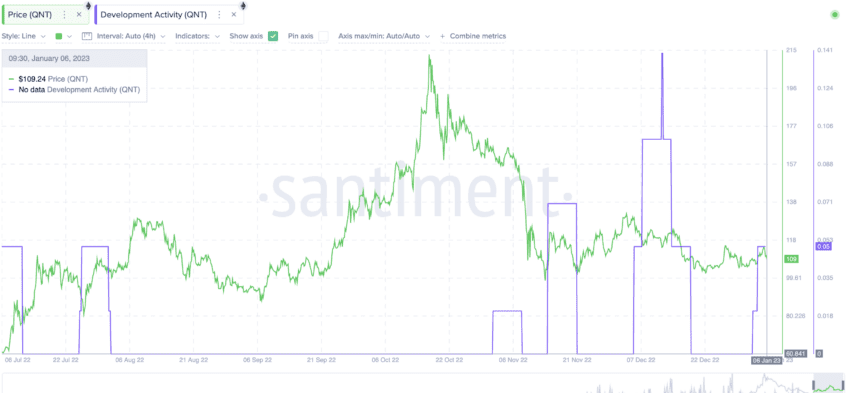
The development activity at Quant Network peaked in December 2022. The prices also saw some momentum during that time. Currently, the development activity is on the way up, which might push the prices higher.
Quant price prediction and technical analysis
It is now time to delve deeper into the Quant price prediction calculations, courtesy of technical analysis. In this segment, we will look at the historical data of QNT and try to draw the next leg of QNT price forecasts.
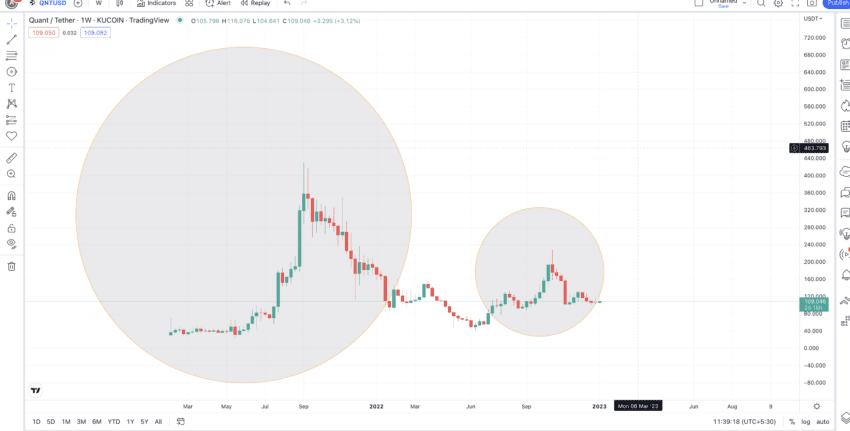
But before we go any further, here is a look at QNT’s weekly chart:
/Related
More Articles


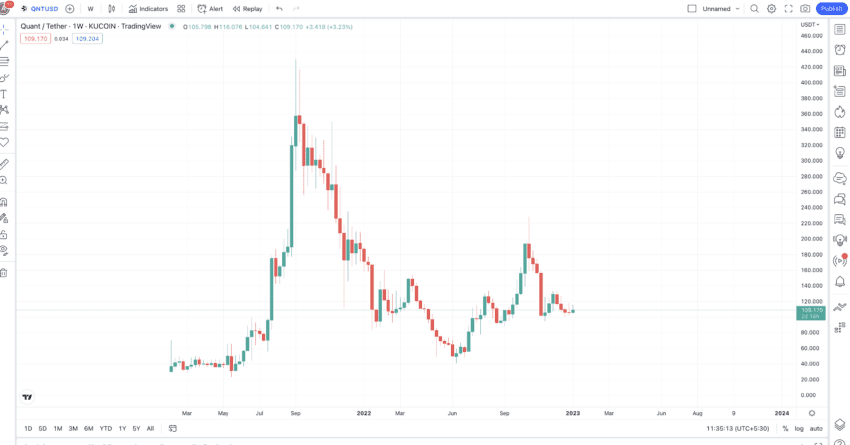
Look closely to notice the clear patterns made by QNT. The chart can be divided into two segments: the first starts with a high that forms a peak and then drops to make a lower high. Then, we see a bottom post in which the first segment — high, peak, and lower high — is repeated on a smaller scale.
We can assume the QNT price prediction continues following the same pattern. We have the zones marked for your better understanding.
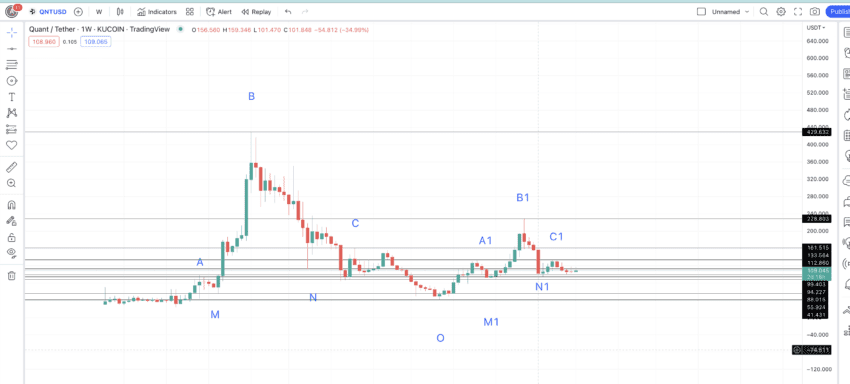
Finally, we have also marked all the important high and low points on the chart to help us with the calculations.
Price changes
Notice that the charts have identical patterns: A-B-C and A1-B1-C1. The lows are market M-N-O and M1-N1. Our task is now to find O1 or the low after C1. This might be the point that starts the next leg of peaks.
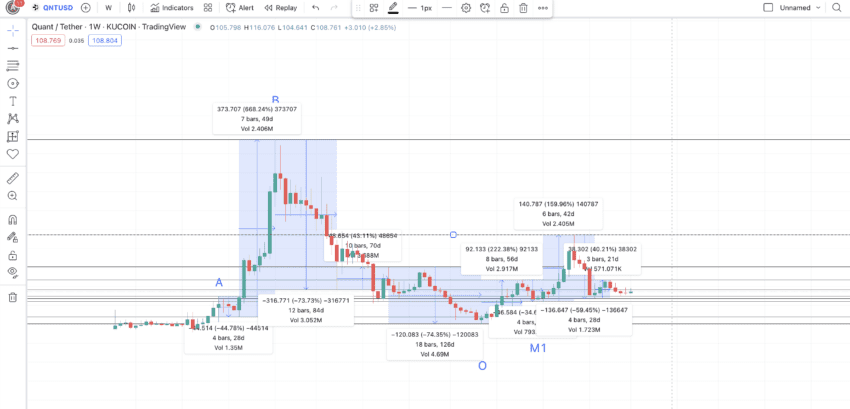
Let us now find the distance and price changes between each point, starting from A:
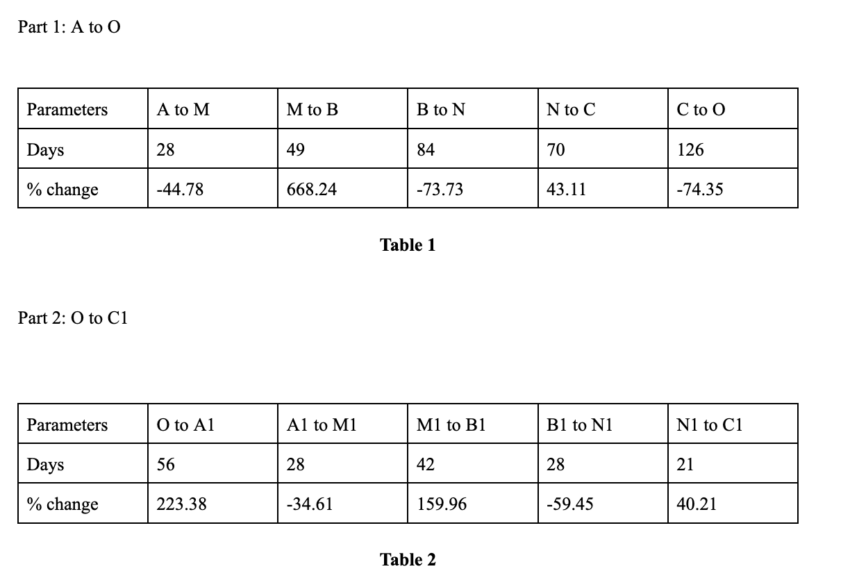
Data sets using the tables above reveal a few important facts:
- The drop from A to M and A1 to M1 took the same number of days, and the percentage change wasn’t too different. Hence, we might have just found the right historical data patterns.
- The smaller stature of the A1-B1-C1 segment is due to the bearish state of the crypto market.
- The high-to-low average time and price drop values are 59 days and 57.38%. The maximum distance, per table 1, can be 126 days.
- The low-to-high average time and price rise values are 48 days and 226.98%. The maximum distance, per table 1, can be 70 days. This might extend further in the bear market.
We will now use the above-mentioned insights to prepare the Quant price prediction model.
Quant (QNT) price prediction 2023
Even though we expected QNT to reach $186.36 by 2023, the prices flatlined at $148. However, we still stick to what we inferred in 2023 and the bull market in 2024 might just make up for this deficit. Here is how our 2023 prediction went:
Now that we have C1 and the average drop percentage of 57.38, we can locate the next low or O1. The chart suggests that O1 can surface anytime between 59 days and 126 days, dropping as low as $56.95.
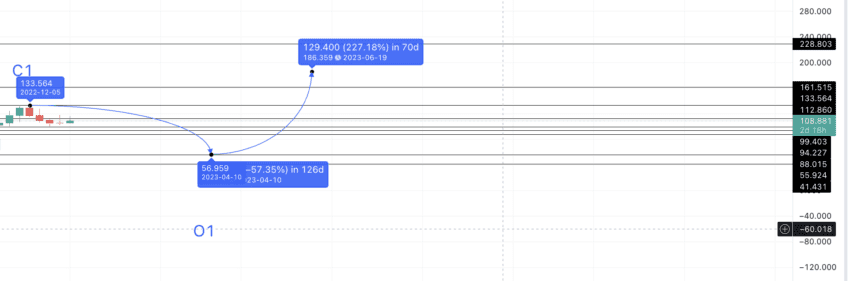
As we can expect the crypto market to go lower in Q4 2021, this Quant price prediction for 2023 doesn’t look out of the question. Multiple support levels at $99.40 $94.22, $88.01, and more might prevent QNT from dropping as low as $56.95. Yet, we will keep the maximum price drop in mind and proceed.
The low-to-high percentage is 226.98%. Therefore, from the projected low of O1, the price of QNT can go as high as $186.36. This can be the maximum price of QNT in 2023. We can mark this as A2.
Quant (QNT) price prediction 2024
Outlook: Bullish
surface at $79.73.
The average price growth percentage from this low or M2 puts the high at $260.894 in 2024. Thus, if you are looking for the Quant price prediction 2024 model, $260.894 could be the maximum price.
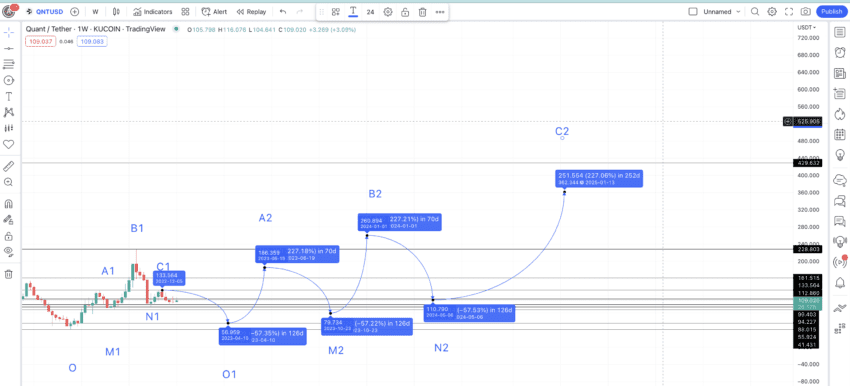
The low in 2024 can continue to follow the average price drop of 57.38%. The distance can still vary between 59 days and 126 days. The minimum price in 2024 can surface at $110.79.
Projected ROI from the current level: 130%
Quant (QNT) price prediction 2025
Outlook: Bullish
We have the maximum price of Quant in 2023. Now, we can again use the average drop percentage to locate the new M or M2. The current crypto market conditions put the same in 2023 — using the max distance of 126 days. Therefore, M2 in 2023 might
The next high, from N2, can land close to $362.34 if we use the average price hike of 226.98%, per the tables above. While the maximum price might just show up in 2024 itself, we can assume this high will be breached in early 2025. We can mark this point C2.
By this time or by C2, QNT should be able to break its pattern formation trend where any C is lower than B. With the highest Quant price prediction for 2025 or C2 now higher than B2, the price of Quant should ride the uptrend. The low-form C2 can surface at a drop of 57.38%. But the increase in price momentum might mean the minimum Quant price prediction for 2025 takes support at $228.80. We can mark this point as O2.
Projected ROI from the current level: 219%
Quant (QNT) price prediction 2030
Outlook: Bullish
Over time, the price surges take more time to surface. Therefore, considering the maximum Quant price prediction for 2025 to be at $364.34 and the minimum QNT price for 2025 to surface at $228.80, we can expect the next high or A3 to surface in early 2026.
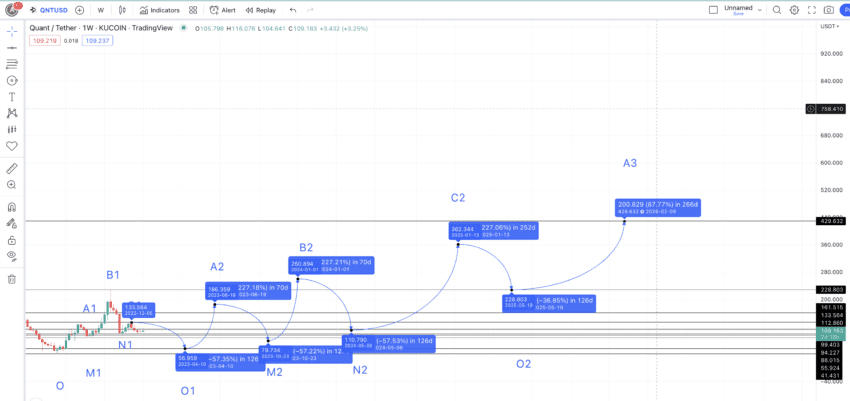
Even though the average price hike percentage is 226.98, for 2026, we can expect it to be less than 100%, putting the high at $429.63 — a strong resistance level that coincides with QNT’s all-time high price.
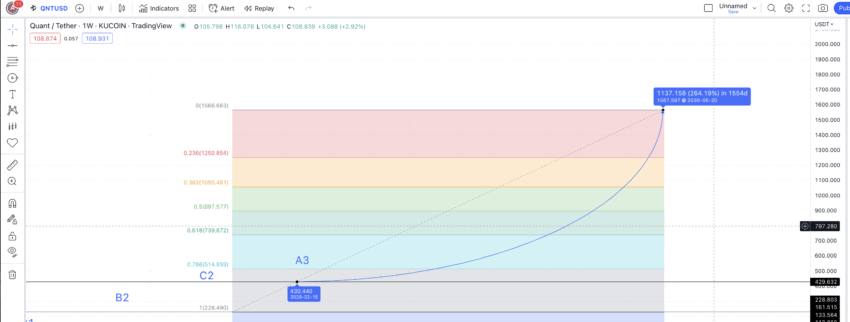
Now we have 2026 high and 2025 low; we can connect the points using the Fib levels to trace the path till 2030.
If the price of Quant follows the same path as O2 to A3, we can expect it to reach $1567.60 by 2030. The minimum Quant price prediction for 2030 might surface at $1251, which is the immediate support level for the $1567.60 high.
Projected ROI from the current level: 1278%
Quant (QNT) long-term price prediction until 2035
Outlook: Bullish
Here is a table that traces the long-term future price of Quant.
You can easily convert your QNT to USD
| Year | | Maximum price of Quant | | Minimum price of QNT |
| 2024 | $260.894 | $110.79 |
| 2025 | $362.34 | $228.80 |
| 2026 | $429.63 | $266.37 |
| 2027 | $580.00 | $452.40 |
| 2028 | $870.00 | $678.60 |
| 2029 | $1174.50 | $728.19 |
| 2030 | $1567.60 | $1251.00 |
| 2031 | $2116.26 | $1650.68 |
| 2032 | $2645.32 | $2063.34 |
| 2033 | $3967.98 | $3095.02 |
| 2034 | $4959.98 | $3868.78 |
| 2035 | $6943.97 | $4860.77 |
Is the QNT price prediction accurate?
Digital assets rely, to a heavy extent, on historical data and patterns. Therefore, this Quant price prediction model is fairly accurate and realistic; it is loaded with data-backed technical analysis insights. Furthermore, our QNT price prediction considers the fundamentals, tokenomics, and ecosystem growth — offering a market-agonistic price forecast.
Frequently asked questions
Is Quant a good investment?
How high can Quant go?
Is Quant a stablecoin?
Is Quant built on Ethereum?
Trusted
Disclaimer
In line with the Trust Project guidelines, the educational content on this website is offered in good faith and for general information purposes only. BeInCrypto prioritizes providing high-quality information, taking the time to research and create informative content for readers. While partners may reward the company with commissions for placements in articles, these commissions do not influence the unbiased, honest, and helpful content creation process. Any action taken by the reader based on this information is strictly at their own risk. Please note that our Terms and Conditions, Privacy Policy, and Disclaimers have been updated.