


These altcoins have bullish-looking formations and could reach new all-time highs in January.
December has been a bullish month for the cryptocurrency market, with new yearly highs for several altcoins. BeInCrypto looks at the top altcoins for January that could hit new all-time highs.
Arbitrum (ARB) Parabola Can Lead to New High
The ARB price has increased alongside a parabolic ascending support trend line since October. More recently, it validated the trend line on December 18 (green icon) and began the current upward movement.
So far, the ARB price has cleared the $1.30 horizontal resistance area and has only the $1.75 resistance left before the all-time high of $1.82.
Technical analysts employ the Elliott Wave theory to identify recurring long-term price patterns and investor psychology, which helps them determine the direction of a trend.
The most likely wave count suggests that the price is in the third wave of a five-wave upward movement (black). The third wave has extended, and the sub-wave count is shown in white.
If the count is correct, the third wave will be 2.61 times the length of wave one, leading to a high of $2.25. This is nearly 50% above the current price.
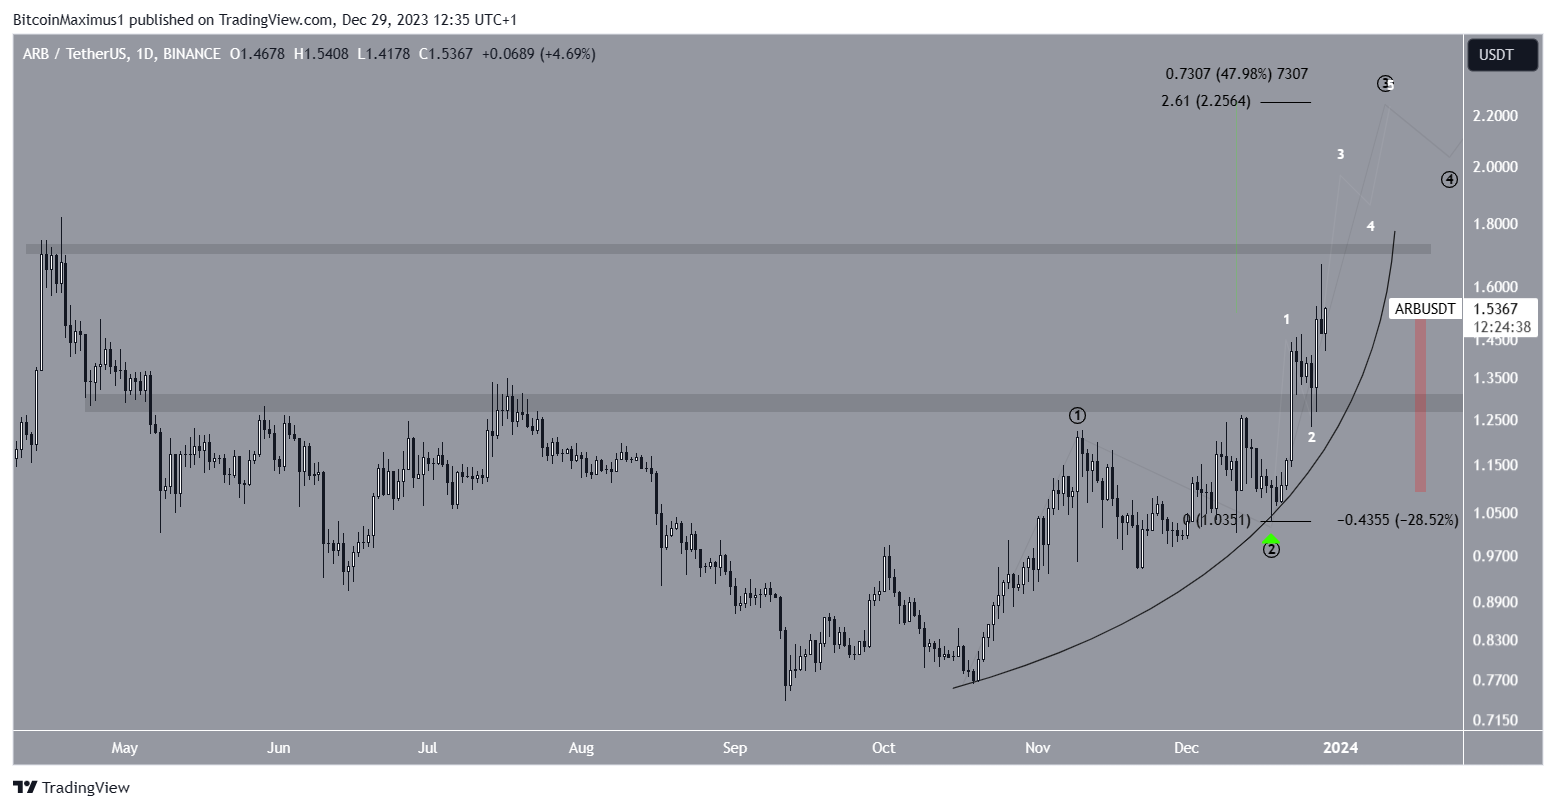
Despite this bullish ARB price prediction, a close below the parabolic ascending support trend line will invalidate the count. Then, the ARB price can fall by 30% to the closest support at $1.10.
Optimism (OP) Retests Previous All-Time High
The OP price reached its all-time high of $4.18 on December 27. While it fell afterward, it validated the previous all-time high resistance region at $3.10 as support (green icon). Such retests often lead to the continuation of the upward movement in the original direction.
Traders utilize the RSI as a momentum indicator to assess whether a market is overbought or oversold and whether to accumulate or sell an asset. If the RSI reading is above 50 and the trend is upward, bulls still have an advantage, but if the reading is below 50, the opposite is true. The RSI is increasing and is above 50, both signs of a bullish trend.
If the upward movement continues, the OP price can reach the top of a long-term ascending parallel channel, which has been in place since June 2022. The channel’s resistance trend line is at $6.20, 70% above the current price.
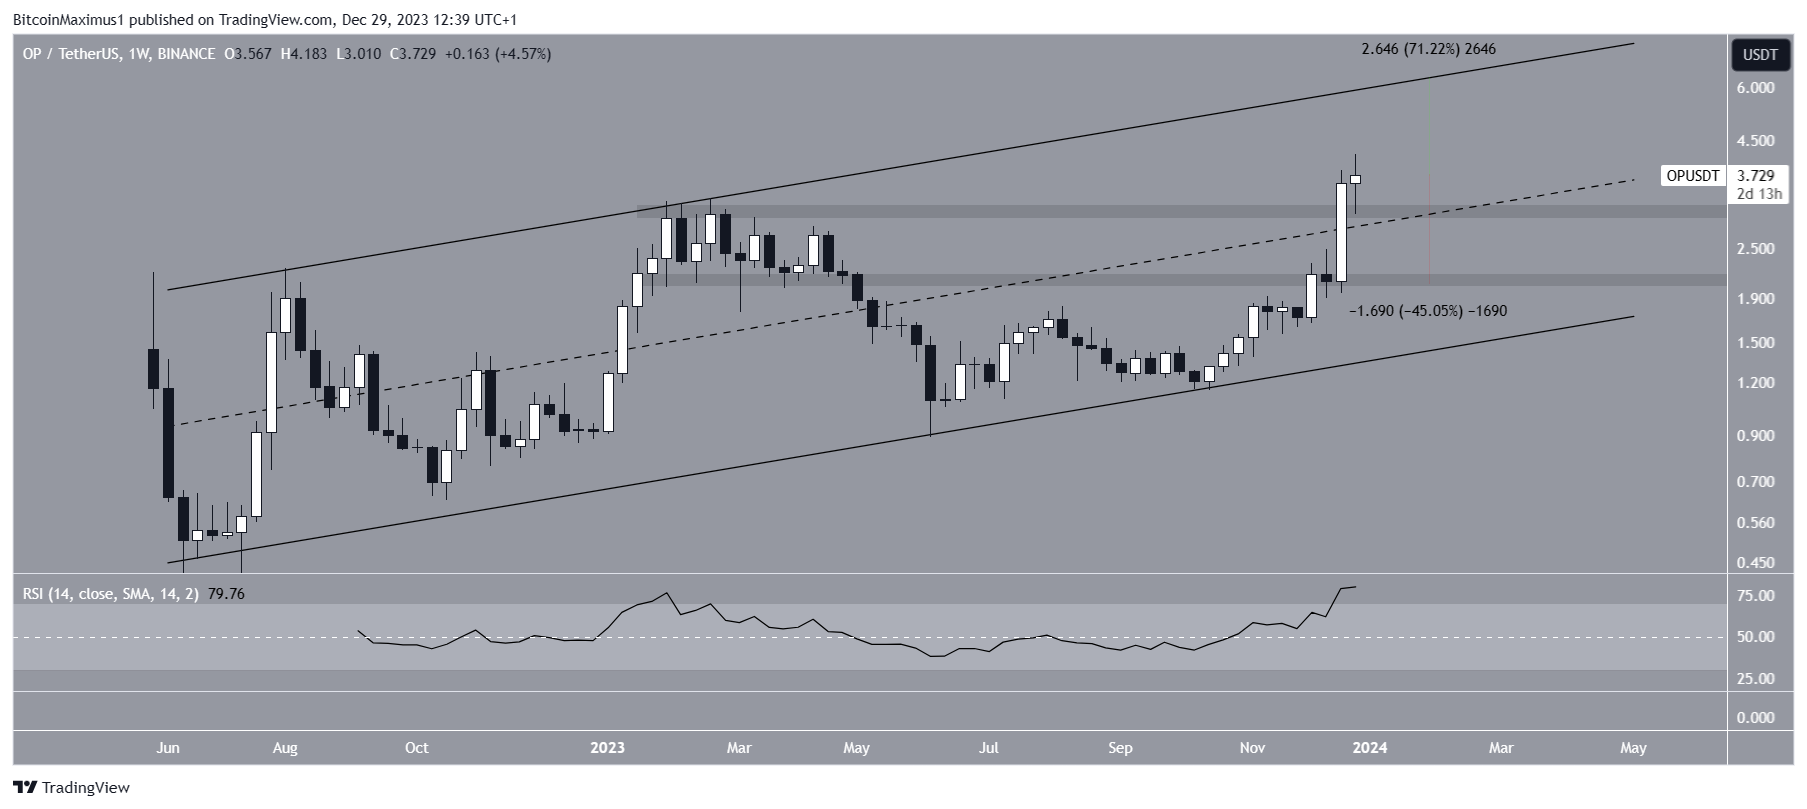
Despite this bullish OP price prediction, a weekly close below the $3.10 support will invalidate this bullish outlook. Then, OP could fall by 45% to the closest support at $2.
GMX Concludes All-Time High Altcoins
The GMX price broke out from a descending resistance trend line in October. Before the breakout, the trend line had been in place since the all-time high.
The price has increased since reclaiming and validating the $42 level as support (green icon). Additionally, the RSI supports this bounce since it increased above 50 (green icon).
GMX faces only one more resistance at $58 until the all-time high of $92. So, if GMX reaches a weekly close above the area, it can increase by 70% to 90.
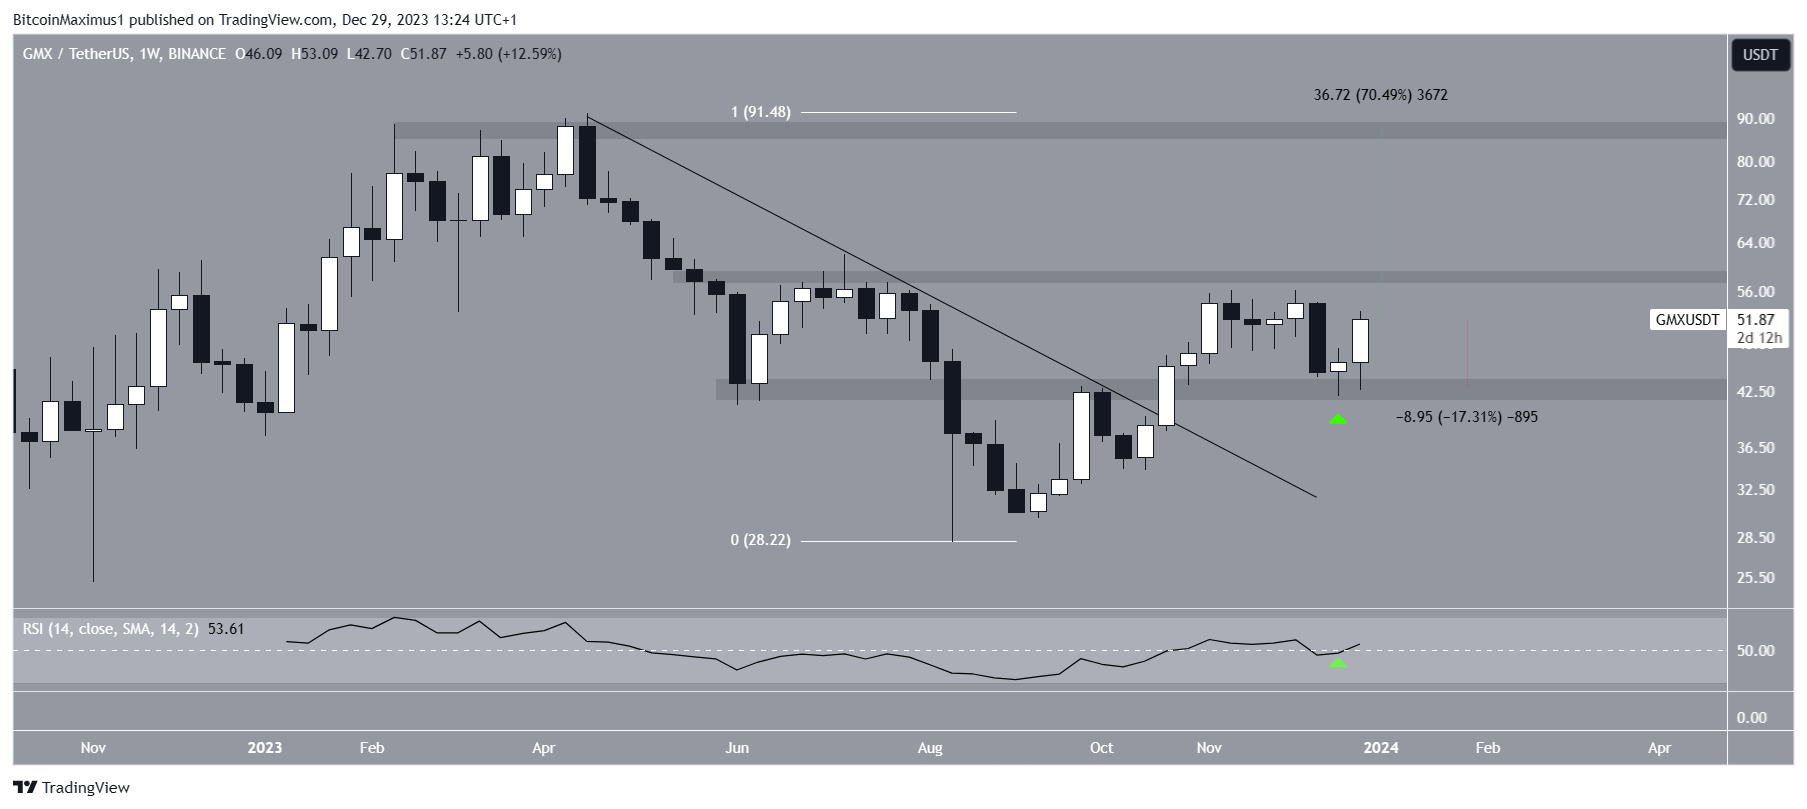
Despite this bullish GMX price prediction, failure to close above $58 can trigger a retest of the $42 support, which would be a drop of 17%.
For BeInCrypto’s latest crypto market analysis, click here


