


The Arbitrum (ARB) price has increased swiftly since December 26 and is approaching its all-time high.
ARB broke out from a horizontal resistance area and faces only one more resistance on the way to its all-time high.
Arbitrum Breaks Out From Resistance
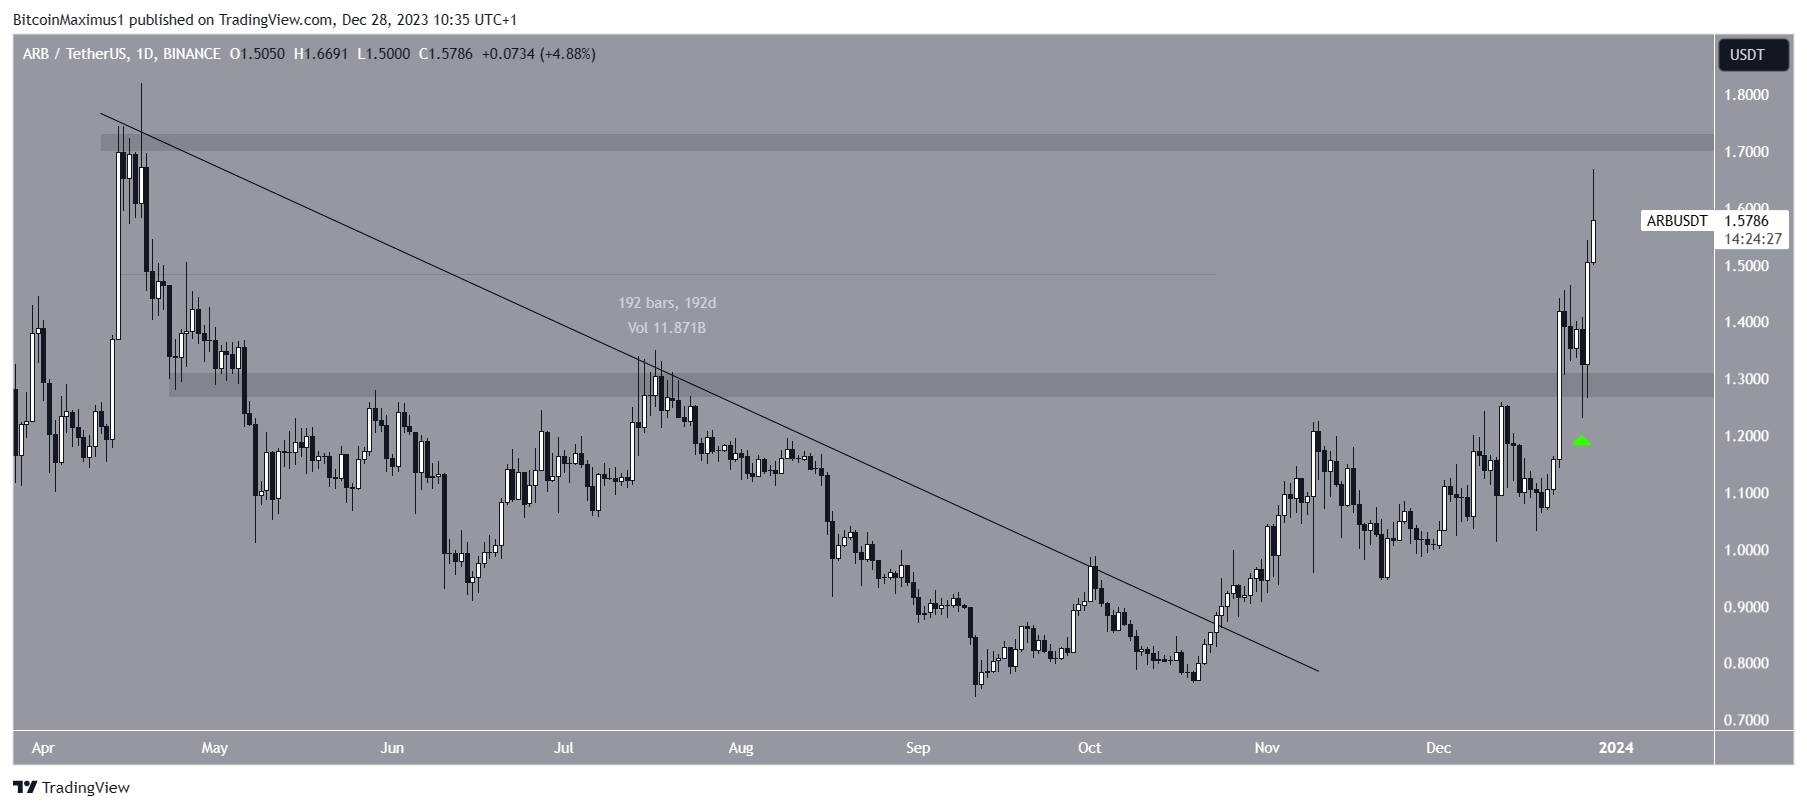
The ARB price has increased since falling to a low of $0.74 on September 11. The price created a higher low on October 19 and accelerated its rate of increase afterward.
The price broke out from a descending resistance trend line on October 23. Before the breakout, the trend line had been in place for 192 days.
Initially, ARB struggled with a pivotal horizontal resistance area but finally broke out in December, validating it as support on December 26 (green icon) and creating a long lower wick.
ARB is approaching its all-time high resistance of $1.82.
Cryptocurrency analysts and traders have a positive outlook for the future ARB trend. Route 2 FI believes a rotation toward the Ethereum (ETH) ecosystem is underway. He tweeted:
Interesting to see $SOL, $INJ, $SEI, $TIA, and $AVAX taking a break here. Seems like Ethereum and $ETH betas are the future of France again. $ETH betas: $ARB, $OP, $LDO, $MATIC.
Both Shardi B and CryptoKnight are bullish because of the price action. Due to the lack of overhead resistance, they suggest the rally can become parabolic once the price breaks its all-time high.
Read More: What is Arbitrum (ARB)?
ARB Price Prediction: Will Parabolic Rally Continue?
A closer look at the daily time frame shows that the price action and Elliott Wave readings are bullish.
The wave count indicates that the ARB price is in the third wave of a five-wave upward movement. The sub-wave count is in white, showing an extended third wave, creating a parabolic movement.
Due to the length of the first sub-wave, wave three may extend to 2.61 times the length of wave one. This ARB upward movement of 40% would lead to a high of $2.25.
The daily Relative Strength Index (RSI) also supports this possibility since it broke out from its bearish divergence trend line (green) and is increasing.
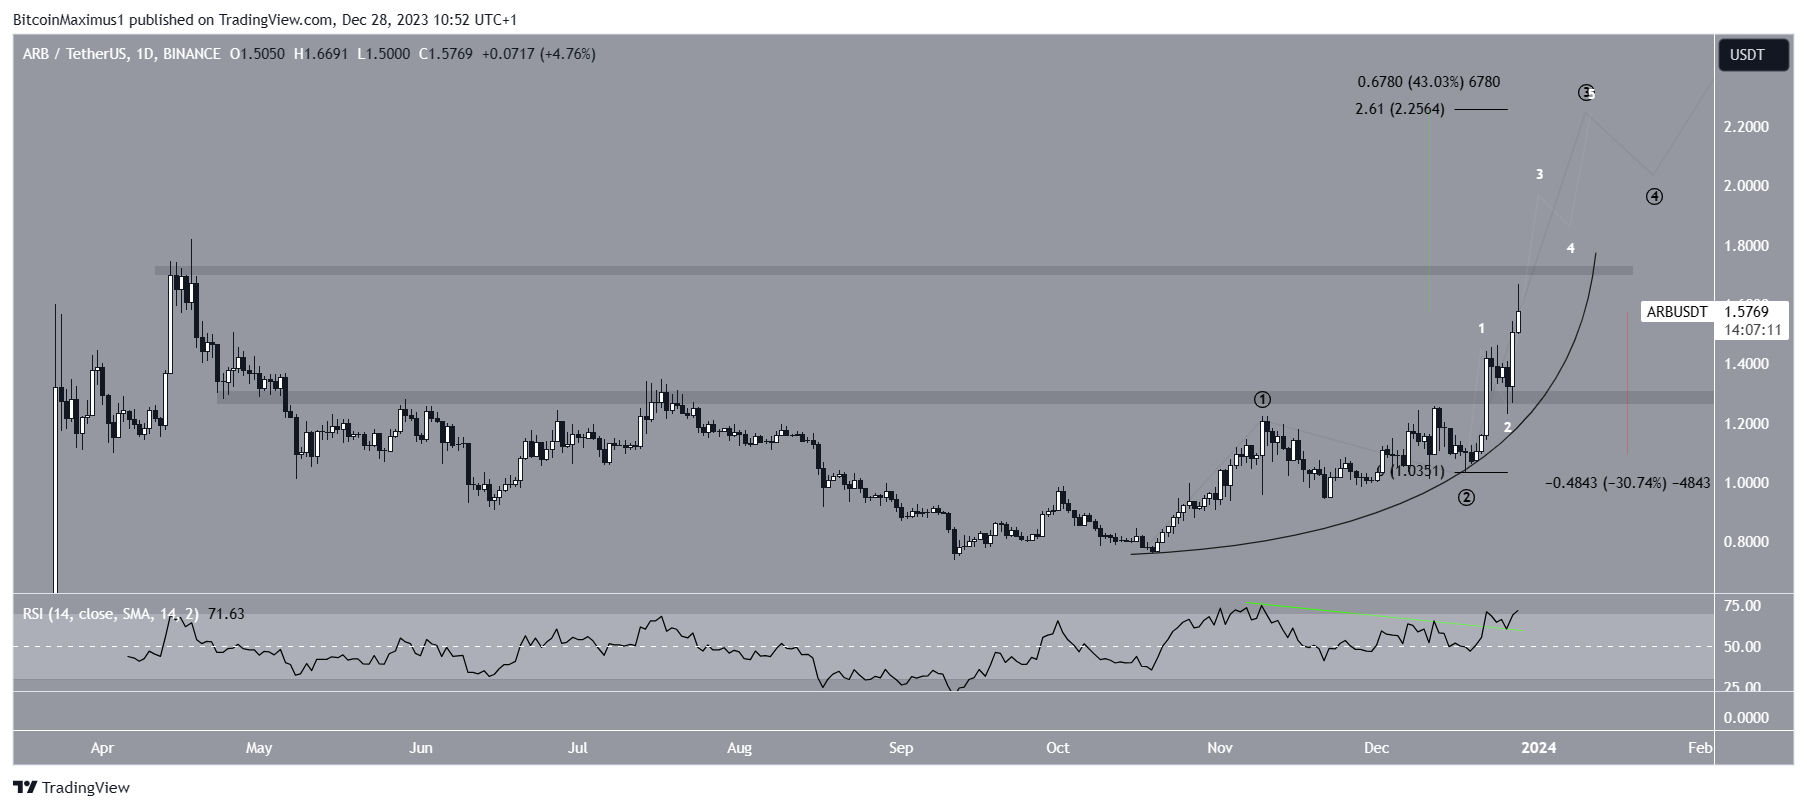
Despite this bullish ARB price prediction, a breakdown from the parabola will invalidate the wave count. ARB could then fall by 30% to the closest support at $1.10.
Read More: How to Use Arbitrum?
For BeInCrypto‘s latest crypto market analysis, click here


