


The Zcash (ZEC) price has broken out from a long-term symmetrical triangle and is moving towards its next closest resistance area.
However, the price is showing short-term signs of weakness, indicating that the first breakout attempt might be unsuccessful.
ZEC Breaks Loose
The ZEC price has been increasing since Dec 3, 2019, when it reached a low of ₿0.03499. It began an upward move shortly afterward, as evidenced by the extremely high volume during the week of Jan 13, 2020.
ZEC had since been trading inside a symmetrical triangle, from which it broke out last week. This is a sign that the price is expected to continue its upward movement.
Furthermore, the weekly RSI has crossed above 50, a sign that the price has begun a bullish trend.
If it continues increasing, the closest resistance areas are found at ₿0.008, ₿0.0105, and ₿0.0125, the latter being the top of the most recent major downward move in June of last year.
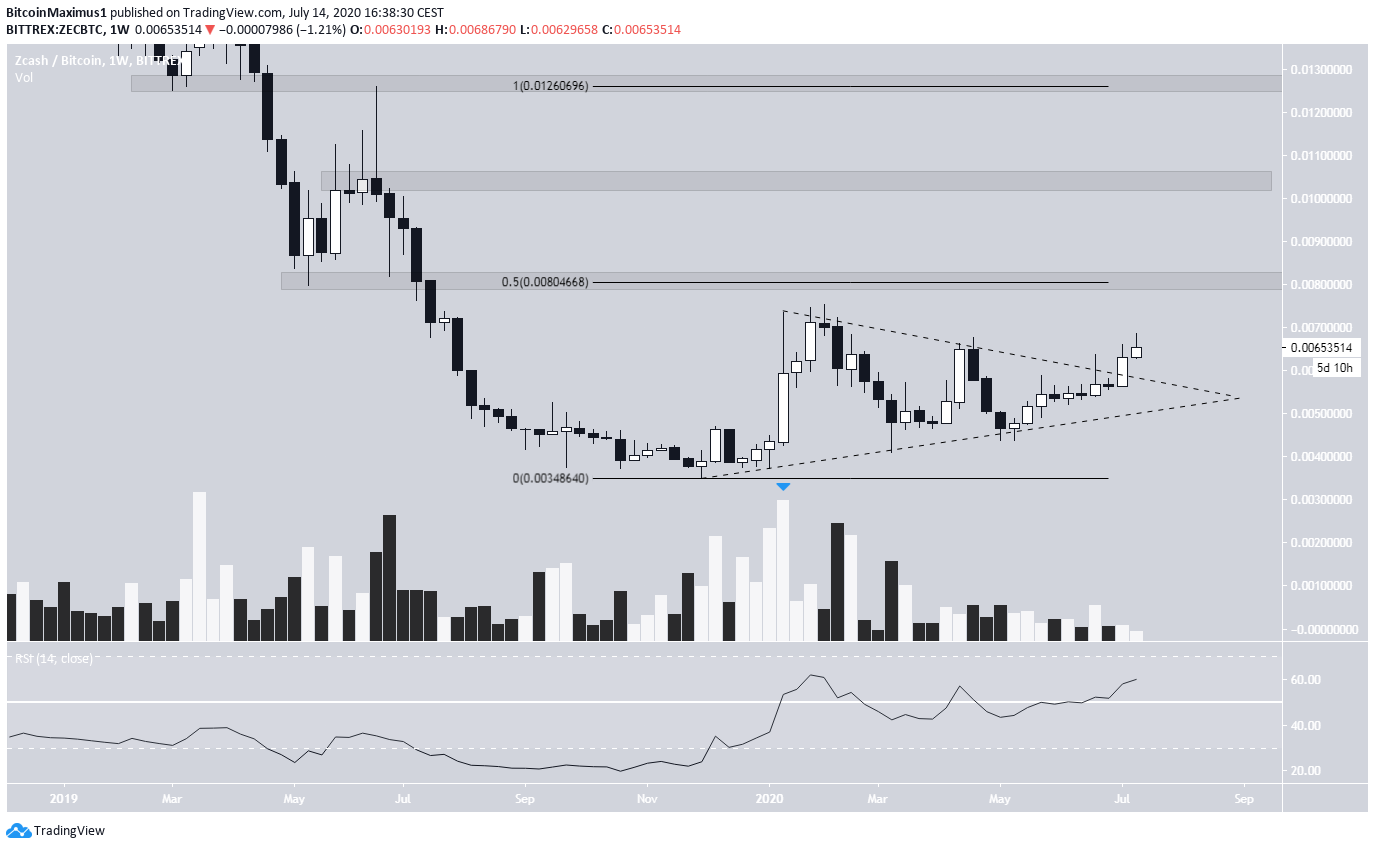
Cryptocurrency trader @Pentosh1 outlined a ZEC chart in which the price is expected to increase by 100%, to reach a high of ₿0.0128. This value is also our final target.
Short-Term Movement
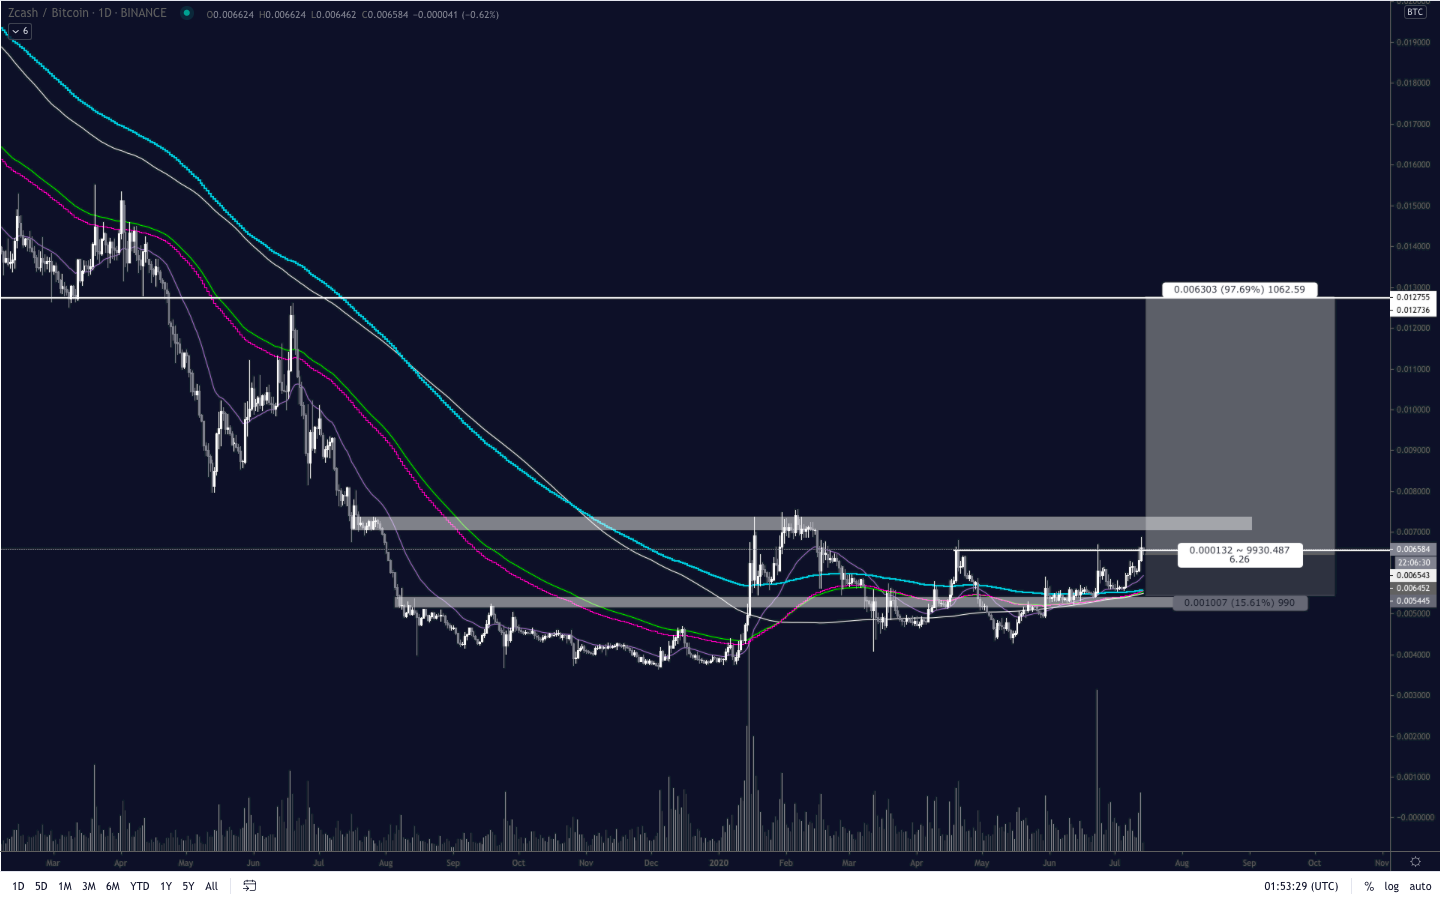
The daily chart shows that the price has been following an ascending support line. This support, however, has not yet been validated enough times, making it impossible to determine its exact slope. In addition, it is currently trading inside the minor ₿0.0067 resistance area.
The 50 and 200-day moving averages (MA) have already made a bullish cross, and are offering support to the price. As long as the price is trading above both these MAs, it is expected to make another attempt at breaking out.

However, the hourly chart is more bearish and shows a confirmed bearish divergence in the RSI.
Furthermore, the price is trading at the resistance line of an ascending parallel channel. Besides creating a confluence of resistance levels, parallel channels usually contain corrective movements, so a breakdown from the channel would be expected.
If one occurs, the price could find support at ₿0.0054, while validating the 200-day MA and the resistance line of the long-term triangle.

To conclude, the ZEC price has broken out from a long-term symmetrical triangle. After a short-term retracement, the price is expected to make another attempt at breaking above the current resistance area.


