


Julian Assange—founder of WikiLeaks—has been arrested. Zcash and Bitcoin (BTC) are being accepted from donors to fund Assange’s legal defense.
Will this bring new attention to Zcash and add a boost to price?
So far, this is unclear. At the current time, Zcash appears to be on a downtrend.
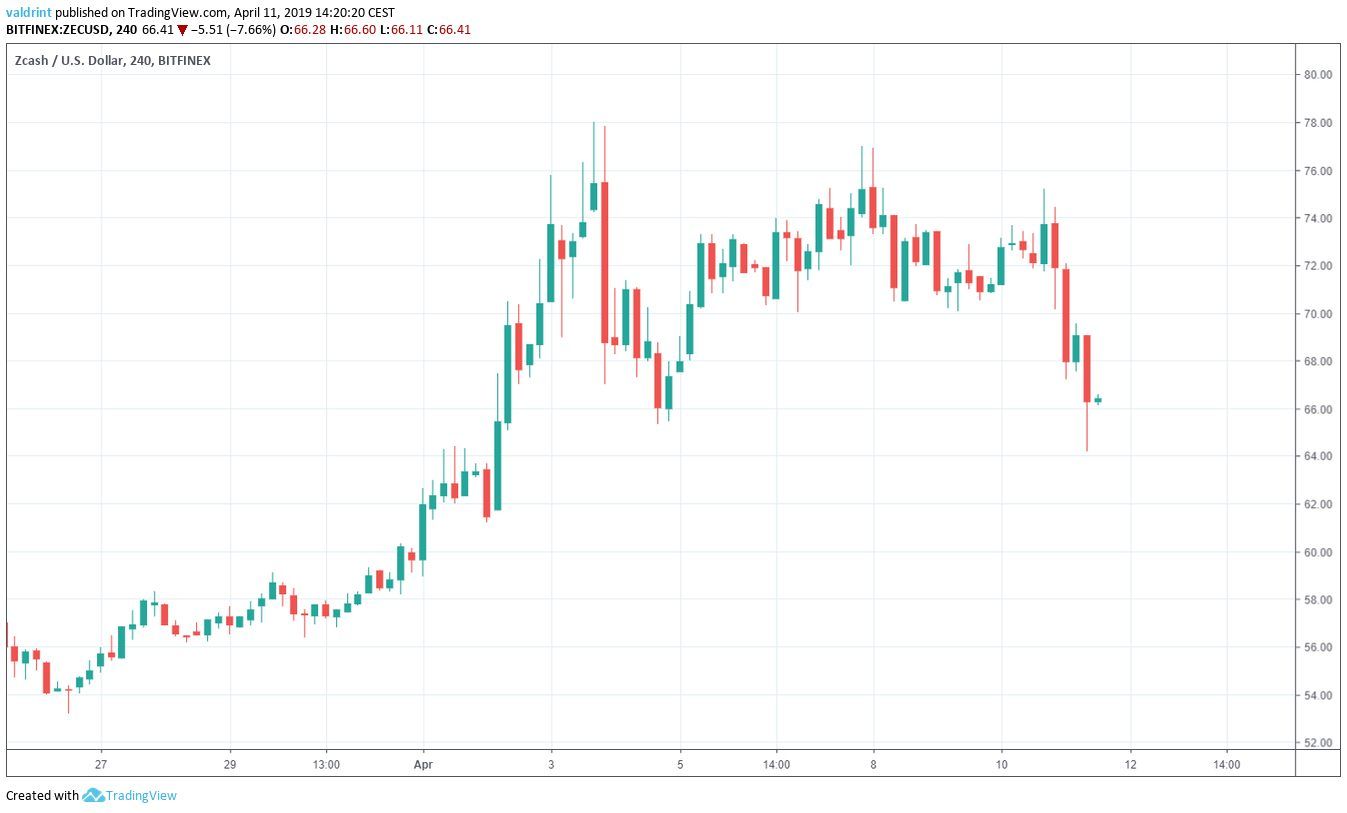
On Mar 26, 2019, Zcash reached a low of $53. A gradual increase accelerated in early April. Zcash reached nearly a high of nearly $80 on Apr 3.
A sharp drop followed this peak. Lows of around $65 were experienced on Apr 4. After a gradual increase, the price dropped and reached a low of $65 again on Apr 11.
Is the price of Zcash going to continue falling or will the arrest of Julian Assange bring new attention and gains to the privacy coin?
Let’s find out.
LEARN ABOUT PRIVACY COINS HERE!
Zcash (ZEC): Trends and Highlights for Apr 11, 2019
- The price of Zcash has been on a gradual uptrend since Mar 26.
- It is trading inside a symmetrical triangle.
- 20- and 50-period moving averages have made a bearish cross.
- There is support near $61.
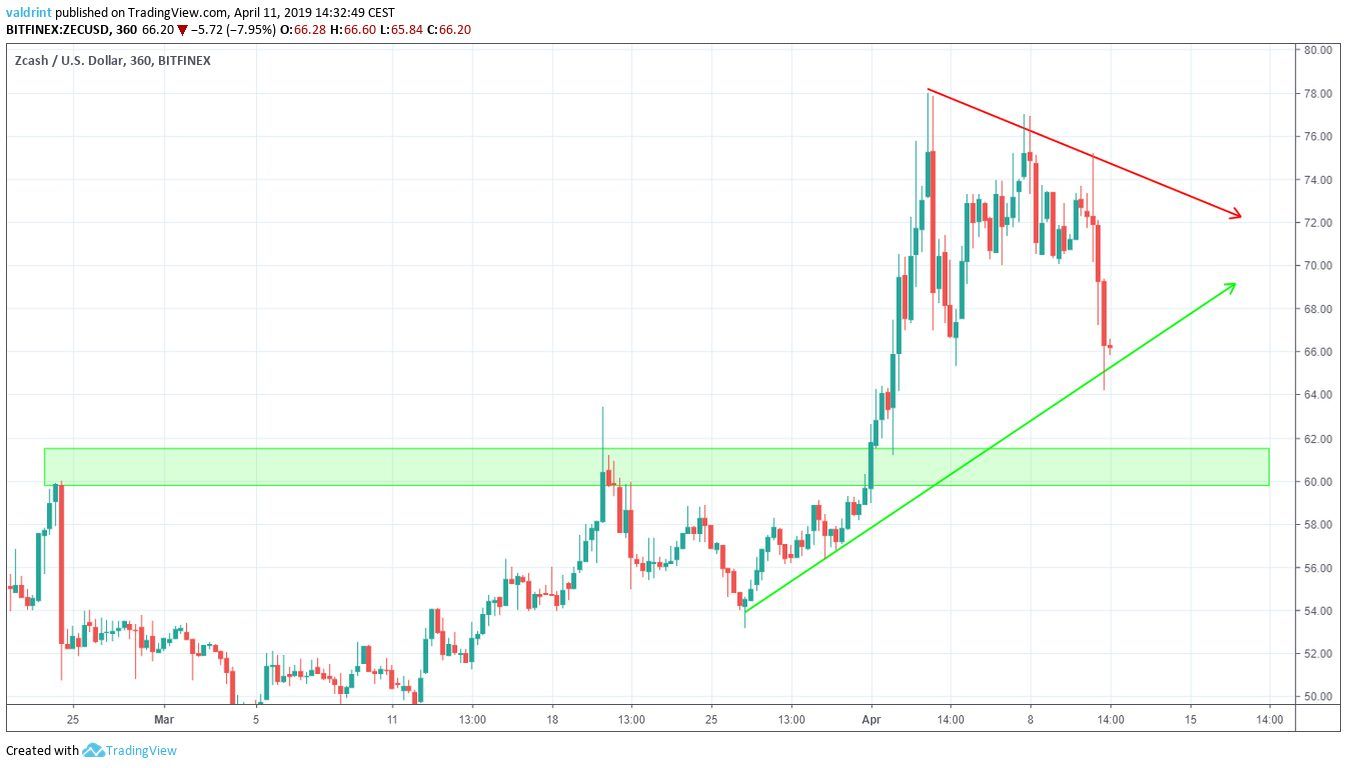
Symmetrical Triangle
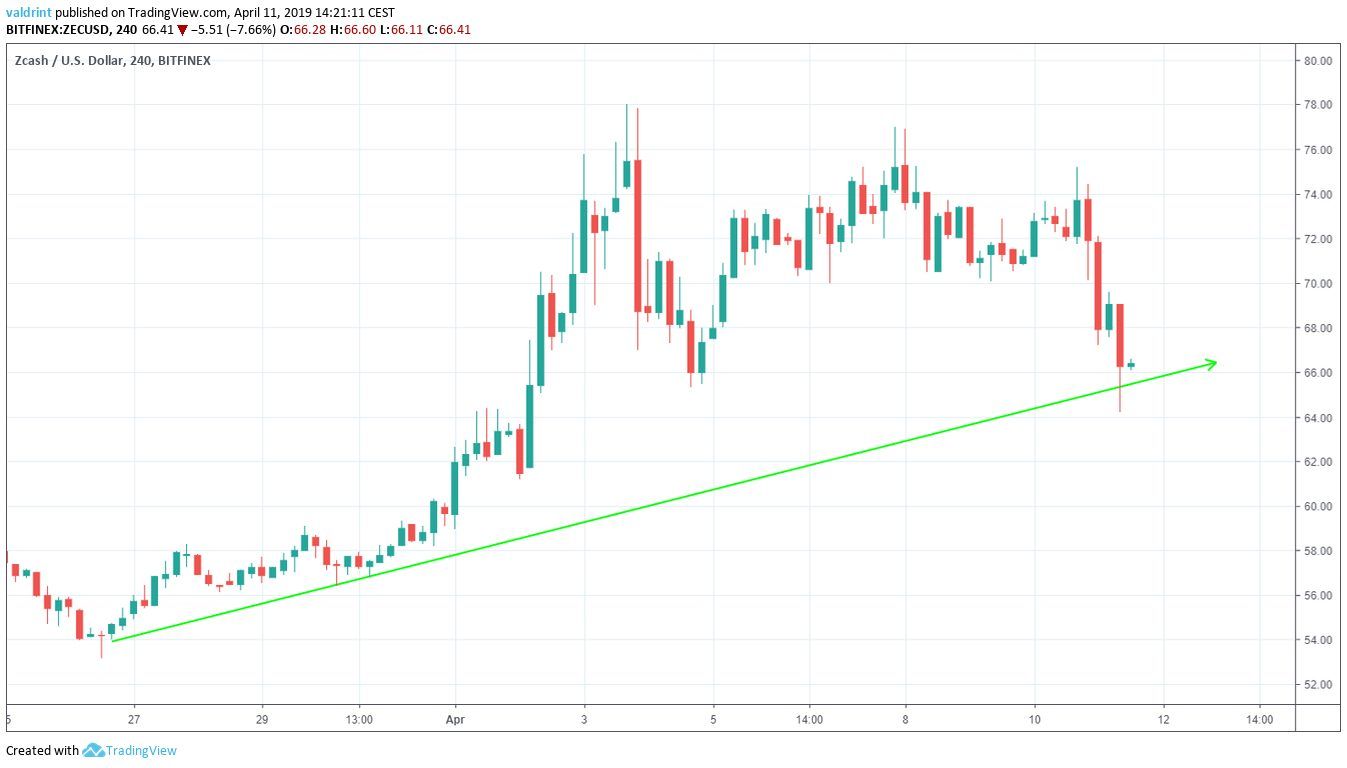
The price made a low of $53.60 on Mar 26. A gradual upward move followed. Several market cycles have been completed since and after each one the lows have been higher than the preceding ones.
Tracing these lows gives us an ascending support line:
On Apr 3, the price reached a high of $78. A sharp drop was followed by a gradual increase. The price has made successive lower highs.
Tracing these highs gives us a descending resistance line.
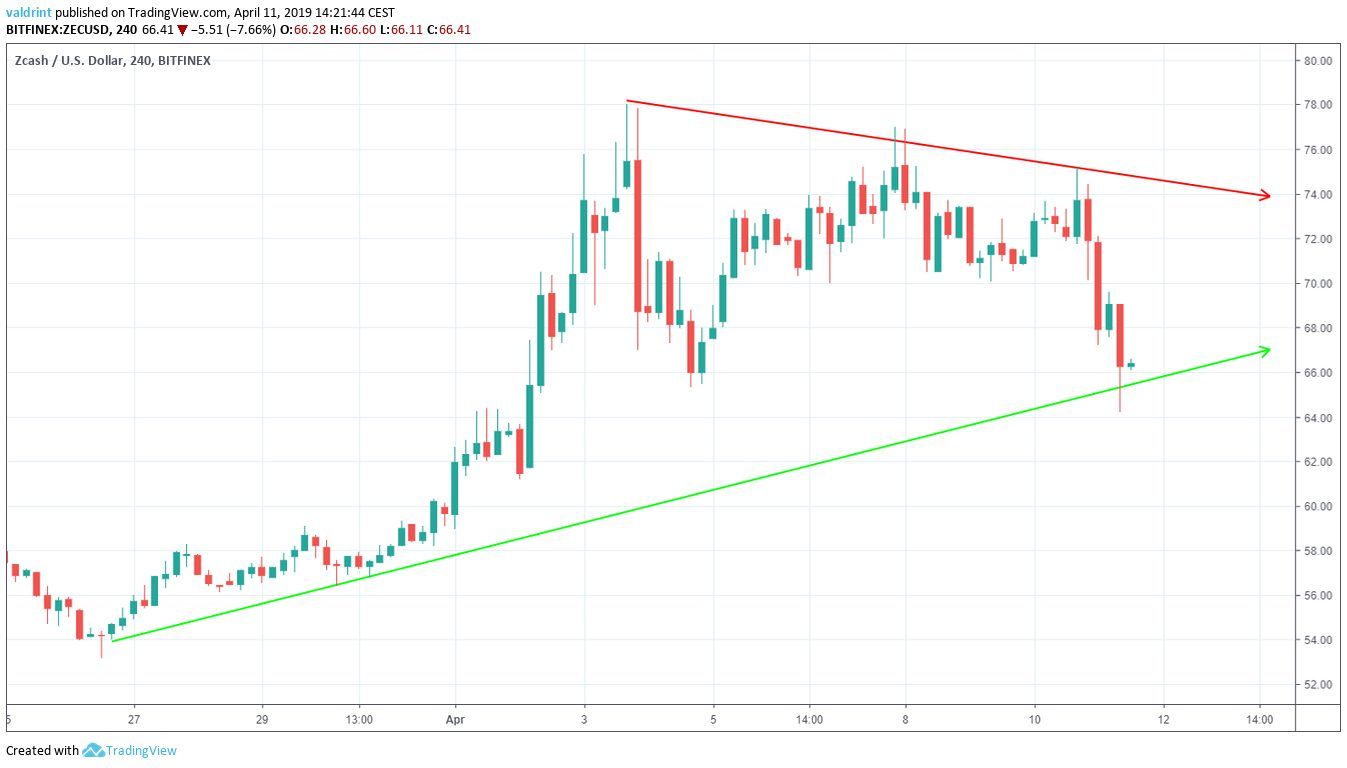
The resistance and support lines combine to create a symmetrical triangle, which is a neutral pattern.
It is likely that the price will keep trading within the confines of this triangle until a decisive move occurs.
In order to figure out the direction of the move, we need to take a look at some technical indicators.
Technical Indicators
We begin by incorporating moving averages into our analysis.
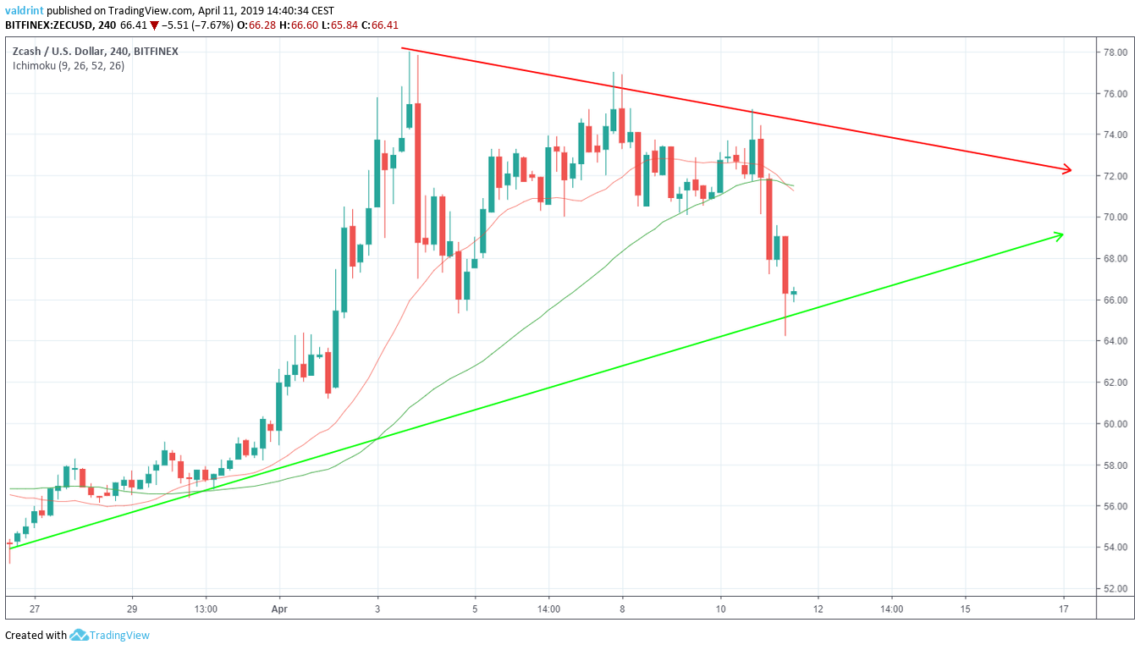
On Apr 10, the price began a rapid decrease. This took it below the 21 and 50-period MAs.
During the same interval, the 20-period MA crossed below the 50-period one.
This is known as a bearish cross and often indicates that a downtrend may have begun.
Using this indicator, we believe that a breakout from the triangle is unlikely in the short-term.
Reversal Areas
The closest support area is found near $61. If the price breaks down from the triangle, it is likely to provide a reversal.
Summary of Analysis
Based on this analysis, the price will likely trade inside the confines of the symmetrical triangle. A breakdown is possible and a breakout remains unlikely.
Do you think the price of ZEC will eventually break down from the triangle? Let us know in the comments below.
If you’d like to learn more about Bitcoin, however, click on the green button below:
Disclaimer: This article is not trading advice and should not be construed as such. Always consult a trained financial professional before investing in cryptocurrencies, as the market is particularly volatile.


